Agrárinformatika 2011 Konferencia. Agricultural Informatics 2011 Conference
|
|
|
- Ferenc Vince Orosz
- 7 évvel ezelőtt
- Látták:
Átírás
1
2 Agrárinformatika 2011 Konferencia Agricultural Informatics 2011 Conference Innovatív információtechnológiák az agrárgazdaságban Innovative Information Technologies in Agriculture November, 2011, Debrecen, Hungary PROCEEDINGS KONFERENCIA KIADVÁNY Edited by
3
4 Preface Dr. Miklós Herdon Prof. Dr. András Nábrádi
5 Agrárinformatika 2011 Konferencia Innovatív információtechnológiák az agrárgazdaságban november Debrecen Agricultural Informatics 2011 Conference on Innovative Information Technologies in Agriculture November, 2011, Debrecen, Hungary A konferencia védnöke A konferencia elnöke: társelnöke: Organisers MAGISZ Magyar Agrárinformatikai Szövetség DE Debreceni Egyetem AGTC Gazdálkodástudományi és Vidékfejlesztési Kar DAB MTA Debreceni Területi Bizottsága Agrárökonómiai Munkabizottság EFITA European Federation for Information Technology in Agriculture, Food and the Environment Program Bizottság elnök: Herdon Miklós (MAGISZ, Debreceni Egyetem) tagok: Andreopoulou, Zacharoula (Aristotle Univeristy of Thessaloniki, Thessaloniki) Batzios, Christos (Aristotle University of Thessaloniki) Cebeci, Zeynel (Cukurova University, Adana) Csák Máté (Pannon Egyetem) Fog Hansen, Nikolai (EFITA) Gaceu, Liviu (University of Transilvania, Brasov) Havlicek, Zdenek (Czech University of Life Sciences, Prague) Huzsvai László (Debreceni Egyetem) Kapronczai István (MAGISZ) Kovács Árpád Endre (Szent István Egyetem) Laczka Éva (MAGISZ) Rajkai Kálmán (MAGISZ) Rózsa Tünde (MAGISZ) Salampasis, Michail (Aristotle Univeristy of Thessaloniki, Thessaloniki) Szenteleki Károly (MAGISZ) Szilágyi Róbert (Debreceni Egyetem) Várallyai László (MAGISZ, Debreceni Egyetem) Varga Mónika (Kaposvári Egyetem)
 Cseh András (MAGISZ) Füzesi István")
 Péntek Ádám (Debreceni Egyetem) Ráthonyi Gergely Gábor")

6 ee elnök: tagok: Szilágyi Róbert (MAGISZ, Debreceni Egyetem) Botos Szilvia (Debreceni Egyetem) Cseh András (MAGISZ) Füzesi István (Debreceni Egyetem) Lengyel Péter (MAGISZ) Pancsira János (Debreceni Egyetem) Péntek Ádám (Debreceni Egyetem) Ráthonyi Gergely Gábor (Debreceni Egyetem) Konferencia támogatók / Sponsors Esri Hungary Kft Mosaic Business System Kft NetWise Informatikai Bt. Neumann János Számítógéptudományi Társaság
7 Tartalomjegyzék / Table of contents / Plenary papers Rózsa Tünde A TÁMOP projekt eredményei 1 Lengyel Péter, Szilágyi Róbert, Pancsira János A TÁMOP portál és az Agrárinformatika folyóirat informatikai megvalósítása 10 Szabó Szabolcs (Pannon Egyetem) Digitális terepmodell készítése a PE- területén 16 Szláma Zsombor (Debreceni Egyetem) a környezeti hatások és a 24 Dorogi Balázs (Budapesti Corvinus Egyetem) Vállalatirányítási Rendszer javaslatok és adatbázis fejlesztése egy malomüzem részére 31 Ioannis V. Kirkenidis, Zacharoula S. Andreopoulou The use of internet new technologies on e-learning model for green development in Greece 40 Josef Myslin, Anna Ryvova, Vojtech Merunka Process modeling and its importancy for agriculture 46 Liviu Gaceu Preliminary Studies Regarding the Infrared Images Uses in the Drying Process of Agricultural Products 53 Mihály Csótó Innovative information technologies and the rural innovation chain - the rise of a networking phenomenon? 59 Mónika Varga, Béla Csukás Development of Sustainable Agrifood Interoperability - What can we Learn from Natural Processes? 64 Jan Tyrychtr, Petr Herold, Havlicek Zdenek, Svarcova Ivana Accentuation and innovation of a conceptual model in the development of database applications 73 Zoltán Hagymássy, Erzsébet Ancza Experience of an Intensive Program Course on Utilization of High Technology Equipment 80 Tünde Csapóné Riskó, Georgina Árváné Ványi Results of a survey on conscious consumerism and food consumption habits among Hungarian higher education students 86 Ibolya Brávácz Results of Cluster Analysis for Foodstuff Consumers 95 László Várallyai, Miklós Herdon E-Competences and ICT in Europe 101 Róbert Szilágyi New Information Technology Possibilities in the Agriculture 109 Imola Cseh Papp,Tünde Csapóné Riskó Economic condition and labour market characteristics of IT sector 115
8 Túri Zoltán, Demeter Gábor A talajvízállás, a csapadék és a felszíni vízállás kapcsolatának vizsgálata a Nyírségben 122 Lazányi János, Loch Jakab Térségi adottságok értékelése a Talajvédelmi Információs Rendszer (TIM) adatai és a 0,01 M kalcium-klorid kivonatban mért talaj-paraméterek alapján 133 Négyesi Gábor, Lóki József A Nyírség potenciális széleróziós térképe - szélcsatorna mérések alapján 141 Tóth Csaba Albert, Lóki József Terepi szél- és lepeleróziós vizsgálatok a Nyírség területén 150 Szabó Gergely Adatbázis szerkesztése sokparaméteres modellalkotáshoz a Nyírség és a Bihar-hegység területén historikus és mai adatbázisok alapján 160 Tóth Csaba Albert - és gyepterületein 166 Túri Zoltán, Balázs Boglárka Huzsvai László, Dövényi-Nagy Tamás, Rajkai Kálmán Ferencsik Sándor, Sulyok Dénes, Huzsvai László Precíziós tápanyag-gazdálkodás gyakorlati alkalmazása 196 Enyedi Péter, Kozma-Bognár Veronika, Gonda Cecília, Tomor Tamás, Ambrus Andrea Bioenergetikai térinformatikai rendszer fejlesztése a Gyöngyösi Kistérség területén 205 Csatai Rózsa, Teschner Gergely, Delbó Balázs és a késztermék készleteknél 212 Teschner Gergely, Csatai Rózsa, Troján Szabolcs Helyzetfelmérés az agrárvállalkozások számítógéppel támogatott állat-törzsadat nyilvántartásának tükrében 218 -Specifikus Térinformatikai e-szaktanácsadási rendszer 227 Aszalós László, Bakó Mária E- Zörög Zoltán, Kisari Krisztián Az 241 Botos Szilvia, Cseh András, Szénás Szilárd Néhány e-szakigazgatási szolgáltatás bemutatása 248 Bótáné Horváth Noémi A közösségi videó, mint infokommunikációs eszköz a vidékfejlesztésben
9 A TÁMOP projekt eredményei Achievements of the TÁMOP project Rózsa Tünde 1 Abstract. "Information is one of resources", "information is power", "information is many", that and similar words appear in professional articles, in tenders, in slogans of business and higher education. The Hungarian Association of Agricultural Information has target dissemination of new and novel scientific results from higher education, which was supported by the European Union and the European Social Fund. This report aims to present this project, its tasks performed and the results achieved. Keywords: higheducation, dissemination of research results, TÁMOP, studies, e-journal, research portal Összefoglaló.. Az, az információ hatalom, az információ pénz, ilyen és ehhez A Magyar Agrárinformatikai Szövetség az új és yos eredmények disszeminációját célozta meg a Európai Unió és az Európai Szociális Alap által is támogatott TÁMOP projektjében. Jelen beszámoló célja bemutatni a projektben végrehajtott feladatokat, és az elért eredményeket. Kulcsszavak: tási eredmények publikáció, TÁMOP, tanulmány, e-folyóirat, tudományos portál 1. Bevezetés A nek zálogát jelentheti, hogy ismerik és alkalmazzák a legfrissebb kutatási eredményeket. A 2008-ban megjelent tudomány szerepének társadalmi elfogadottsága nélkülözhetetlen a ráford eredmények, társadalom és a A Magyar Agrárinformatikai Szövetség egy olyan Egyesület, melynek magánszemély és szervezet 1998-ban és azóta is az alapján végzi a tevékenységét, hogy képviselje azoknak az érdekeit, akik az agrár-ágazatban alkalmazni, használn Az Egyesület alapszabályában az alábbi célokat fogalmazta meg: Az agrárinformatika hazai szakembereinek meghatározó szervezeteként járuljon hozzá az információs társadalom, azon belül agrárgazdasági kibontakozásához. Emellett ápolja a magyar agrárinformatikai vegyen részt szakmai kutatásokban, alkalmazás-,. Az informatikai tájékozottság növelése érdekében informatikai ismeretek fejlesztésében, az Internet-kultúra terjesztésében. Szenteljen figyelmet a tehetséggondozásnak: rendezzen, illetve támogasson országos versenyeket az agrárinformatika területén. 1 Magyar Agrárinformatikai Szövetség, tunde.rozsa@gmail.com 1
10 Ápoljon kapcsolatokat az informatika területén a hazai állami és vállalkozói nemzetközi szervezetekkel. Nyújtson szolgáltatásokat egyéni és jogi tagjainak, képviselje a tagok érdekeit. A szakmai feladatokkal és a Szövetség szolgáltatásaira való társadalmi igény növekedésével. Figyelembe véve a megf - disszeminációja Európai Szociális Alap támogatását. 2. A pályázat tervezett szükségességét és indokolta fontosságát. Kifejtette, hogy a Magyar Agrárinformatikai Szövetség 1998 évi megalakulá technológiák, kutatási, fejlesztési, modellezési, gyakorlati alkalmazási módszerek agrárgazdaságbeli alkalmazásában, terjesztésében és disszeminációjában. Azonban a magyar agrárgazdaság és a vidéki Az ágazat információtechnológiára vonatkozó korábbi fejlesztési stratégiái és elképzelései sem eddigi tevékenység szövetség a nemzetközi kapcsolatai révén a hazai szakmai élet serkentésével hozzájárulna a A projekt céljai: -fejlesztési, innovációs esztésére, megismertetésére információs Kutatási eredmények publikálása, tanulmányok megjelentetése agrárinformatika témakörökben Tudományos nemzetközi konferenciák, hazai rendezvények szervezése Hallgatók és fiatal kutatók tudományos munkájának támogatása A projekt célcsoportjai: szempontjából releváns kutatási témákkal foglalkoznak és a szakmai szervezet jogi tagjai, valamint a A Magyar Agrárinformatikai Szövetség személyi és jogi tagjainak meghatározó többsége azon Ezen intézmények a Debreceni Egyetem, Budapesti Corvinus Egyetem, Szegedi Tudományegyetem, - Magyarországi Egyetem. eredményeik közzétételére, lektorált publikációkkal kutatási eredményeik elismertetésére és disszeminációjára. akik számára a projekt révén a kutatási eredmények nagyobb hatékonysággal eljuttathatók, 2
11 Az ágazatir - és szakigazgatás fontos feladata az információs rendszerek -szolgáltatások nyújtása saját szervezeten ga A gazdálkodók számára a fenti rendszerek használata, saját gazdasági tevékenységük fejlesztése amelyet az portál információszolgáltatása támogat. A projekt során tervezett tevékenységek: Partnerek és abszorpciós képességek el partnerek bevonásával. Közvetett módon a partnerek további 3 csoportja vesz részt: a.) a álói, a vállalkozások és az kapcsolataik révén eddigi tevékenységével már igazolta eredményességét és támogatás esetén hogy a személyi és jogi tagok A javasolt projekt alkalmazási eredmények disszeminációja fontos az ágazat fejlesztésében. Az 1990-es évek -gazdasági változások, c.) az Szakmai tartalma és célrendszere: A projekt szakmai tartalma: a.) tudományos portál létrehozása, b.) elektronikus folyóirat magyarországi rendezése, e.) fiatal kutatók támogatása. tudományos portál, kutatás- megismertetésére szervesen kapcsolódik a szakmai szervezet alapcéljaihoz. Az Információ technológia az agrár s hiánypótló szakmai szervezetek és gazdasági vállalkozások részére. Az agrárinformatika témakörében kutatási eredmények publikálása, tanulmányok megjelentetése ételt A tudományos nemzetközi konferenciák, hazai rendezvények szervezése részvételt. Az informatika területén a hazai állami és vállalkozói szférába való kapcsolatokat fejleszti, valamint hozzájárul a nemzetközi eredmények megismeréséhez, a hazai eredmények külföldi szakemberekkel való megismertetéséhez és a nemzetközi kapcsolatok fejlesztéséhez. 3
12 A hallgatók és fiatal kutatók tudományos munkájának elismerését, megismertetését pályázatok szereplésre. támogatásával az alábbi egyesületi célok kerülnek támogatásra: A projekt célrendszere: Hosszú távú célok nemzetközi disszeminációját, a hazai szakemberek ne Hosszú távú célok: Nemzetközi szervezetek (EFITA, AFITA, PANFITA) európai és világkonferenciáin való magyar szakemeberek részvételi arányának növelése, melyhez a projekt keretében nemzetközi kapcsolatok fejlesztése hozzájárul. - fe Rövid távú célok fenntartásáv disszeminációja. mely megalapozza a nemzetközi folyóiratokban való publikálás le Information Technology in Agriculture). társadalmi elismertetése és megismertetése. Várható eredmények és hatások: A projekt révén javul a szakterület információ ellátottsága. Az agárgazdaságban alkalmazott Ilyen fontosabb területek: e-kormányzati, és e- -kereskedelem, vállala ulna a iánypótlást jelentene. Hazai viszonylatban e területen fiatal szakemberek járulna tló 4

13 3. A projektben elvégzett feladatok csoportjait a 1. ábra szemlélteti. 1. ábra. Feladat csoportok tervezése. A A fejlesztést Az e-folyóirat részfeladatait egyszer Egyszeri feladatok: Kuratórium megalakulása, e-journal rendszer tervezése, e-journal rendszer implementálása. javaslatok befogadása, iktatása, lektorok kiválasztása, elküldés lektorálásra, szerkesztése, kiadása, terjesztése A tanulmánykötetek részfeladatai a cél jellegének ak voltak az e- Kiválasztás, Kutatói felkérések, Tanulmányok kutat Lektorálási folyamat, Szerkesztés, Nyomdai munkálatok 5

14 Részfeladatok: Pályázatok befogadása, Lektorálás, keretein belül került ünnepélyes átadásra. A szakmai rendezvények keretein belül meghatározott részfeladatok közé tartozott az éves rendezv webrendszerek üzemeltetése, cikkek befogadása, szerkesztése, esetenként lektorálása, kapcsolattartása formában, közzététel elektronikus formában. 4. Keletkezett eredmények A projekt keretein belül keletkezett eredmények bemutatását célok szerint ismertetjük. Tudományos portál mi és formai terve, melyben felhasználásra kerültek az egységes arculati elemek. interoperabilitás, skálázhatóság, modularitás, linkek b Web 2.0 alkalmazások (Facebook, RSS). tárolási és archiválási rendszert úgynevezett PolDoc rendszert használtunk, amely egy hálózatba törté letöltési meta adatok tárolását egy MySQL adatbázisban. Így a felhasználók kereshetnek dokumentumokat és fájlokat, aminek alapja egy beágyazott A tudományos portál 2. ábra) 2. ábra. tamop.magisz.org A portá kategóriákat tartalmazza: Agrárinform tudományos folyóirat oldalaira, 6

15 Konferenciák: a szakterülethez kapcsolódó saját és társzervezetek által szervezett konferenciák, szakember találkozók felsorolása található, a rendezvény oldalra mutató linkekkel. felsorolása található a bejegyzés alatt, mint Agrárinformatikai Tanulmányok, Konferencia Kiadványok, Egyén kiadványok, szakkönyvek kategóriákban. k, események. Hallgatói tudományos munkák: a meghirdetett hallgatói pályázatra beérkezett tudományos ek felsorolását tartalmazza. Dokumentumtár E-folyóirat Az e- Agrárinformatika folyóirat a journal.ma 3. ábra). A Az e 3. ábra. journal.magisz.org A 4 szám cikkei lektorálási folyamatban vannak. Megjelenése a 2011 november hónapban várható. Tanulmánykötetek A projekt kereté harmadik lektorálás alatt van, a negyedik tanulmány cikkei beküldésre kerültek. A megjelent tanulmányokban az alábbi cikkek jelentek meg: 1 kötet: Füzesi István: A húsipari termékpál Lengyel Péter: e-learning portálfejlesztés és alkalmazás az agrárszakember képzésben Kozma-Bognár Veronika: Hiperspektrális felvételek új képfeldolgozási módszereinek alkalmazási Rózsa Tünde: ERP rendszerek kiválasztása és értékelése, különös tekintettel az élelmiszeripari vállalkozásokra 7
16 Szenteleki K. Bartholy J. Soltész M. - Torma Cs.: gyümölcstermesztésben Szilágyi Róbert: Mobil Internet az agrárgazdaságban 2 kötet: Csák Máté: felhasználásával) : felmérés a Dél- körében : A kis téliaraszoló (Operophtera brumata L.) rajzáskezdetének és rajzáshosszának elemzése, és várható változásainak becslése Péntek Ádám: Elektronikus üzletviteli aktivitás felmérés a Észak-Alföldi régió KKV-i körében A 3-ik kötetben 5 db tanulmány áll lektorálás alatt, a 4- beküldésre Tudományos rendezvények Nyári Egyetem 2010 organic.edunet nemzetközi konferencia 2010 Harnos Emlékkonferencia 2011 Agrárinformatika Nemzetközi konferencia 2011 Fiatal kutatók támogatása A pályázatok 2010-ben és 2011-ben kerültek megrendezésre. A beadott pályamunkák lektorálásra kerültek. Eredményei: évi Diplomadolgozat pályázat helyezettjei I. Aranyosi BCE, KeTK Web-alapú alkalmazások fejle borverseny program esettanulmány II. felhasználásával II. Soós László BCE, KeTK III. Szabó KRF, érdekében III. Marján Ákos Péter Mozgóképi Váradi László Veronika Eszter ELTE, TTK Terepi mérésre alkalmas szoftver fejlesztése iphone Platformra taxonlisták és gyakorisági eloszlások alapján 8
17 BCE, KeTK Sápi András -line támogatással: On-line benchmarking tesztüzemi adatok alapján évi Diplomadolgozat pályázat helyezettjei I. Szabó Szabolcs II. PE, Kar BCE, KeTK II. III. Dorogi Balázs BCE, KeTK - Kutatóintézet badacsonyi területén Ta pontosság változása a környezeti hatások és a alkalmazásának függvényében -fejlesztése a celldömölki malomüzem részére III. 5. Összefoglaló ó az agrár területen, legyen szó m vállalkozókról, kutatókról, tanácsadókról, döntéshozókról, król, feldolgozóipar tatási intézmények. Ezért különösen fontos, hogy a keletkezett eredmények közkincsé váljanak. Ebben játszik fontos szerepet a Magyar Agrárinformatikai Szövetség tevékenysége, mellyel hozzájárul az innovációs folyamatok hatékonyságának növekedéséhez. E tevékenység azonban nem érhet véget a projekt befejezésével, hiszen továbbra is zervezet között. Ezt Köszönetnyilvánítás A project a TÁMOP kutatási, fejlesztési, alkalmazási eredmények disszeminációja" támogatásával valósult meg. Emellett köszönet illeti azokat a cégeket akik támogatásukkal hozzájárulta a projekthez szükséges saját forrás befizetésével hozzájárultak az Egyesület és ezáltal a projekt sikerességéhez. Hivatkozások Herdon Miklós, Szilágyi Róbert, Rózsa Tünde: Megvalósíthatósági tanulmány MAGISZ TÁMOP projekt dokumentáció 9
18 A Magisz TÁMOP portál és az Agrárinformatika folyóirat informatikai megvalósítása The IT Implementation of the TÁMOP Gateway and its Realization in the Agricultural Informatic Journal Lengyel Péter 1, Szilágyi Róbert 2, Pancsira János 3 Abstract. The Hungarian Association of Agricultural Informatics is implemented The dissemination of research and development on innovative information technologies in agriculture project, which is a part of the Social Renewal Operational Program, New Hungary Development Plan. Within this national program the project can help the diffusion of R&D research results on ICT in agriculture. A scientific journal preparing and an online portal launching is completed in the project. This article describes the IT aspects of the implementation. Keywords:dissemination of research results, portal development. Absztrakt. A Magyar Agrárinformatikai Szövetség a Társadalmi Megújulás Operatív Program, Új Magyarország Fejlesztési Terv keretén belül nyert támogatással valósítja meg az Innovatív információtechnológiák agrárgazdasági kutatási, fejlesztési, alkalmazási eredmények disszeminációja cím projektjét. A projekt keretében egy tudományos portál elkészítése és egy online folyóirat elindítása is megvalósult. A cikkben bemutatjuk a megvalósítás informatikai vonatkozását. Kulcsszavak:tudományoseredményekdisszeminációja, portálfejlesztés. 1. Bevezetés A Magyar Agrárinformatikai Szövetség az Új Magyarország Fejlesztési Terv Társadalmi Megújulás Operatív Programjában az "Innovatív információtechnológiák agrárgazdasági kutatási, fejlesztési alkalmazási eredmények disszeminációja" projektet valósít meg2009 decembert l 2011 novemberig. A projekt célkit zései az alábbiak: Tudományos portál fejlesztése a fels oktatásban keletkezett kutatás-fejlesztési, innovációs eredmények gazdasági szektor felé történ elterjesztésére, megismertetésére információs portál m ködtetésével. Agrárinformatika (Információ technológia az agrár szektorban) cím elektronikus folyóirat megalapítása. Kutatási eredmények publikálása, könyvek megjelentetése agrár-informatika témakörökben. Tudományos nemzetközi konferenciák, hazai rendezvények szervezése. Hallgatók és fiatal kutatók tudományos munkájának támogatása. A tudományos portál lehet séget biztosít a fels oktatásban keletkezett kutatás-fejlesztési, innovációs eredmények gazdasági szektor felé történ elterjesztésére, megismertetésére. Tagjai és a területen dolgozó oktatók, kutatók, szakemberek számára biztosítja a szakmai életben való aktív részvételt. Szolgáltatásokat nyújt egyéni és jogi tagok, valamint az érdekl d k részére. Az elektronikus folyóirat jelent s hiánypótló szerepével, a szakterület számára fontos közvetít médiumként az új tudományos eredmények disszeminációja révén e fontos innovatív feladattal új 1 University of Debrecen lengyel@agr.unideb.hu 2 University of Debrecen, szilagyir@agr.unideb.hu 3 Pancsira János University of Debrecen pancsira@agr.unideb.hu 10
19 szolgáltatást nyújt a tagok és más szakmai szervezetek és gazdasági vállalkozások részére. A szakterület számára hiánypótló magyar/angol nyelv folyóirat, amely segíteni szándékozikk a fejlett információtechnológiák agrárgazdasági alkalmazásánakk területén folyó kutatások eredményeinek publikálását, azok hasznosítását, hasznosulását szolgáló disszeminációját, az ágazat innovációs képességének javítását. Az agrárinformatikai tanulmányok a témakörben elért kutatási eredmények publikálásávall segíti az informatikai tájékozottság növelését. Segíti az agárinformatikai szakemberek tájékozódását. A szakterületen tevékenyked oktatók/kutatók számára kutatási eredményeik megjelentetéséree nagyon korlátozott lehet ségek állnak rendelkezésre. Mivel általában a publikálási költségforrások meglehet sen korlátozottak, az angol nyelv források nem tartalmaznak hazai környezetre vonatkozó kutatási eredményeket, ezért az oktatók/kutatók, PhD kutatások eredményeinek közzététele, publikálása tanulmánykötetekbenn hasznos lehet séget biztosít. A tudományos nemzetközi konferenciák, hazai rendezvények szervezésével fejleszti, el segíti a hazai non-profit és vállalkozói szféra szakembereinek tapasztalatcseréjét, nemzetközi kapcsolatok fejl dését. A Magyar Agrárinformatikai Szövetség elmúlt 10 éves tevékenysége során rendszeresen szervezett hazai konferenciákat, valamint társszervez ként több rendezvény el készítésében és lebonyolításában vett részt. A hazai szakemberek és a szakma támogatását, lehet ségeinek javítását a nemzetközi konferenciák magyarországi megrendezését javítani kívánja a projekt. A hallgatók és fiatal kutatókk tudományos munkájának támogatását pályázatok kiírásával, díjak alapításával és odaítélésével segíti. A tehetséggondozás támogatására a országos és helyi rendezvények szervezését támogatja. A szervezet immár öt éve ír ki diploma/ /szakdolgozat és TDK dolgozat pályázatokat. Ma már egyre több dolgozat születik olyan témakörben, melyek az informatika agrárgazdaságbeli alkalmazások különböz területivel foglalkoznak k. Az egyesület tevékenységének kib vítése e területree három szempontból fontos. 1. Ösztönözi a színvonalas kutatómunkák végzését. 2. Lehet séget biztosít a fiatal kutatók (PhD hallgatók) szakmai elismerésére. 3. A tudományos eredmények szélesebb kör megismertetését biztosítja. 2. Tudományos portál A tudományos információs portál ( lehet séget biztosít a fels oktatásban keletkezett kutatás-fejlesztési, innovációs eredmények gazdasági szektor felé történ elterjesztésére, megismertetésére. Tagjai és a erületen dolgozó oktatók, kutatók, szakemberekk számára biztosítja a szakmai életben való aktív részvételt. Szolgáltatásoka nyújt egyéni és jogi tagok, valamint az érdekl d k részére. A fejlesztési folyamatot az 1. ábra szemlélteti. 1. ábra. A tudományos portál fejlesztési folyamata A portál tervezésnél és fejlesztésnél az alábbi követelményekre különös figyelmet fordítottunk: interoperabilitás, skálázhatóság, modularitás, könny használhatóság, linkek biztosítása a társadalmi hálózatokhoz, 11

20 Web 2.0 alkalmazások (Facebook, RSS). A portál f menüje az alábbi kategóriákat tartalmazza 2. ábra: Projekt leírás, amely tartalmazza az alapvet célkit zéseket. Agrárinformatikai Folyóirat: átirányítja az érdekl d t a tudományos folyóirat oldalaira, Konferenciák: a szakterülethez kapcsolódó saját és társzervezetek által szervezett konferenciák, szakember találkozók felsorolása található, a rendezvény oldalra mutató linkekkel. Kiadványok: a szakterületen megjelen kiadványok felsorolása található a bejegyzés alatt, mint Agrárinformatikai Tanulmányok, Konferencia Kiadványok, Egyén kiadványok, szakkönyvek kategóriákban. Hírek, események: itt kerülnek publikálásra a legújabb hírek, események. Hírlevelek: itt olvashatók a meghatározott id közönként kiküldött hírlevelek. Üzen fal: lehet séget biztosít a szerkeszt k fele történ üzenetküldésre. Hallgatói tudományos munkák: a meghirdetett hallgatói pályázatra beérkezett tudományos m vek felsorolását tartalmazza. Partnerek: az együttm köd szervezetek felsorolását biztosítja. Dokumentumtár A portál tartalma és funkciói tükrözi a Magisz tevékenységét és a projektben vállalt célkit zéseket. Ennek megfelel en alakítottuk ki a portál menüstruktúráját. A portálon a regisztrált felhasználók a belépést követ en érik el az összes funkciót jogosultságtól függ en. A belépés a singlesign-in rendszerben történik, ami azt jelenti, hogy belépést követ en nemcsak a portálon definiált jogosultságot kapják meg a felhasználók, hanem a portálhoz integrált dokumentumtárban meghatározott szerepet is megkapják és így elérhet vé válik a dokumentumtár funkciói is. 2.ábra. A Magisz Támop portál felépítése A dokumentumok kezelése lényeges részét képezi a tudományos portálnak. Els sorban a csoporton belüli kommunikációt szolgálja, de kiterjeszthet a különböz jogosultságokkal rendelkez felhasználói csoportokra is. A Dokumentumkezel rendszer lehet ségei: 12

21 Felhasználói menedzsment: az Adminisztrátor beállíthat egyedi és csoportos jogokat a különböz felhasználókat, mellyel le és feltölthetnek dokumentumokat. Kategóriák: a dokumentumok hierarchikus kategóriákba sorolhatók. Cat-From-Dir: segítséget nyújt az állományok megfelel struktúrába történ kezelésére. Feltölthet linkek: lehet ség van linkek feltöltésére, amikor nem egy dokumentum kerül tárolásra az adatbázisban, csupán a rá való hivatkozás. Dokumentum érvényességi idejének kezelése: a dokumentumok érvényességi ideje nagyon fontos a csoportmunka szempontjából, hisz minden felhasználó láthatja, hogy az általa használt dokumentumok meddig érvényesek, valamint feltöltés esetén saját dokumentumának is megadhat lejárati id t. A fejlesztéshez egy nyílt forráskódú, kifinomult tárolási ésarchiválási rendszertúgynevezettpoldoc rendszert használtunk, amely lehet vé teszi a felhasználókegyhálózatba történ feltöltési és letöltési m veletek elvégzését és a meta adatok tárolását egymysqladatbázisban.ígya felhasználók egy gyorsítósávon keresztül könnyenkereshetnek dokumentumokatés fájlokat, aminek alapja egy beágyazottkeres motor. A projekt folyamán fontos információkat kaphatunk a portál használati statisztikájából, amit a GoogleAnalytics, statisztikai eszközzel végzünk. ennek eredménye látható a 3. ábrán. 3. Agrárinformatika Folyóirat 3. ábra. A MagiszTámop portál látogatottsági statisztikája Az Agrárinformatika Folyóirat a projektnek egy rendkívül fontos disszeminációs eszköze. A szakterület számára hiánypótló magyar/angol nyelv folyóirat a fejlett információtechnológiák agrárgazdasági kutatási és alkalmazási eredményeit, azok hasznosulását, disszeminációját publikálja, javítva az ágazat innovációs képességét. A vállalati, gazdálkodói szinten végzett kutatások, vizsgálatok eredményeinek hasznosulását, az érintettekhez való eljuttatásának feladatát a folyóirat hivatott betölteni. A gazdálkodásban alkalmazható információs rendszerek és technológiák bevezetését segít módszerek és ismeretek közzététele a folyóirat feladata. Továbbá a számos alkalmazási lehet ség mellett az élelmiszer problémák megel zését, mérséklését segít információtechnológiai 13

22 lehet ségek ismertetése, az internet, a mobil lehet ségek alkalmazásának publikálása is a folyóirat célkit zése. Mivel egyre több kutatóhelyen, doktori iskolában folynak az agrárinformatikai tématerülethez kapcsolódó kutatások, a folyóirat szükséges közvetít közeget kíván biztosítani a tématerületen vagy ehhez kapcsolódó területeken dolgozó kutatók és gazdasági szakemberek, valamint az ágazatirányítás szerepl i közötti kutatási, fejlesztési és alkalmazási eredmények ismertetésére. Az elektronikus folyóirat lektorált, kuratóriummal és szerkeszt bizottsággal m köd kiadványként tölti be funkcióját. Mivel az on-line folyóirat teljes menedzselése on-line módon valósul meg, beleértve a publikáció beküldésének menedzselését, a lektorálási, szerkesztési és publikálási feladatokat, ezért külön rendszerben valósítottuk meg. Az Open Journal System-et (OJS), egy szabadon használható, nyílt forráskódú rendszert választottunk, mellyel menedzselhet az összes folyamat. Az Agrárinformatika folyóirat a oldalon érhet el, de a projekt portál menürendszerénkeresztül közvetlen linkkel is elérhet. A nyitó oldalon megtalálható a folyóirat adatai (neve, nyelve, megjelenési gyakorisága, kiadója), illetve az eddig megjelent számok. A folyóiratot egy 7 f s kuratórium és egy 21 f b l álló szerkeszt bizottság irányítja. A folyóirat 3 száma jelent meg 2010-ben: az els szám május 30-án jelent meg, melyben 8 cikk jelent meg, 3 angol illetve 5 magyar nyelven; a második szám november 30-án 9 angol nyelv cikkel került kiadásra; a harmadik szám pedig december 21-én jelent meg 6 magyar nyelv cikkel. A folyóirat látogatottsági statisztikáját is a GoogleAnalytics szolgáltatásával végezzük, melynek eredményét a 4. ábra mutatja. 4. Következtetések 4. ábra. Az Agrárinformatika Folyóirat látogatottsági statisztikája A társadalmi és tudományos szerepl k számára egyaránt fontos az innováció az agrár területen, legyen szó mez gazdaságivállalkozókról,kutatókról,tanácsadókról,döntéshozókról, szállítókról, feldolgozóiparról, kiskereskedelem szerepl ir l, vagy akár az végfelhasználókról. Az innovációs folyamatban lényeges szerepl k a fels oktatási intézmények. Ezért különösen fontos, hogy a keletkezett eredmények közkincsé váljanak. Ebben játszik fontos szerepet a Magyar Agrárinformatikai Szövetség tevékenysége, mellyel hozzájárul az innovációs folyamatok hatékonyságának növekedéséhez. E tevékenység azonban nem érhet véget a projekt befejezésével, hiszen továbbra is rendkívül fontos elvégezni az eddig felvállalt feladatokat. A feladatok ellátása érdekében azonban 14
23 együttm ködés szükséges a fels oktatási, a kutatási, intézményi és gazdálkodási szervezet között. Ezt a hídszerepet hivatott ellátni az Egyesület a jöv ben is. 5. Köszönetnyilvánítás A projekt a TÁMOP / ("Innovatív információtechnológiák agrárgazdasági kutatási, fejlesztési, alkalmazási eredmények disszeminációja" támogatásával valósult meg. Hivatkozások Szilágyi R, Lengyel P, Herdon M (2010): Portal for knowledge of agricultural informatics. In: Alexander B Sideridis, Miklós Herdon, László Várallyai Agricultural Informatics Budapest; Debrecen, Magyarország, 2010, Magyar Agrárinformatikai Szövetség, pp Herdon M., Rózsa T., Szilágyi R., Lengyel P. (2011): A Magyar Agrárinformatikai Szövetség oktatás-kutatás támogatása az agrárinformatikában, Informatika a fels oktatásban 2011 Konferencia, Debrecen, Debreceni Egyetem, pp ISBN Herdon M, Csótó M The Role of Intermediaries in the Success of Electronic Claiming for Farm Subsidies in Hungary. In: Fedro S Zazueta, Jiannong Xin (Ed.) 7th World Congress on Computers in Agriculture and Natural Resources. Reno (Nevada), USA, Michigan: American Society of Agricultural Engineers, pp
24 Digitális terepmodell készítése a PE- Digital terrain modeling for the PE-AC Viticulture and Wine Research Institute in Badacsony 1 Abstract. - - Keywords: Összefoglaló Kulcsszavak: zékelés 1. Bevezetés 1 16
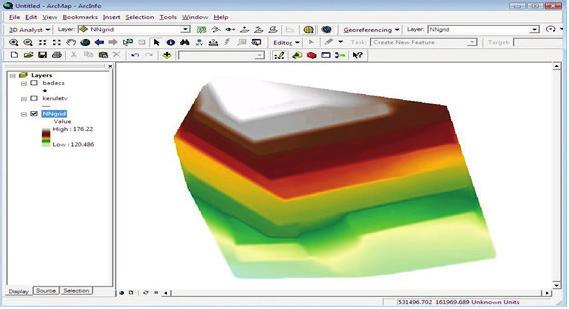
25 - k t állomás -s domborzatmodell 17
26 A GNSS rendszer A GIS rendszer llomás 18
27 2. által - A -es felmérés l és - az ép a -es felmérés és m 3.1. Szoftverkörnyezet A modellezések ák - 19

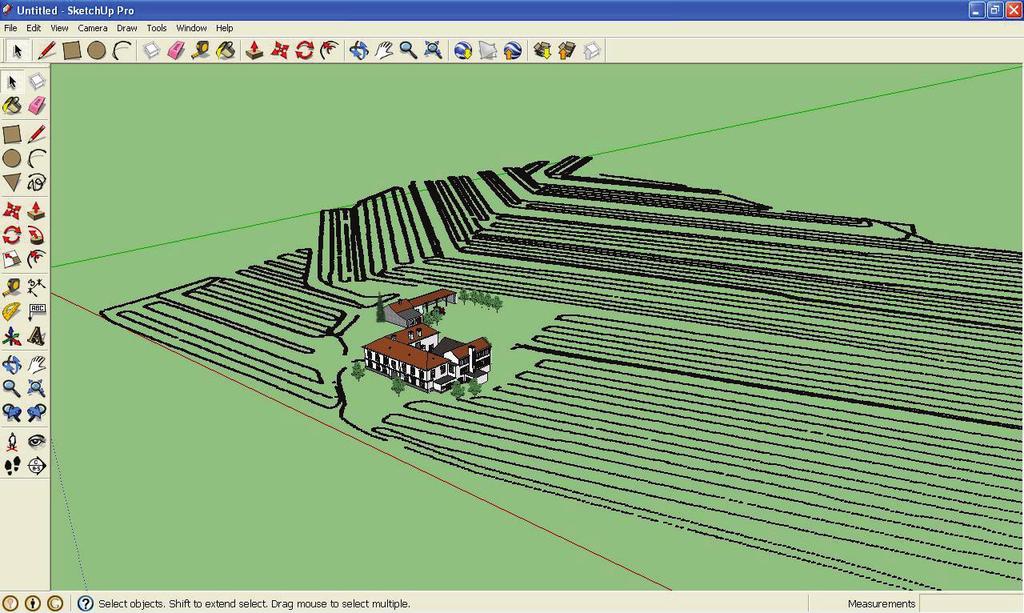
28 3.2. 3D- - latt topográfiai méré -es eltérést -es
29

30 Összegzés - - -s terepmodell és domborzatmodell
31 - - - zembe [
32 RTK satellite navigation system accuracy analysis in case of environmental changes and the use of repeaters 1 Abstract: - Keywords: Összefoglaló: - Kulcsszavak: 1. Bevezetés Real Time Kinematic
33 Technológiai feltételek Rendszer elemek 25
34 4. A
35 Terepi mérés m - 3DRTK- A Mérés a gyakorlatban - 27

![DPHO\HN D Ei]LV ioorpivrnwyo N O QE ]Ę WiYROViJRNUD N O QE ]Ę KHO\HNHQ N O QE ]Ę N UQ\H]HWL](/docs-images/73/68362253/images/36-1.jpg "YLV]RQ\RN N ] WW NpV] OWHN +DMG~-%LKDU PHJ\H KDWiUDLQ EHO O ieud ieud.")
36 Agrárinformatika 2011 Konferencia / Agricultural Informatics 2011 Conference ieud. 57. OHIHGHWWVpJ +DMG~-%LKDU PHJ\pEHQ -HOHQ J\DNRUODWL PpUpVEHQ GDUDE PLQWD NHU OW YL]VJiODWUD DPHO\HN D Ei]LV ioorpivrnwyo N O QE ]Ę WiYROViJRNUD N O QE ]Ę KHO\HNHQ N O QE ]Ę N UQ\H]HWL YLV]RQ\RN N ] WW NpV] OWHN +DMG~-%LKDU PHJ\H KDWiUDLQ EHO O ieud ieud. 0LQWDYpWHOL SRQWRN +DMG~-%LKDU PHJ\pEHQ 28
37 Eredmények
38 - - - m Hiv
39 Vállalatirányítási rendszer javaslatok és adatbázis-fejlesztése egy malomüzem részére Proposals for ERP system and database development for a mill Dorogi Balázs 1 Abstract. The goal of the research is to find a proper enterprise resource planning system for a milling company which realized the importance of such a kind of system in the early past.the owners of the company have assessed the disadvantages of the deficient information technology and through this study they have examined a possibility of implementing an enterprise resource planning system.since the selection of an appropriate system is the most important element of the process, the analyses of the available softwares on the market has been executed by paying attention on the specific needs of the company. The author has also examined the possibility of applying an own developed database software.two ERP systems out of five introduced could be aligned to the processes of the milling industries. The Octopus 8 light and the Microsoft Dynamics are capable to supply the handling of the company's integrated data capture, production, commercial and business processes as well as being closed systems they are providing security within the company, too.in addition a database has been created, which provides more adanced solution for the manufacturing compared to the currently used table based data registration.iftherewillbe no furtherstepintheimplementation of the ERP system - duetofinancial and otherreasons thedatabase software which has beendevelopedbytheauthorconsideringthespecificneeds of thecompanycouldprovidealso a solutionforthecompany. Keywords: Enterprise resource planning system, milling industry, database, Összefoglaló. A kutatás célja egy ideális integrált vállalatirányítási rendszer kiválasztása volt, melyre a tulajdonosai felmérték a hiányos informatikai háttér hátrányát és jelen dolgozat segítségével megvizsgálták egy vállalatirányítási rendszer bev ram alkalmazhatóságának Az Octopus 8 Light és Microsoft Dynamics vállaltirányítási rendszer képes ellátni az érintett vállalat integrált adatrögzítését, termelési, kereskedelmi és ügyvitelei folyamatok menedzselését, illetve zárt rendszere lévén biztonságot is szolgáltat a vállalaton belül. Továbbá létrehozásra került egy adatbázis, mely fejlettebb megoldást nyújt az üzem számára, a jelenleg használt táblázatos nyilvántartásnál. Amennyiben nem történik m, mely a vállalat egyedi igényeinek figyelembe vételével valósult meg. Kulcsszavak: Vállalatirányításirendszerek, malomipar, adatbázisrendszer 1.Bevezetés május 1- Az u vállalkozások számára. atirányítási rendszerek kiválasztása és alkalmazása. Ennek a felismerésnek az eredményeként napjainkban egyre több vállalat kezeli kiemelt fontossággal ezt a területet. Az integrált informatikai rendszerek szükségességének felismerése, bevezetésének ösztönzése és a szükséges szervezeti átalakítások szorgalmazása az üzletfejlesztési menedzserek, döntéshozók kompetenciája. 1 balazs.dorogi@gmail.com 31
40 és középvállalatokat (KKV) is arra kényszeríti, hogy terméküket, szolgáltatás hatékonyság elérésének egyik legfontosabb követelménye a folyamatok optimalizálása, melynek átlátható dokumentáció. Azok a vállalatok, melyek jól struktúrált és azonosítható folyamatokkal rendelkeznek, területeket. A veszteségforrások azonosításával és kioltásával költséget takarítanak meg. A multinacionális vállalatoknál a gazdasági esemény viszont a hazai KKV fel ezen informat A kutatás célja egy ideális integrált vállalatirányítási rendszer kiválasztása volt, melyre a közelmúltban merült fel az igény egy magyar tulajdonosai felmérték a hiányos informatikai háttér hátrányát és az a döntés született, hogy fejleszteni fognak ezen a területen. A cég élelmiszeripari tevékenységet folytat, ami speciális igényeket von maga után. Így a piacon 2. Vállalatirányítási rendszerek 2.1 Egy új ren szemben megfogalmazott elvárásokat. Ennek hiányában egy alkalmatlan eszköz beszerzésével nem ek versenykörnyezethez és a cég profiljához. ták, valamint betekintést nyújtottak a jelenlegi adminisztrációba. - - rendszer táblázatos formában adminisztrált termelési és kereskedelmi folyamatokat egy integrált rendszerben rögzítsék. Ezen túl megoldást szeretnének találni az ügyfelek nyilvántartására, a termelés - magyar élelmiszeripari kisvállalat révén - sen korlátozottak, atirányítási rendszerek piacán. 32
41 2.2 Az Integrált vá yilvántartani a történelemben, mint az integrált vállalatirányítás elterjedését (Wallace, Kremzar, 2006). Egy vállalatirányítási rendszer olyan több modulból álló szoftvercsomag, amelynek célja összefogni a vállalat valamennyi részfolyamatát úgy, hogy a szükséges adatokat integrált módon, egy Feladata egy egységes pénzügyi és számviteli feladatokat, a gyártást, értékesítést és szolgáltatást, logisztikát, üzemeltetést, Az ilyen rendszert használó vállalatok 20%-kal képesek növelni az értékesítésüket, miközben etet szereztünk meg a - 2 Amikor egy vállalat beruház információs rendszerre, infokommunikációs berendezésekre, és méghozzá üzleti- és strat obban integrált, - és információ Napjaink kiélezett piaci versenye a globalizáció, a globális méretekben integrálódó piacok, a Kijelenthetjük tehát, hogy a vállalatok számára a flexibilis alkalmazkodás a piac változásaihoz, a a kihívásoknak a kis- és középvállalkozások hogyan képesek megfelelni? (Hetyei, 2008). Sok vállalat nehézségekkel küzd az adatok szinkronizálása terén, illetve komoly problémát okoz Minden szervezet informáci egységek között az információ egyenletesen és megbízhatóan áramlik és a több üzleti egységen ó vállalkozásnál az információk szinkronizálása a legfontosabb. A megvalósításhoz jól átgondolt - - integrálja az összes rendelkezésre álló információt és egységes rendszert képezzen az eredményes adatfelhasználáshoz. Például az értékesítési egységnek tudnia kell, hogy hány termék van jelenleg raktáron, a készletezési feladatokkal foglalkozó termelésnek tisztában kell lennie azzal, hogy mennyi termék van feldolgozás alatt, a gyártási egységnek pedig elengedhetetlen a nyersanyag mennyiségére vonatkozó tervezés során tehát olyan integrált rendszerre van szükség, ami a szoftverek és hardverek 33
42 2.4 Hazánkban a kis- és középvállalkozások (beleértve a mikro szektort) száma meghaladja a piacon - Közösségek, 2006). A XXI. század elejéig az integrált vállalatirányítási rendszert kínáló cégek többsége a nagyvállalkozásokat, multinacionális cégeket célozta meg, s nekik készített rendszereket. kisvállalatok potenciális célcsoport lehet a termékük értékesítésére, így nagy rendszereiket 1. táblázat. ERP rendszerek részaránya 2007-ben, a nyugat-dunántúli régió kkv-i között(%) ERP vagy Foglalkoztatottak integrált Nincs IT ügyviteli rendszer rendszerek 5-18, ,4 26,1 2. táblázat. - szerkesztés ERP rendszerek ExactGlobe kis nagy X IFS Applications X X Mago.net X X Microsoft Dynamics Ax X X Microsoft Dynamics Nav X X Octopus 8 X X ProgEn - Nagy Machinátor X X ProgEn serpa X X X SAP Business All-in-One X SAP Business One X X a malomipar számára, továbbá a legközelebb állnak a vállalat által meghatározott beruházási költségkorláthoz Exact Global Microsoft Dynamics Navision Octopus ProgEn Nagy Machinár, serpa SAP Business One malomüzem vizsgálata az egyes rendszerekben. A vizsgált szoftverek nagyon hasonlóak, hiszen azonos célból 34
43 számlá -, vagy más esetekben gyártási modulként említett funkció, ami 2.5 A vizsgálat eredménye, hogy a megismert vállalatirányítási rendszerek közül kevés illeszkedik a termelési folyamat kezelésére. A P már fejlettebb, bonyolult folyamatokat is képes kezelni, de a több végtermékes termelési-folyamatot még mindig nem támogatja. - megoldást nyújthat az igényekre. Az ExactGlobe rendszer ugyan képes ellátni a kívánt feladatot, de lényegesen drágább a többinél. való értékesítését a programnak. megtalálható húsfeldolgozó üzem,ami struktúrájában hasonló termelési folyamattal rendelkezik, ahol megállta helyét a NAV. Az ajánlott rendsze versenyképességüket is elveszíthetik ennek hiányában. Javasolt a fejlesztés megvalósításához források Ennél lényegesen olcsóbb átmeneti megoldás nyújt az általam létrehozott adatbázis program, blázatos megoldásokat, így kontrolling, az árpolitika, termelésmenedzsment vagy akár a stratégiaalkotás területén. 3. Adatbázis rendszer Az adatbázis kifejlesztésekor a cél az volt, hogy a jelenleg több táblázatos, néha már bonyolultan meghatározható raktárkészlet mennyiségét gyorsabb módon megtudják, illetve információkat datok 3.1 Tervezése Az egyedi igények kialakításához szükséges volt egy részletesebb üzembejárás, ahol részletekbe bemutatásra került a malom egy átlagos napját. Ekkor került meghatározásra az adatbázis két Termelés Kereskedelem olják. -tervezés -os kiszerelésekbe csomagolják, valamint ömlesztett formában is értékesítik, amit tartálykocsival szállítanak ki. 35

44 A megrendelési folyamat során az ügyfelek telefonon vagy en rendelik meg a számukra szükséges árut, mely megrendelést a raktáros munkatársnak továbbítanak. Az esetek 80%-ban a Az e rögzítenek. Az ár meghatározásában fontos szerepet játszik a rendelési mennyiség és a fizetési paraméterek szerint kategóriákba sorolták 3.2 lehessen üzemeltetni és ne igényeljen plusz kiadást. Ezért esett a választás a Microsoft Office csomagban megtalálható Access programra. Ennek jelenleg több verziója is van, a legfrissebb a Microsoft Office 2010-es csomagban található, ami korábbi verzióihoz képest még inkább szoftvercsomaggal még nem rendelkezik, az ebben való fejlesztés értelmetlen lett volna, hiszen nem -as csomagban található Access-ben hoztam létre az adatbázist. 3.3 Afa Leltar Bolt Megrendelesek Bolti_vasarlok Megrendelesi_tetelek Dolgozok Munkakorok Gepjarmuvek Muszakok_elnevezese Kategoria_arak Termekek Kategoriak Termelesek Kiszerelesek Termelesi_muszakok Kiszerelo Tranzakciok Kiszerelo_tetelei - Az ügyfelek nyilvántartására létre. ábrán látható. Az ügyfél egy ba emeltem ki. 1. ábra. Ügyfelek nyilvántartásának struktúrája 36


45 programrész felépítése a 2. ábrán látható. 2. ábra. Termelés nyilvántartó rész struktúrája A megrendelés során igénybevett táblázatok kapcsolati halmazát az alábbi ábra jeleníti meg. Ez már jóval összetettebb hálózatot alkot, ugyanis itt kezelnünk kell az ügyfelet, a terméket és megrendelés. Szükség volt létrehozni egy Megrendelesi_tetelek egy megrendelésen belüli több termék megrendelését. 3. ábra. A rendelési folyamat során alkalmazott táblák kapcsolati rendszere 37
46 3.4 program indításakor automatikusan megnyí megnyitására létre elsajátíth 4.ábra. A gombok elnevezése beszédes, néhol speciális, de a vállalat dolgozói könnyen azonosítják azokat. itka esetekben lesz rá szükség. Itt találhatók meg az olyan funkciók, mint új termék és kiszerelés bevitele, áfakulcs módosítás valamint a 4. Konklúzió Vállalatirányítási rendszert egy vállalat nem egy-két évre, hanem kis túlzással egy éltre vásárol - ideális esetben. Új rendszert implementálni egy olyan helyzetbe, amelyben korábban nem volt, nehéz, de ennél sokkal bonyolultabb olyan vállalathoz bevezetni problémák is további nehézségeket szülnek egy átállás során, ezért fontos az alapos tájékozódás a kell felvenni a kapcsolatot a részletesebb ajánlat és megoldások kidolgozásához. Javaslatom - amennyiben a vállalt szoftvervásárlás mellett dönt - két rendszert tartalmaz, melyek Octopus 8 Light Microsoft Dynamics Nav Az Octopus 8 Light- ügyfélkapcsolatait. Jelenlegi partnereikkel napi kapcsolatban vannak, ha szükséges, távoli asztal amely nem része a programnak, de az eredményes használatát megkönnyítheti. Microsoft Dynamics Nav jó referenciával rendelkezik, a malomipari termelési folyamatába - Svéd János MultiSoftkft. értékesítési és marketing igazgatója szerint - valósulna meg, áthidaló megoldást nyújthat a vállalat számára az általam létrehozott adatbázisprogram, melyet egyedi igényeik figyelembe vételével hoztam létre. Ennek használata tervezésre, i 38
47 Hivatkozások - és közepes vállalakozások versenyképességének növelése integrált vállalatirányítási rendszerek által, SZE JGK Mul er fejlesztése, bevezetése és sajátosságai a vállalati gyakorlatban, különös tekintettel a kis- és középvállalkozásokra, Nyugat-magyarországi Egyetem, Sopron Thomas F. Wallance, Michael H. Kremzar (2006) - ERP - Vállalatirányítási rendszerek Elektronikus A KKV- Doktori értekezés- 28.) ( április 11.) _The-Global- 2000_IndName_17.html ProductivityMeasures nbet8akstd2rpykgg_3dcwb8iwiiwtnoes - systemsimproveemployeeproductivity - productivity.aspx 39
48 The use of internet new technologies on e-learning model for green development in Greece Ioannis V. Kirkenidis 1, Zacharoula S. Andreopoulou 2 Abstract. Nowadays, a new development model has to be adopted for our country, one that serves mankind and its real needs. The green development, which respects the environment and treats it as a growth resource, is the only feasible and sustainable solution for our country. The relationship between new internet technologies and sustainable growth is proportional and upward. Increasingly, the development, the improvement and the use of the broadband networks and e-services, provides new dimensions in spreading knowledge to all those who have a degree that have a direct or indirect relation with the environment, but also all those who have the burden of decision making for the environment, in order to create education that will be disseminated and adopted by citizens of all ages, to provide design and implementation of a series of "green" operations, which will aim to transform isolated areas, in innovative societies such as the green villages and green islands. Keywords: e-learning, green development, network application, tele-education, new ICT s. 1. Introduction The electronic services provided by the new Information and Communication Technologies (ICT's), have demonstrated as an important tool in efforts to disseminate the electronic learning (elearning) in modern education. The new technologies have entered our lives dynamically and online services are the lever for sustainable regional development (Andreopoulou 2008). Acquisition of Knowledge Instructors e-learning Students Figure 1. E-learning procedure E-Learning is an extremely broad term that covers the above as well as everything else concerning the use of modern technologies in education, regardless of whether it is implemented online, offline or in a combination of them (Black, 2002, Koutroumanidis & Andreopoulou 2009). The technological background is extremely wide (networks, video, PCs, Interactive TV, Satellite Broadcasts, etc.). Broadband (broadband networks) offer qualitative communication and present increasing penetration rates in our country (Andreopoulos, 2010). Broadband technologies have entered dynamically in our country with the production of useful products and services to the community. In particular, networks and broadband can be used for programs with distance learning (e-learning) that contribute to improving the quality of life even in Less Favoured Areas in accordance with the EU, such as remote areas, mountainous areas and islands. (Andreopoulou 2010). 1 Laboratory of Forest Informatics, Faculty of Forestry and Natural Environment, Aristotle University of Thessaloniki, ibkirkenidis@for.auth.gr 2 Laboratory of Forest Informatics, Faculty of Forestry and Natural Environment, Aristotle University of Thessaloniki, randreop@for.auth.gr 40
49 The term e-learning is quite general and encompasses any form of education that uses the resources of the network or more generally the potential of computers and distance education (Figure 1). The e-learning courses can be classified into synchronous and asynchronous depending on whether the students participate actively and in real time or not (Mamoukaris & Economides 2001, Andreopoulou et.al., 2006). In the first case we have a real-time communication (eg chat rooms, video-meetings) where there are questions and answers on any topic. In the second case, the participants communicate in non-real time without needing to be connected online at that moment. In asynchronous communication everyone develops his answers to the issues under discussion and puts his own questions waiting for another time to get a reply. (Koutroumanidis & Andreopoulou 2009). Such may be additional instructions that can contain text, the explanations on some topics, references to links on the Internet where information sources are inexhaustible and alternative forms of communication with the manager of the course for more direct and comprehensive teaching. (Koutroumanidis & Andreopoulou 2007, Kyrkenidis others 2011). E-learning may therefore be a tool for direct transmission of knowledge, without spatial limitations. Knowledge that is needed to formulate the philosophy towards seizures which follow one another in the early 21st century. Today more than ever, we must adopt a new development model for the country. A development model that serves the people and their real needs. The green development that respects the environment and treats it as a growth stock is the only feasible and sustainable solution for the country. Green development is a proposal for a new kind of pioneering development, where the environment and the quality is not a parameter or another sectoral policy, but the main axis and the base of an innovative and alternative development plan of a country in the global socio-economy. (Andreopoulou et al 2006). A key element is to develop and promote technologies that aims to industrial production and services based on the protection and the alternative and sustainable exploitation of the environment. (Ministry of Environment, Energy and Climate Change 2009). Exploitation that can be done through renewable energy, (Tavner 2008), environmental design of houses (Spengler & Qingyan 2000, Shobha S. et all 2003, Seyfang 2010), greenhouse gas reduction (Heiskanen et all 2010), etc. The design and development of integrated sectoral policies and programs is needed, which will start from the legislation, the financial incentives, the research, the technical training of necessary skills, but with greater emphasis on integrating Education we must first give ourselves and then, with care, to the future generations. The purpose of this work is to create a model of e-learning to support an online seminar with a content of the topics of green development. 2. Materials and methods The implementation of this effort to create an e-learning model for green development was a logical series of steps-stages. The steps followed are: Collection of data from scientific literature references (Spengler & Qingyan 2000, Shobha S. et all 2003, Tavner 2008, Koutroumanidis & Andreopoulou 2009, Heiskanen et all 2010, Seyfang 2010), use of a web material, digitizing of material, processing images, translations, creating audio and video, completion of application, control of quality and operation of program (Laudon & Laudon 2000, Mann 1998, Hardaway & Will 1997, Croy 1998, Allen 1998, Andreopoulou et al. 2006, European Commission 2006, Koutroumanidis & Andreopoulou 2007, Cameron 2008,) The design of educational multimedia environment that will be created, it will primarily driven towards a friendly approach even by the less experienced users. In this way, large groups of users through are able to have access, through the educational application, to reliable qualitative and quantitative information and to be trained in the relevant articles of green development given through the process of e-learning. 41
50 The material which was initially collected in the form of texts, images, video, graphics, etc. was digitized for incorporation into a multimedia system. For this purpose various software packages were used like the software tool of Macromedia Studio MX 2004, Dreamweaver CS5 to design the site, while the implementation of the application was supported by the Adobe Photoshop 7.0 for the design of the optical material and image files (. Jpg,. Gif), the tool Nero 7.2 software for the process of visual material (videos) and MS Office 2007 for the development of information added to the request in text form, and for the presentations-lectures. Finally, the Windows Media Player 10 was used for the presentation of audiovisual material. The best recommended resolution for the application is 1024 x 768 pixels. 3. Results The program is being designed, to have the following characteristics. responsible for organizing and conducting of the seminar, is the LAN Computer Workstation in Faculty of Forestry and Natural Environment, Aristotle University of Thessaloniki, Greece. the seminar will take place once every two months, with a duration of five hours per day for five days, in groups of 15 persons the speakers will be experts on each subject in Greece and/or abroad, so the seminar will be using video conferencing programs, (Figure 2), after the presentations, participants will get an id and a password, to join the application of the e-learning website. The model to be used in order to create the e-learning website will follow the pattern below, as discussed and shown in Figure 3, Feed back Tele-Conference Seminar (Tele education) LAN Computer Workstation Faculty of Forestry and Natural Environment Figure 2. The model of the seminar e-learning Application The upper part shows the title of the application and the name of the institution. In the upper right section of the screen are the options for the connection of users and the map of this site (sitemap). Below is a selection list of instructors where their contact information can be found, along their CVs (curriculum vitae). Then follow the basic options of the application, which are: 42

51 Lectures: contains multiphase audiovisual material on green development, aiming to the process of presenting the issues to be easily understood by the participants / students, given by the speakers of the seminar. The theme of the content consists of modules which will coincide with the actions of the program of the Ministry of Environment, Energy and Climate Change as listed below. a) Electricity generation from wind and photovoltaic parks b) Storage of electricity produced from renewable energy in batteries, hydrogen production through electrolysis and reuse to power generator pairs. c) Intelligent Networks. d) Reduction in energy consumption with simple daily actions, e) Bioclimatic Design of Buildings and Surrounding Areas (insulation, cold paint, equipment upgrade for heating / cooling, use of solar energy and geothermal energy). f) Utilization of biomass for combined generation of heat and power. g) Waste management, recycling, compost production. h) Management of water resources, desalination powered by renewable energy, waste management for irrigation. i) Use of electricity in public transportations. j Creating opportunities for green entrepreneurship and attracting investments (ecotourism, rural tourism, production of ecological products, promotion of local cuisine and crafts, etc.). Figure 3. Virtual e-learning environment. Notes. For each module will be provided notes, corresponding to the lectures which will include the entire context of the subject presented and must be assimilated by the learner Bibliography-References: List of references and citations used in the subject and is available for the user-student. FAQ: List of frequently asked questions by users and detailed response. e-tutorial: On-line lectures are given to users, based on a program that is preselected to assist trainers to solve queries of students. Useful links: These are links to information available on the websites, other pages that cover information on issues aiming to the global information. Comments - suggestions: an option that can be done by the students but also by others who visit the website for constant updating and enhancement of the issues. 43
52 To resolve any questions that may arise during the course, students can contact the team of instructors by and / or at specific times via forums and / or social networking applications. Examinations: The course, conventional or electronic, is completed with the evaluation of trainees and the assessing of the delivered material and the whole training program. When the participants are ready for conducting online examinations, through elearning application, they may request initiation. From the moment they will have access to examination questions, the exam will end in 60 minutes. For each module will be given a separate state exam. Upon successful completion of all examinations, a certificate for successfully completion of the seminar will be given to the participants. 4. Discussion The development of technology and the trend of continuing education in all fields make the e- learning (tele-education) the highest form of education. The services and goods are available through the Internet and other forms of data transmission, overshadowing even the major disadvantage of tele- Education, ie the lack of direct personal contact of the trainers with the trainees. The perfect organization, design, development and completion by a full team of associates present the needs and the professionalism needed for running online courses. This professionalism is linked inextricably with the evolution of technology and the offered solutions. In Greece today, with the problems faced, the green-environmental development should be the locomotive that will bring Greece closer to the Europe of the 21st century, socially, politically and economically. Green development can help our country to take advantage of environmental conditions to improve the balance and, simultaneously, create the conditions for reaching people, to help them acquire environmental consciousness and education, so any action they take would benefit not only the economic situation but also the environment itself. For that, the seminars are aimed at individuals associated with the environment and its promotion and protection, and have corresponding degree (foresters, environmentalists, agronomists, veterinarians, ichthyologists, biologists, engineers, environmental engineers, etc.), or/and people who work in public or private companies, and their work relates to environmental management and protection (administrators, economists, sociologists, elected leaders etc.) An effort should be made to design and implement a series of "green" operations, which will aim to transform isolated areas in innovative societies such as 'green' villages, 'green' islands and very soon, why not, green cities in central urban areas. The new web technologies and their applications in e-learning are the tools for broad dissemination of knowledge without spatial and temporal constraints. In this spirit, this system development and integration will be a step in order to apply to schools of our country, to complement and promote environmental awareness. References Allen, R. (1998), The web: interactive and multimedia education, Computer networks and ISDN Systems, 30 (16-18), pp Andreopoulou Z. S., Arabatzis G, Koutroumanidis T., Manos B., 2006, E-learning Model for the Afforestation of Agricultural Land, Proc. of the 18th Conference of the Hellenic Society for Operational Research HELORS 06, with title Planning, Information Retrieval and Knowledge Management, June 2006, Kozani, Vol., Andreopoulou Z New technologies, environmental sustainability and sustainable development. Chapter 15 in the book "Natural Resources, Environment and Development 'ed. G. Arampatzis. Tziola publication, Thessaloniki. pp ISBN (In Greek) Andreopoulou Z, Broadband and e-learninggia local development and lifelong learning in mountainous and disadvantaged areas. Chapter 11 in the book Issues of Forestry and Environmental Management and Natural Resources. 2nd Vol: Development of Mountainous and disadvantaged areas. p ISBN (In Greek) 44
53 Black, G., 2002, A Comparison of Traditional, Online and Hybrid Methods Of Course Delivery, Journal of Business Administration Online, Spring, Vol.1, No 1, Cameron B., 2008, Enterprise systems education: new directions & challenges for the future, Proceedings of the 2008 ACM SIGMIS CPR, pages , ISBN: Croy, M.J. (1998), Distance education, individualization, and the demise of the university, Technology in Society, (20), pp European Commission, 2006, Use of Computers and the Internet in Schools in Europe,. Country Brief: Greece. Available at: Hardaway, D., Will R.P. (1997), Digital multimedia offers key to educational reform, Communications of the ACM, 40(4). Pp. Heiskanen E.., Johnson M., Robinson S., Vadovics E, Saastamoinen M., 2010, Low-carbon communities as a context for individual behavioural change, J Energy Policy, Vol. 38, Issue 12, December 2010, Pages Kirkenidis I.B., Andreopoulou Z.S.,. Kokkinakis A.K., Lefakis P.D., "Developing Educational Multimedia application for the freshwater fish fauna of Greece", Proceedings of the 4th Environmental Conference Macedonia, March 2011, Thessaloniki. Page 238 (Book of Abstracts & CD-Rom Proceedings). Koutroumanidis T, Andreopoulou Z.S, 2007, Perspectives on E-learning Projects for Regional Sustainable Development. In: Proc. of the 5th International Conference Management of Technological Change I.C.M.T.C, Alexandroupolis, Greece, August 2007, Vol. 1, Koutroumanidis T, Andreopoulou Z.S., 2009, E-learning in the internet supporting quality of life and environment within sustainability in the EU, Journal of Environmental Protection and Ecology 10, No 4, (2009) Laudon, K.C., Laudon, J.P. (2000), Management information systems. Organization and technology in the networked enterprise, Prentice-hall, USA, pp Mamoukaris K.B., Economides A.A., "Technology infrastructure courses of tele-education." Proceedings of Panhellenic Conference with International Participation in New Technologies in Education and Distance Learning, University of Crete. Mann, C.J. (1998), Teaching on the web, Computers and Geosciences, 24(7), pp Seyfang G., 2010, Community action for sustainable housing: Building a low-carbon future J Energy Policy, Vol. 38, Issue 12, December 2010, Pages Shobha S., O Fallon L.R., Dearry A., 2003, Creating Healthy Communities, Healthy Homes, Healthy People: Initiating a Research Agenda on the Built Environment and Public Health, Am J Public Health September; 93(9): Spengler J.D., Qingyan C., 2000 INDOOR AIR QUALITY FACTORS IN DESIGNING A HEALTHY BUILDING, Annual Review of Energy and the Environment Vol. 25: (2000) DOI: /annurev.energy Tavner P., 2008, Wind power as a clean-energy contributor, J Energy Policy, Vol. 36, Issue 12, December 2008, Pages Ministry of Environment, Energy and Climate Change, Green Development, 45
54 1. Introduction Process modeling and its importancy for agriculture Josef Myslin 1, Anna Ryvova 2, Vojtech Merunka 3 The agriculture is one of the first activities of mankind. We can say that revelation of agriculture was one of the milestones in evolution of people. Systematic cultivating of soil and production of sufficient amount of food has allowed big large expansion of people and their abilities. People could specialize from these times. But today the agriculture is on the margin of interest of society, but unfairly. There is one fact - although the agriculture today employs only few percent of economical active people, still provides food for everybody of us. But agriculture has changed. It is not only hard work. Agriculture is affiliated with many modern techniques from many disciplines including economy, physics, chemistry and, last, but not least, information management. Farmer needs many information for good decisions - information about weather, about soil and its fertility, about market, about transportation and storing of products. But the condition of information management is to know own processes and the process of describing of processes is related to as process modeling. This article describes several most popular methods of business modeling and its usability in agriculture. 2. Flowcharts Flowchart is a type of diagram used for the graphical representation of the particular steps of the algorithm or the general process. For representation of the respective steps it uses the symbols connected by orientated arrows. The symbols represent the respective steps; arrows stand for the flow of the direction of the process. There are four types of the flowchart: 1. Document flowcharts - showing controls over a document-flow through a system, 2. Data flowcharts- showing controls over a data flows in a system, 3. System flowcharts - showing controls at a physical or resource level, 4. Program flowcharts - showing the controls in a program within a system. The disadvantage of the flowcharts is the arduosity and complexity of the construction, larger flowchart do not fit on one page. 1 Department of Computer Science, College of Information Management and Business Administration, 14/585 Vltavská, Prague 5, Czech Republic 2 Department of Software Engineering in Economy, Faculty of Nuclear Sciences and Physical Engineering, Czech Technical University in Prague, Trojanova 13, Prague 2, Czech Republic 3 Department of Software Engineering in Economy, Faculty of Nuclear Sciences and Physical Engineering, Czech Technical University in Prague, Trojanova 13, Prague 2, Czech Republic 46
 is the graphical language for the visualization, specification, rafting and the documentation of the program")
55 3. UML Figure 1. process for dealing with a non-functioning lamp [5] UML (Unified Modeling Language) is the graphical language for the visualization, specification, rafting and the documentation of the program systems. It offers standard way of writing of the drafts of the systems including conceptual elements like business processes and the system functions, as well as the particular elements like the commands of the programming language, database schemes and reusable components. It supports object-orientated approach to analysis, draft and the description of program systems. In view of the complexity of the modeled systems it is not possible to include all the details, certain amount of the abstraction is unavoidable. The right choice of the amount is the matter of the knowledge and the experience of the analyst. 4. The BORM Method BORM (Business Object Relation Modeling) in the object-oriented method of the third-generation software engineering which is very effective during knowledge systems development. Effectivity is achieved through particular methods for the presentation of all aspects of the relevant model. The method is widely used for modeling of the business processes. Since its onset it has been orientated toward the creation of the object-orientated software systems based on solely object-orientated programming languages and development tools (e.g. Smalltalk - Visual Works, Visual Age...) and towards object databases (Gemstone...). The BORM method has been in practice e.g. in the projects for Prague healthcare, Institute for state information system, electroenergetics, agriculture, telecommunications and the gas industry. In all of these projects it has been revealed that the BORM can be easily used as a tool for carrying out of the process reengineering. The results of that analysis can be very well used for the comprehensive and all-covering specification of the software project task. This method is supported by the various CASE tools - e.g. MetaEdit+ or CRAFT.CASE. The method is based on the gradual transformation of the model, the particular limited and consistent subset is being worked with in each phase of the BORM draft, which enables its easy adoption by the analysts, consultants and the developers. It is joyfully accepted by Smalltalk and the Java programmers as well as the object databases programmers (Gemstone, Artbase). BORM works 47

56 with the hierarchy of the objects. This method can capture the development of all objects participating in the process as well as their status and action they are participating in, in one diagram. The large rectangulars stand for the objects taking part in the process, the small rectangulars stand for the statuses of the objects, the ovals stand for the activity of the objects. The arrows among the activities represent the communication which may be contained within the data flow. 5. BPMN Figure 2. The BORM Method [9] BPMN (Business Process Modeling Notation) is originating from the UML diagram of the activities. This diagrams can be used only to a limited extend and they are not supposed to be used directly for the business process modeling. BPMS is adding the missing notation and symbols to the UML. Their goal is an understandable standardized notation. BPMN defines how to transfer the particular elements and sequences of these elements to the BPEL language which enable manual transfer of the processes model into executable form. BPMN defines the only type of program - Business Process Diagram(BPD) consisting of the net of the graphical objects (the activities and the display of the information flows among them). 48
, specifically IDEF0, offers the modeling language with the predefined syntax and the semantics enabling")
57 6. IDEF Figure 3. Business Process Modeling Notation - Collect votes [3] The IDEF method (Integration DEFinition), specifically IDEF0, offers the modeling language with the predefined syntax and the semantics enabling to create structured graphical representation of a system or an organization. It allows compilation of the consistent model formed by the description of the system functions, their mutual relations and the data allowing to integrate these functions. The IDEF method has been derived from the graphics-orientated SADT language (Structured Analysis and Design Technique) on the basis of the U.S. Air Force requirements. The purpose was to find a means for analysis and the communication among people focused on increase of the manufacturing productivity. The result was creation of the vast array of techniques that have been expanded afterwards. The basis was formed by the following methods: 1. IDEF0 intended for the purposes of the formation of the functional model, which, in a structural way, describes modeled domain areas. 2. IDEF1 intended for the formation of an information model representing the structure and the semantics of the information. 3. IDEF2 describing the dynamics of the system, i.e. its behaviour. The purpose of the IDEF0 is the creation of the model constituted by the hierarchically organized set of diagrams and text with exactly a precisely created system of mutual links describing the functions of an organization or an enterprise. The primary model functions are the functions themselves and the data/objects connecting the functions. Each function has its numeral designation (ID) and the possible designation of the diagram it has used in for insert into its other subfunctions. 49

58 This allows for the creation of the diagram hierarchy corresponding to the decomposition of the functions. While forming the diagrams the rules of the operation in the diagonal direction, the diagram should not have less than 3 or more than 6 functions. The output of the given functions may be the input, the operation or the mechanism of the other functions. 7. EPC Figure 4. IDEF [14] The EPC (Event-driven Process Chain) method complements sequence of the activities, the time and space continuity and the assignment of the roles to the IDEF method. It has become a part of the systems like SAP R/3 (ERP/WFM) and ARIS (BPR). From the general view of process execution the event defines an input condition. The termination of an activity defines another event - an output condition which can be followed by other activities. Each activity is therefore defined by two events and thus its start and end are clearly defined. The EPC diagrams contain three basic elements: 1. Activities - the particular activities that are carried out within the process. 2. The events - input and output conditions of the activities. 3. Directing connections - branching of the process flow. Figure 5. Elements of an Event-driven Process Chain [4] 50
59 8. Evaluation Each of the above mentioned methods for modeling/simulation of the business processes can be used under specific conditions. None of them can be successfully used on its own, usually we have to chose a combination of the which requires corresponding knowledge of business analyst. In the following chart the recommended usage of particular methods is listed: Method Usage Disadvantages Flowcharts direction of documents flow, of the data, physical layer or sources or flows within the fram of the system UML diagrams BORM BPMN UML EPC structural diagrams, diagrams of behaviour, diagrams of interaction analysis in the initial phases of the project development, carrying out of the business process reengineering generally usable methodics for the description of sequences of the activities and other aspects of the process, usable for the extensive projects as well owing to decomposition it can be used for large projects, useful rather for functional preview generally usable method for description of the activities sequences and other aspects of the program, also for extensive projects cumbersomeness, complexity, they often do not fit one page = confused the complexity of the modeled systems is not allowing for a comprehensive capture of all of the details - necessity of a compromise, Choice of an appropriate abstraction level, missing station for modeling e.g. subprocesses hierarchy, connections among the processes, transaction processing, exceptions comprehensive, most used software CRAFT.CASE is commercial, it is worked with in a way that is different from the majority of the CASE tools. informality - impossibility of algorithmic verification of modeled processes IDEF0 describes functions only without sorting of particular activities in time, comprehensive picture can be obtained through IDEF1, IDEF2, IDEF3... techniques which is demanding from the aspect of manageability and it is also confused the language is not formally defined, ambiguosity in processes specification might occur, attainment of the required final status of the process may not be secured 9. Conclusion There is an important fact. The model as such is not the primary goal as well as software, computers, information systems. All this are only tools for better managing tasks. The goal of agriculture is to produce food for people and farmer should not be irritated by anything like this. Processes should be used by the way which makes whole situation and problem solution easier. So we have to say that we never do business modeling with the goal like that we want process model or that it is modern. It is the worst access we can select. We do business modeling, because we would like to improve our abilities for problem solution. Process model allows us to understand the process and possible problems during its running in the better way. And with the process model we can discover phases with possible problems and reengineer the process by the way excluding these problems. So do not change process if we are not sure that we 51
60 have a problem and we know the better solution. Change for improvement, not change for change, it should be our motto. Methods described above are a toolbox. We have acquaint us with them and we should learn when a how to use them in praxis. In most cases the optimal is the mix of methods. Different methods for different situations is the best practice. References 1. Ambler, S.: The Object Primer 3rd Edition, Agile Model Driven Development with UML 2, Cambridge University Press, 2004, ISBN: Ambler, S.: UML 2 Activity Diagramming Guidelines, Agile Modeling, 2009, 3. Business Process Model and Notation, Wikipedia, The Free Encyklopedia, Process Model and Notation. 4. Event-driven Process Chain, Wikipedia, The Free Encyklopedia, process chain. 5. Flowchart. Wikipedia, The Free Encyklopedia, 6. Merunka V., Objektove modelovani (In English: Object Modeling), Alfa nakladatelstvi s.r.o, Praha 2008, ISBN Merunka, V., Polak, J.: BORM - Business Object Relation Modeling - Popis metody se zamerenim na uvodni faze analyzy I.S.,conference TVORBA SOFTWARU '99, Ostrava , 8. Merunka, V., Polak J., Rivas, I.: BORM - Business Object Relation Modeling, in Proceedings of WOON. In Fifth International Conference on Object-Oriented Programming, St. Petersburg, 2001, raw/usn/woon2001.pdf. 9. Merunka V., Unal B., Myslin J., Formal techniques of data structure design in modern database systems. IFAFFE'10 Proceedings. Samsun, Turecko 2010, ISBN Molhanec M., Kratka uvaha o normalizaci (In English: Short idea about normalization),. Sbornik konference Objekty Hradec Kralove ISBN Myslin, J.: Requirements engineering, Doktorandske dny 2011, Praha. 12. Ryvova, A.: Datove modelovani (In English: Data modeling),, Doktorandske dny 2011, Praha. 13. Unifed Modeling Language. Wikipedie, Otevrena encyklopedie, Vondrak, I.: Metody byznys modelovani pro kombinovane a distancni stadium (In English: Methods of business modeling),, VSB - Technical Univerzity of Ostrava, 2004, byznys modelovani.pdf. 15. Wiegers, K. E.: Pozadavky na software (In English: Software requirements),. Computer Press, Praha 2008, ISBN:
61 Preliminary Studies Regarding the Infrared Images Uses in the Drying Process of Agricultural Products Liviu Gaceu 1 Abstract. The drying operation is extensively used in all areas of agri-food industry. This operation can influence the quality of the final product since an improper drying process can lead to an uneven distribution of the humidity in the product mass or to over burned produce. Noninvasive technique to determine the drying process quality can be achieved by using an infrared camera and interpretation of the images using LabView software. This paper describes a method for data analysis of the infrared images captured during the drying process of vegetables. The output data can be used for a better management of the drying process. Keywords: agricultural products drying, infrared image. 1. Introduction For the long-term conservation process of agricultural products, humidity is an important qualitative feature, with a decisive role in the frame of post harvesting process. The research carried out over a long period of time allowed for the accurate establishing of the maximum humidity content required for long or short-term storage. Industrial practice has called foe the artificial drying of products that is removing a certain quantity of humidity by employing a temperature fields of surrounding medium, inside special equipment. One of the most important specific parameters is the temperature reached by the products, within of the drying process. It is known from the theory of drying that the rate of evaporation (the amount of moisture evaporated per unit time from unit surface of a body) is the first period constant and then in the second period changes with time according to an exponential law. In figure 1 the curves represented has the following significance: 1-medium temperature; 2-product temperature; 3-product humidity; 4-rate of evaporation; 5-higrometric-equilibrium level. Figure 1. The variation of the parameters of the grain drying process 1 Transilvania University of Brasov, gaceul@unitbv.ro 53
62 2. Problem formulation One of the most usual methods is the drying using special equipment for monitoring and controlled by PLC devices. Since many of the new biochemical elements are affected by high level temperatures, it is very important to analyze the temperature distribution inside the heat chamber and on the products surface. The literature presents numerous recommendations regarding the temperature value of the drying agent, according to: Type of product and its destination; The transfer mode of heat to the drying material; The product humidity before the drying process; The current phase in which is found the drying process; Relative humidity of the drying agent, etc. Modifying of the temperature value of the drying agent, by using as a reference indicator one or more of the specified items, is a simple solution, efficient in the most cases. For some materials that are very sensitive to the exceeded temperature from the surface of the product, we propose an original solution in which this size becomes a reference for controlling the entire drying process. The diagram for the control of drying process using of infrared images is shown in Figure 2. The agricultural products are positioned on the perforated surface and dried with heated air. The air temperature is about 55 degree and can be modified based on the germs temperature. The exact measuring temperature value can be done with the InfraCAM FLIRi50 type of camera. The infrared images (bmp files) are converted into numerical matrices, as input data for the pilot process Figure 2. Conceptual diagram for the control of drying process using of infrared images 1- support surface; 2- agricultural products; 3- fun; 4- heater; 5- computer; 6- image acquisition system The processed information allows: Continuous monitoring of the product s temperature and avoid to exceed the required value; 54


63 Exact determination of the current phase of the drying process in which the product is found, and the proper adjustment of the parameters of drying agent; Water evaporation rate control from the product, based on the difference between the product surface temperature and the drying agent temperature; Using software for continuous acquisition for infrared images at a range between s, the system generates a class of constant-resolution bitmap images. Each pixel from the images has chromatic information, proportional to the product surface temperature, in a specific spot. If the bitmap images are turned into numerical matrices able to be processed with specialized software, the processed information represents a good reference for controlling the drying process parameters. Currently there are numerous software solutions that allow this kind of digital processing, in continuous or static flow, for fundamental research, in which we recall LabVIEW, MathCAD, MathLAB, etc. 3. Experimental results In the following, for the studying of the drying process it was used a commercial available drying oven. The drying oven allows the control of temperature in the range of degrees. The products analysed was onion, sliced in circular shape with the thickness of 2.4 mm. The drying process was focused for obtaining o high quality products, so the drying temperature was fixed to the 55 C value. The process takes 350 minutes in order to decrease the material humidity for long term storage. The weight of the onion slice varies between: 46.7 g at the beginning process to 5,7 g at the and of the drying process. Figure 3 Different thermal images from different stages of drying process The analysis of the surface products temperature was done using an infrared thermal scan camera type FLIR i50. with the following technical characteristics: - Thermal sensitivity/netd <0.10 ºC (< ºC (+77 ºF) / 100 mk; - Image frequency 9 Hz; - Focus Manual; - IR resolution pixels; - Display Built-in 3.5 in. LCD, 256k colors, pixels; 55
64 - Object temperature range 20 to +120 ºC ( 4 to +248 F); 0 to +350 ºC (+32 to +662 F); - Accuracy ±2 C (±3.6 F) or ±2% of reading. Infrared camera was connected with a laptop and the images were converted into numerical matrix using LabView software (fig. 3). The images have 240 x 320 pixels, each of them showing the temperature of one point of the surface o material. The main cursor placed in the center of each picture indicates the temperature in de center of the slice of material. It can be observed that the temperature increase with the flow of the process and the decreasing of the material humidity. Outside of the slice of material it can be observed the temperature of the air inside the dryer. This temperature remains almost constant, varying between the medium values of 55 degrees C. The air temperature was measured independently using Nova Fourier system, figure 4. At the beginning of the drying process the product temperature was 32.6 C and increase up to the value of the air (see curve nr. 2 from figure 1.) This indicates also the end of the drying process. Also it can be observed that the onion slice suffer a phenomenon of splitting in circular layers. This makes difficult the measuring of the product temperature, especially if it can use an infrared pyrometer. Since this device measures the temperature jus in one point, and sometimes this point can became out of the product surface, the temperature information is useless. This emphasized an advantage of infra-images which measure temperature in 240 x 240=57600 points. For monitoring the drying process and visualizing in real time the temperature pattern, it was use the VLC player. This allow the viewing of the current infrared images, and captured automatically one picture/10 min. The pictures were saved into a dedicated local folder. In this way, VLC player consist also into a interface between FLIR camera and Labview software, used as the following. The infrared pictures was converted into a matrix of values by applying different tools available in LabView. The component values are stored as integer numbers in the range 0 to 255, the range that a single 8-bit byte can offer (by encoding 256 distinct values). These may be represented as either decimal or hexadecimal numbers. Furthermore, the numerical matrix can be analised and it is possible to show in real time some important values, like: - the mean temperature of the product surface; - the coefficient of non uniformity temperature; - the minimum/maximum temperature value on the surface of material; - an overheating blinker that will be use for controlling of the dryer heater. For having an overview of the entire drying process and for making some correlations regarding the drying process were measured 4 other thermal parameters such: the air temperature inside and outside of the drying oven; the air humidity inside and outside of the drying oven. 56
65 60 Temperature, C, Humidity, % Time, min Temperature inside dryer, degree C Humidity inside dryer, % Temperature ouside dryer, degree C Humidity outside dryer, % Figure 4. The main parameters measured with Nova Fourier system during the drying process This was done by using a Nova Fourier system (figure 4), which allow to connect a series of dedicated sensors. 4. Conclusions and further research directions The experimental researches showed the following conclusions: - the using of infrared capture images consist a proper noninvasive technique for monitoring the surface temperature of the dried agricultural products; - the mean temperature using infrared technique can be used for the management of the drying process; - the infrared measuring technique shows the non-uniformity of the surface temperature, an important parameter for avoiding supplemental thermal stress of the products slices. For the future, the research will focused on: - modifying the LabView application using an output card in order to control the heater of the dryer; - investigation related to the similarities between the pattern of temperature distribution an the shape changes in the process of different product slices. References Gaceu, L. Studies Regarding the Design of Grain Dryers with Renewable Energy Sources, Bulletin of the Transilvania University of Brasov, Vol. 2 (51), 2009, pp Liviu GACEU, Badea Lepadatescu, Aspects into use of Renewable Energy Sources in Cereals Drying Process, in Proceeding of Recent Advances in Signal processing, Robotics and Automation Conference, Cambridge, UK, February , WSEAS Press, p , ISBN , ISSN Gaceu, L., Labview Didactical model for simulation of drying process of powder materials, International Conference on New Reseacrh in Food and Tourism, BIOATLAS Conference 4-7 June 2008, Brasov, Romania, ISSN X. Gaceu Liviu, Gruia Romulus, Research Regarding the Optimisation, of the drying process using a predictive controller, Proceedings of 31th ARA Congress, Brasov, Romania, 31 iulie-5 august 2007, ISBN , pg
66 Gaceu L., LabView predictive model for optimization of the cereals drying process, in the Proceedings of International Conference on Agricultural Economics, Rural development and Informatics, AVA3, Debrecen, Hungary, ISBN , pp , martie Gaceu Liviu, Contributii la studiul vitezei de circulatie a aerului in uscatoarele de cereale, utilizand metoda elementelor. Revista de EcoAgroTurism, vol.3, nr2, 2007, pag ISSN: X. Gaceu, L., Cercetari privind obtinerea de produse bio-active in procesul de uscare a semintelor de cereale si plate tehnice, Revista de EcoAgroturism, nr.1, Editura Universitatii Transilvania din Brasov, ISSN X, p.38-44, Gaceu, L., Aspecte privind utilizarea promotorilor de turbulenta in procesul de aerare activa a cerealelor, Revista de EcoAgroturism, Editura Universitatii Transilvania din Brasov, nr.1, 2006, pg , ISSN X. Gaceu Liviu, Solutii constructive moderne in tehnica uscarii semintelor de cereale si plante tehnice, in: Noutati privind modalitatile de organizare si tehnologiile de productie si mecanizare in zona de campie, Ed. Universitatii Transilvania Brasov (editura recunoscuta CNCSIS) ISBN Vol.3-ISBN : pp.39-44,
67 Innovative information technologies and the rural innovation chain - the rise of a networking phenomenon? Mihály Csótó 1 Abstract. Information has a central role in our modern way of living and agriculture is no exception: to be successful in farming requires gaining, processing, using and evaluating a huge amount of information (policy, markets, new methods etc.). Farmers are working in an information-intensive environment and numerous studies have showed that information and communication technologies (ICT) can play a vital role in realizing benefits with more effective information management in the farm level and in fostering new innovations. Farmers are part of innovation networks where people exchange information, discuss experiences of adoption and find solutions for a their problems in specific environment. That is why it is important to research the various aspects of adoption of a new information technology. Keywords: Information and communication technologies, innovation, adoption, networking, agriculture Összefoglaló. Az információ gazdák egy olyan információ-gazdag környezetben kell, hogy érvényesüljenek, amelyben az információs és kommunikációs technológiák (IKT) használata számos kutatás szerint elengedhetetlen a sikerhez. Mindezek mellett az információs technológiák egyéb innovációk terjedését is ösztönözhetik. A gazdák önmaguk is hálózatok tagjai, amelyekben információ- és tapasztalatcsere k megoldásával szerint értékeljük. Kulcsszavak: Információs és kommunikációs technológiák, innováció, adoptáció, hálózatosodás, 1. Introduction The supply chain in agriculture not only means the flow of products and income but also that of information (Niderhauser et al., 2008). The toolkit of the information society, information communication technologies (ICT) offers new opportunities for efficient operation, decision-making and adaptation to the environment (Herdon, 2009). ICT are also regarded as mediating channels and vehicle for new services. This, however, can only work successfully if certain conditions are met. The potential opportunities can only be exploited to an optimum under the right circumstances, and it is also important that they are harmonised with the previously used farm management practice, or else the much-awaited success will suffer. ICT take-up in agriculture remains low, and the reasons behind this barely changed in the last years. 2. Reasons and models Modelling the agricultural decision-making process and information flow is nothing new. The primary objective of studies aimed at creating models is to determine why a given group of farmers behave the way they do (Gladwin, 1989). Models used in the area of agricultural informatics confirm that in a text book type farm the farm manager approaches his information needs, the cost of the information and alternative sources at system level and in a systematic way, and is able to recognise information necessary for decision making. Furthermore, he consciously applies and builds the latest information technologies into his everyday work. Information literacy is the skill to access information and uses it for value creation, and an individual can be regarded as information literate if he recognises when he needs information. Information literacy is possessed by those who have learnt how to learn. It can be seen that information literacy requires and demands several skills from the conscious citizens of the digital world. Never before in human history have these skills been expected of everyone; such 1, Információs Társadalom- és Trendkutató Központ csoto.mihaly@ittk.hu 59
68 expectations typically concerned the members of the intellectual elite (Rab, 2008). However, since the world of today is determined by the presence, lack, value and authenticity of information and the speed of its flow, these skills have become important for everybody, including those working in agriculture. As a rule of thumb, based on Nuthall (2004) it can be stated that with great probability farmers will keep seeking and collecting information until they actually feel that the cost incurred by continuing the search will exceed the benefits that can be secured by the information attained. However, this marginal utility approach is made more complex if we consider the knowledge base and experience of a farmer at any given time (e.g. if we apply this logic young farmers might need more information). At the same time it must be remembered that since it is difficult to attach economic value to information, the search process will mostly depend on the perception of the farmers, which means that the proportion of intuitive decisions is likely to increase significantly with experience (at least under the given circumstances). Harkin s research (s.a.) shows that the diffusion of ICT opens up the following opportunities: timelier, more comprehensive information accessing a new type of information several competing information sources single window access easy exchange and discussion of information ideas easier cooperation and access to other farmers and experts As Hill (2009) states: As individuals, farmers have their favoured information sources, which they use depending on the specific information being sought. The amount of information collected depends on the complexity of the task and the importance of the decision. The context, the channel, the type of information, the access to information and the farmer s experience and personal preferences are in close relation Diffusion of innovation: the factors Farmers have not yet been encouraged as obviously and successfully, to change their approach to information management as it could have been expected based on the technical potentials (Alvarez and Nuthall, 2006). Nuthall also points out that, since the farmer is an essential component in the information system of a farm, the decision to use ICT often depends on the personal characteristics of the farmer, such as his or her personality, experience, age, education, goals and objectives. The main factors cited in many of the literature on the problems of adoption of ICT among farmers include only attributes of smallholders. Mainly based on Apps and Iddings (Apps & Iddings, 1990) as well as Taragola and Van Lierde (Taragola and Van Lierde, 2010), a detailed picture can be drawn about these factors: Farmer s characteristics (age, experience, personality, education) Farm characteristics (size, type, geography) Goals and objectives (attitude towards learning) Decision making and information management style (time, information sources (number, intensity in use), extension usage, support from the outside) Trust Community culture Information flow, or the lack of it, as well as its intensity and knowing about the circumstances of a given farm and its manager might provide a comprehensive picture about the decision-making process and thus the character of a farm. Recently we find models which contains the well-known factors and 60

69 also communication as a variable (Figure 1.). Therefore, information flow must be studied in its complexity, at different levels and in detail. If we are doing so we find ourselves in a new territory: network-research. Figure 1. Frequently used adoption predictors (Hartwich and Scheidegger, 2010) 2.2. The surprising power of social networks of farmers? In the last decade or so, many authors (e.g. Barabási or Christakis and Fowler) published famous bestsellers about social networks and how they are shaping the everydaylife of people. However, this is not a new phenomenon in the literature of diffusion of innovation. One of the best description comes from Valente (1995): "The diffusion of innovation occurs among individuals in a social system, and the pattern of communication among these individuals is a social network. The network of communication determines how quickly innovations diffuse and the timing for each individual's adoption." In other words: a chain of innovation is a social network, defined by offering or adopting an economic innovation (Letenyei, 2001). The idea of networking in agriculture innovation suggests that the farmers position in social networks determines their access to resources needed to implement the innovation as they are part of networks where people exchange information, discuss experiences of adoption and find solutions for a better adaptation in specific contexts (Hartwich and Scheidegger, 2010). The characteristics of the diffusion are determine by a number of factors: Granovetter (1983) argued that weak ties (people loosely connected to others in the network) were necessary for diffusion to occur across subgroups within a system. Burt (1987) argues that structural equivalence (the degree of equality in network position) influence the adoption of innovations. 61
70 Other personal and social network characteristics which might influence the diffusion of innovations include centrality, density and reciprocity (Valente, 1995) The network-concept raise a very interesting question: if we accept that innovation and adoption is a communication process how can we evaluate the spread of information and communication technologies? 2.3. The double edged sword: a object or an enabler of adoption? As observed previously, mobile phones and the Internet are not simple tools: they can form a primary source, a secondary intermediary of printed or other electronic media and a means of personal communication. Just to make things more complex, they can be combined (speaking on a mobile phone with the extension service employee who is using an online tool to help the farmer). The personal and some of the electric channels (unlike TV and radio) can be used for two way interaction, and by so doing the (electronic) services (banking, claiming for farm subsidies and so on) can also be involved in the model. Personal/oral information is as two-faceted as electronic: a person (family member, other farmer, extension service employee etc.) can be the source of information or the intermediary as well. An intermediary can also modify the information (or can put it into context thus helping it become knowledge). It is clear that on the one hand ICT itself is an object of adoption: new and innovative tools to make something better and more efficiently. On the other hand the things is that that something is communication which is in the forefront of any diffusion process as it can be an enabler also. The real question is how the farmers social network and personal communication changes with the use of ICT. 3. Conclusion Earlier studies, the aims of which were to discover the factors related to ICT-use among farmers, mainly concentrated on the use of the tool itself. If the problem is considered from a different perspective the best way to describe it is within the framework of communication and networking. Some really demanding problems of the Hungarian agriculture resulted by network dysfunction. It must be stated that a model based on this approach cannot be comprehensive. Even without a sound information background it is possible to reconstruct meanings identical to those produced with the help of such a background. It is also proven that the same information can be collected in various ways (from whole different pieces ) (Z. Karvalics, 2003). And it must not be forgotten that the context, the channel, the type of information, the access to information and the farmer s experience and personal preferences are closely linked. Understanding the take up of innovative information technologies and their role in farm management needs some new methods, because the known factors do not fully describe the real situation. Studying the dynamics of networking contributes to a better understanding how and when smallholder farmers make decisions to adopt innovations. One of the best way to do so is to study the (not) use of and their attitude towards ICT. References Alvarez, J., Nuthall, P Adoption of computer-based information systems: The case of dairy farmers in Canterbury, NZ, and Florida, Uruguay. Computers and Electronics in Agriculture 50(1) Apps, J., Iddings, R What influences farmers computer use? J. Ext. 28 (1) Burt, R. S Social contagion and innovation: cohesion versus structural equivalence. American Joumal of Sociology 42 pp Gladwin C.H. (editor) Ethnographic Decision Tree Modeling, Sage Publications Granovetter, M The strength ot weak ties. American Jornal of Sociology 78 pp Gurstein, M Effective use: A community informatics strategy beyond the Digital Divide In: First Monday, Volume 8, Number 12-1 December 2003 Available at: 62
71 Harkin, M (sine anno): ICT Adoption as an Agricultural Information Dissemination Tool An historical perspective Downloaded: 10th September Hartwich, F., Scheidegger, U Fostering innovation networks: the missing piece in rural development? Rural Development News 1/2010. Agridea Available at: Herdon, M Impacts of e-collaboration tools for development of rural areas. In: AVA Congress 4: International Congress on the Aspects and Visions of Applied Economics and Informatics. Nábrádi A., Lazány J., Fenyves V. ed. Debrecen, Magyarország, Debrecen: Agroinform Kiadó, (ISBN: ) Hill, M Using farmer s information seeking behaviour to inform the design of extension, Extension Farming Systems Journal 5/2 (2009) Letenyei, L Rural Innovation Chains. Two examples for the diffusion of rural innovations Review of Sociology Vol. 7 (2001) 1, pp Niederhauser, N., Oberthu T., Kattnig S., Cockj Information and its management for differentiation of agricultural products: The example of specialty coffee In: Computers and electronics in agriculture 6 1 (2008) Nuthall, P.L Case studies of the interactions between farm profitability and the use of a farm computer In: Computers and Electronics in Agriculture 42 (2004) Rab, Á Digital culture Digitalised culture and culture created on a digital platform In: Information Society From Theory to Political Practice. Coursebook, Pintér R. ed. Gondolat Új Mandátum, Budapest Taragola N.M., Van Lierde D.F Factors affecting the Internet behaviour of horticultural growers in Flanders, Belgium Computers and Electronics in Agriculture 70 (2010) Valente, Th. W Network Models of the Diffusion of Innovations New Jersey: Hampton Press Z. Karvalics, L Információ, társadalom, történet (Information, society, history) Typotex, 2003, Budapest (ISBN ) 63
72 Development of Sustainable Agrifood Interoperability What can we Learn from Natural Processes? Mónika Varga 1, Béla Csukás 2 Abstract. There are two essential requirements in the development of agrifood process systems: interoperability and sustainability. To keep the balance in the space of finite resources and reservoirs, we have to pay attention to build agrifood processes in a more sustainable way in the future.moreover, we have to assure the interoperability of different actors along the whole chain. The applied unified process modeling methodology made possible the computational model based comparison of natural and human-built process architectures. From the similarities and differences, derived from the common model architectures, we can learn the effective design and control principles of artificial processes. The comparison will be explained through the example of the recently developed agrifood process network modeling methodology. In our approach, transparency of investigated networks is based on unified, scalable, multiscale model of the simplified dynamic mass balances. The same methodology was used for the analysis of an interesting part of cellular signaling pathways. Having compared the models of biosystem and agrifood processes, we can state that one of the keynote elements of future sustainability is to prefer the neighborhood cooperation for the utilization of the local resources, as it is usual in natural processes. Keywords:agrifood process systems, sustainability, interoperability, natural and human-built processes, computer modeling. 1. Introduction Key requirement in the finite space of resources and reservoirs is to achieve sustainability with the more conscious development of human-built (e.g. agrifood) process systems. However, we have to clarify, what does the concept of sustainability cover from engineering point of views. The term of sustainable development has used first in the report of World Commission on Environment and Development of United Nations (Brundtland, 1987). They defined it as those paths of social, economic and political progress that meet the needs of the present without compromising the ability of future generations to meet their own needs. Nowadays, not only the principles, but developed IT toolssupport the sustainable development, through the reveal of sustainability-specific characteristics and with the implementation of these special features in the design of artificial processes. Broad range of articles, deal with the theme of sustainability from different points of views, using various mathematical and IT methods.in a recent paper, Martinet investigates the question of sustainability from an economical aspect (Martinet, 2011). Having considered a closed economy, the author introduces a criterion method that consists of indicators and their thresholds as constrains, and solve it as a max-min problem. He highlights, that real world is more complex than a simplified test, and the problem is basically time dependent, that s why sustainability thresholds may be revised time to time. In a state-of-art paper (García-Serna et al., 2007), authors give a comprehensive review about green engineering and about new trends to achieve sustainable development, with special consideration of chemical engineering problems.li and his colleagues present an inexact stochastic quadratic programming with recourse (ISQP-R) method for resource management, with consideration of system dynamics and uncertainties (Li et al., 2011). They introduce the method through a water resource management and environment sustainability case study.another actual case-study is presented by devoil and colleagues (2006). Authors investigate the sustainability trade-offs in cropping system. Based on the model of the agricultural and ecological system, they try to explore the sustainability specific issues of the investigated cropping system with the help of evolutionary algorithms. In a 2009 paper Fiscus introduces a comparative network analysis for the nitrogen network of the US beef supply chain (Fiscus, 2009). He compares this artificial process with natural reference systems, which are the carbon and nitrogen trophic networks in the 1 Kaposvári Egyetem, Gazdaságtudományi Kar Varga.Monika@ke.hu 2 Kaposvári Egyetem, Gazdaságtudományi Kar csukas.bela ke.hu 64
73 nature. He concludes that the applied ecological network analysis (ENA) method can be expedient in the analysis of human food networks, because it helps to understand the causes of problems, as well as to find the adequate sustainable solution. Although, the applied method is based on the comparison of similarities and differences of natural and artificial processes, the applied ENA tool is atemporal (without any consideration of dynamic changes). According to our understanding, most important task of IT methods and tools in supporting sustainability and interoperability is not only to solve specific tasks, but also to give diagnosis and therapy for general problems. Our general approach has to be based on a dynamic modeling methodology and simulation tool that supports the solution of multiscale hybrid problems. 2. Methods and tools We have investigated several process systems, both natural and human-built ones, with the application of Direct Computer Mapping (DCM) methodology. Basic principle of DCM is let computer know explicitly about the structures and elements of the real world problem to be modeled (Csukás, 1998). Accordingly, as it is shown in Figure 1, the natural building blocks of the elementary processes are described by unified state (ellipse in Fig.1) and action elements (rectangle in Fig.1). Figure 1.Unified building elements of the process modeling method State elements characterize the actual state of the process elements, while actions describe the transportations, transformations and rules about the time-driven or event-driven changes of the actual state. States and actions are connected by four kinds of edges. Increasing (solid line in Fig.1) and decreasing (dashed line in Fig.1) connections transport additive measure from action to state elements. Signaling connections (dotted lines in Fig.1) carry sign from state to action elements, and backward. Both state and transition elements contain lists of parameter (Sp or Ap), input (Si or Ai) and output (So or Ao) slots (signed with circles and triangles in Fig.1).These slots are prepared for the storage, as well as for the receiving and sending of the various extensive and intensive characteristics. The discrete or continuous, as well as quantitative or qualitative functioning are described by brief local (e.g. declarative Prolog) program codes, associated with state and action elements. They are executed by a general kernel, built in partly open software tools. The above method has been applied for the computational model based problem solving of various practical problems in the past years. 65
74 3. Results and discussion The experiences obtained from the field of natural and human-built processes led to the recognition that natural processes are inherently more sustainable, therefore we have to learn and utilize these special features in the design and operation of human built (e.g. agrifood) processes. We demonstrate the characteristic points through the comparison of a natural (p53 related cellular signaling) and an artificial agrifood(slaughterhouse) process. Biosystem process network: p53 signaling Oncogene effects Oncogene activation DNA damage Kim et al, 2010 Nitric oxide Kim et al, 2009 pl4arf Hypoxia MDM-X ATR ATM MDM2 +p +p Various +p CHK1 +p +p target DNA p53 CHK2 genes Detailed union of the two core models Zooming into the details: a simple reaction p53 MDMX p53mdmx Association Figure 2. Executable structures of the investigated part of p53 process The example for a natural process is the signaling network of p53 protein (Fig. 2). In the framework of an international cooperation with biological and biomedical experts, last year we started the computational model based understanding and investigation of the p53 signaling pathways. p53 gene is usually called as the guardian of the genome. According to the current literature, it could play an essential role in the treatment of human cancer, that s why the better and detailed understanding of p53 related processes is very important. In a normal case, p53 gene is inactive in the cells. However, in case of an oncogene effect or DNA damage, it starts to initiate the production of the same named p53 protein. Main goal of this protein is to save the cell from proliferation. First, it slows down the cell processes and tries to repair the DNA. It also detects that harmful processes are irreversible, and at this point it starts the apoptosis.in Fig. 2 we can see the structure of p53 related 66
75 processes. This executable structure is composed from two related literature sources (Kim et al., 2009; Kim et al., 2010), by the union of the two marked parts (Fig. 2 top), in detail. Agrifood process network: interoperability of different actors Actor 1: Plant cultivation Actor 2: Plant cultivation Actor 3: Plant cultivation Actor 4: Animal breeding Actor 5: Animal breeding Actor 6: Meat trade Actor 7: Slaughterhouse Actor 8: Food trade Detailed model of a single actor: slaughterhouse Zooming into the details: refrigeration of carcase Carcase Refrigerated carcase Refrigeration Figure 3. Executable structures of the investigated slaughterhouse processes Human-built example describes the processes of a slaughterhouse actor from the agrifood process network (Fig. 3). We have built the computational model with the DCM method from the same unified elements (states, actions, connections, according to Fig.1), as in the investigation of p53 pathways. The processes cover the slaughtering from the arrival of slaughter animals, through the slaughtering, refrigeration, chopping, and packaging; until the selling of the packages. The model is based on simplified stoichiometries, with respect to the characteristics of the investigated slaughterhouse (type of slaughter animal, obligatory waiting times, prescribed standards, etc.). Having analyzed the natural and human-built examples, we can discover obvious similarities between them.in the first place we can mention the multiscale character. Different spatial and temporal scales coexist besides each other, both in natural and human-built processes. Good example for the different spatial scales is that the same components can be found in various cellular organs within the cell. Temporal multiscale characteristic means, that the p53 related signaling takes only seconds, but the proliferation process might take days. Similarly in the interoperability model, plant cultivation 67
76 processes are taken into consideration daily, but the time scale for the slaughterhouse is one hour, at least. The applied DCM method is able to manage these multiscale characteristics with its embedded features. Another similarity is that in a system level, both in natural and in human-built processes, networks of balance and influence routes can be interpreted over the dynamic net model. Balance routes can be defined as the alternating series of increasing (solid edges in Fig. 4) and decreasing (dashed edges in Fig. 4) connections. Influence routes means the alternating series of reading (dotted edges in Fig. 5) and modifying (solid/dashed edges in Fig. 5) connections. It is to be noted that in the sense of the applied modeling methodology (and in accordance with Fig. 1), decreasing connections start from action elements in case of influence routes. Figure 4. Balance routes 68
77 Figure 5. Influence routes Finally, the most important similarity that very different processes can be built from the same unified elements with the same principles (see Fig.1). As it shown in the middle and lower parts of Fig. 2 and Fig. 3, the p53 signaling processes and the slaughterhouse processes can be described with the same unified elements, as well as the structure can be executed by the same general kernel of the DCM simulator. In spite of the evident similarities, the differences between natural and human-built processes are more interesting from the investigated viewpoints (sustainability and interoperability). The most important differences are summarized in Table Regarding model specific conservation laws, both processes are built from stoichiometric balances. However, a significant difference is that natural processes are inherently self-determined, while in case of human-built ones, they require human decisions. For example, a cell process can work without any outside effect, while in a slaughterhouse operation we have to give the initiating signs from outside, by means of the respective human decision (highlighted with red dotted lines in Fig. 3). As a consequence of self-determinedness, natural processes prefer local solutions, oppositely from the more and more global human-built processes. In a cellular process a component reacts with the closest reaction partner, as well as all of the metabolic, signaling and DNA-related synthetic processes run in each cell, locally. However, in the human-operated food networks we carry the food from one side of the world to the other, senselessly. 69
78 Table 1.Differences of natural and human-built processes CHARACTERISTICS NATURAL PROCESSES HUMAN-BUILT PROCESSES 1. Model specific conservation laws stoichiometric balance processes Balance processes self-determined human decided Organization scheme local solutions global solutions 2. Primary (controlling) Information) Feedback on the vehicle process Basic architecture 3. Secondary (evaluating) Information always exist carried by conservational vehicle processes mutual feedback between neighbors none usually does not exist (far reaching effects) hierarchically determined from outside objective(s) Evolution principle natural selection optimization Process architecture competitive/cooperative usually hierarchical 2. A common feature is that the primary (controlling) information is carried by conservational vehicle processes, both in natural and artificial processes. However, the direct feedback on the vehicle process exists only in the natural processes. In the lack of feedback, artificial processes are often characterized by (sometimes useful, but sometimes harmful) far reaching effects. The following example demonstrates the significance of the feedback on the vehicle process. In a marginal case, if the reparation of DNA is impossible, p53 signaling pathway initiates the cell death, having killed itself and its processes with this action. In contrary, in the world of artificial processes, some false, chaotic information might cause disturbances in a far point of the world, while in the most cases, it won t cause any moderating feedback on the initiating persons. As a consequence of the above described properties of the primary informational processes, the basic architecture of natural processes can be characterized by the mutual feedback between the functionally connected neighbors (see an example, highlighted with red lines in Fig. 6). However, the basic architecture of the artificial processes is determined by the hierarchically organized human decisions. 3. The secondary (evaluating) information appears only in the human-built processes, in form of objectives. Arising from it, evolution principles of the artificial processes are the various forms of optimization, organized usually in hierarchical architectures. In natural processes the evolution principle is the natural selection, realized in competitive/cooperative process architectures. Nevertheless, the consciously designed cooperation of the functionally connected neighbors can be applied in the human-built process architectures, too. Cooperation means much more than mutual goodwill. Engineering designed and controlled cooperation means that the functionally connected neighbors tend to evolve mutually suboptimal operation. 70
79 4. Conclusions Figure 6. A feedback loop at the p53 signaling network Derived from the model based analysis of various natural and human-built process systems in the past years, we can state, that we have to utilize the specific inherent features of natural processes in the development of artificial process systems, consciously. The most important assessments can be summarized as follows. First of all, we have to develop the artificial process systems in a bottom-up way. To keep the balance in the finite space of resources and reservoirs, we have to make the processes self-determined, as much as possible.accordingly, we have to prefer the local (neighborhood) solution for supply and recycling.the most important thing is the conscious design of cooperative control and evaluation feedback between the functionally connected neighbors of the artificial processes.another important question is the moderation of far reaching effects of informational processes. In the era of informational society, we have to inhibit the harmful effects of the chaotic information flow that is separated from its vehicle process. Acknowledgement The project was supported by BarossGábor R&D Project, #REG-DD References Brundtland, G Report of the World Commission on Environment and Development: Our common future. URL: Csukás, B Simulation by Direct Mapping of the Structural Models onto Executable Programs, AIChE Annual Meeteng, Miami, Paper 239/9. devoil, P., W.A.H. Rossing and G.L. Hammer Exploring profit Sustainability trade-offs in cropping systems using evolutionary algorithms. Environmental Modelling & Software, 21: Fiscus, D.A Comparative network analysis toward characterization of systemic organization for humanenvironmental sustainability. Ecological Modelling, 220: García-Serna, J., L. Pérez-Barrigón and M. J. Cocero New trends for design towards sustainability in chemical engineering: Green engineering. Chemical Engineering Journal, 133: Kim, D., K. Rho and S. Kim A Theoretical Model of p53 Dynamics Identifying optimal therapeutic strategy for its activation and stabilization. Cell Cycle, 8 (22):
80 Kim, S., M. I. Aladjem, G. B. McFadden and K. W. Kohn Predicted Functions of MdmX in Fine-Tuning the Response of p53 to DNA Damage. PLoS Computational Biology, 6 (2): Li, Y.P., G. H. Huang, N. Zhang and S. L. Nie An inexact-stochastic with recourse model for developing regional economic-ecological sustainability under uncertainty. Ecological Modelling, 222: Martinet, V A characterization of sustainability with indicators.journal of Environmental Economics and Management. 61:
81 Accentuation and innovation of a conceptual model in the development of database applications Jan Tyrychtr 1, Petr Herold 2, 3, Švarcová Ivana 4 Abstract. The paper is modified Entity-Relationship data model so as to meet the database design process with accentuation on the quality of software applications. Schema diagrams Entity-Relationship model (proposed by Chen in 1976) is innovated on the set of alerts. Possible uses an innovative model is presented. This paper emphasizes that the farmers Keywords: database, database system, conceptual design, ER diagram, Entity-Relationship. 1. Introduction Currently the emphasis is on quality software as a factor in economic success of the organization. Databases and database systems are used to organize and manipulate data in most organizations. Also, most application software and web applications are principally focused on the use of the database system. To address the problem is that the processor (company, programmer - analyst, etc...) of application is faced up to many questions, not only what to do during creating the application, but also how to choose a programming language and database system. Some questions are answered themselves contracting requirements (company, organization management, etc.). The problem for selection of the fastest database system is not always the deciding factor for running applications. The client and the applications executor (using a database management system) will generally realize that the complexity of processing database queries is not constant O (1), thus independent of the input size. Ignorance or laxity in the development and design phase of the database schema is unfortunately not n-time application, which has mostly redesign the structure of a database schema, is very difficult. This loss of efficiency leads to restructuring of the entire application or database schema. This leads to economic loss for the organization. Important during the application design is to focus on the steps of the process of database design data model of the system for database management. [3] In the third part is emphasized conceptual data model. In the second part (Figure 1) is created conceptual schema that describes the database structure independent of the database system. A conceptual model is used to describe the conceptual schema. [3] Czech University of Life Sciences Prague, Faculty of Economics and Management, Department of information technologies 73
82 Figure 1. The database design process [3]. In the conceptual data model must be clearly different application requirements. The database design process can be usually involved more than one human being resource. Each stage of this process can be handled by another designer. This means when creating the database is needed to bind ents of the communication chain exponentially. Therefore, the requirements and specific applications have been transmitted through the steps of the design, and concise form so as to avoid loss of information and tions during its life. 3. Conceptual schema Creating a data model is needed to create any database system. The data model is a set of concepts that can be used to describe the structure and operations on the database. [9] It represents the output data modeling (or conceptual propose), as an activity that aims to create a conceptual schema in diagrammatic form and facilitate communication between developers and users. [9] For the most database solutions data model is necessary to gradually formulate (Figure 1), this means first define its structure in general. This is necessary to use a conceptual scheme that uses the abstraction of the real world objects. At present, the Entity-Relationship (ER) model is the most important paradigm for conceptual database design. [3] The ER model for conceptual data modelling was introduced by Chen [8] in The scheme was formalized Bachman diagrams in 1969 [2]. The ER model can be used as a basis for, and model sets of entities. [8] For a graphical representation of the ER model is used in the ER diagram. The technique of the ER diagrams is a graphical way to view entity types, relationship types and attributes. [5] Formal definitions of entities and sets is: Theory of sets (DEFINITIONS) [5] The ENTITY e 74
83 The Entity set E, e E The VALUE v The Set of values V, v V The RELATIONSHIP r The Relationship set R, r R Figure 2 shows the ER diagram of the two entities. Types of entities EMP and PROJ are represented by a rectangle, the types of relationships as WORK-FOR are represented by diamond. The set of values (domain) as EMP#, NAME, and PHONE are represented by a circle, whereas the attributes are mapped from the entities and relationships to a set of values. [5] The cardinality of the relationship between sessions is shown in the diagram by connecting lines, for example as "1" and "N". Figure 2. The ER diagram [5]. 3.1 Upgrading an Entity-relationship diagram By creating a conceptual schema using the ER diagram and the subsequent transfer of the logic diagram can be realized by a particular physical database schema. However, this procedure does not allow communication noise, as mentioned database design and model) is lost or distorted information. Another factor influencing the final application is not accentuated importance of influence the number of records stored in the database. This has resulted in the application (using the database system), which is designed according to client requirements and meets the specified performance, do not necessarily meet the effectiveness of such applications. Especially when it is measured by response time attribute. Other factors affecting the relational database schema is a solid indicator of complexity, the length of the reference tree is not 10] All these factors influence the effectiveness of relational databases and reduce the effectiveness of the application. Already in the conceptual stage, it is necessary to these factors in the ER model record. Figure 3 illustrates model [6]. The ER diagram is based on GERM. 75
84 E# AGE C# BREED EMP 1 M WORK FOR N 1 COW GROUP 1 M IS COMPOSED N 1 COW C_G# HOUSING SYSTEM MILKING SYSTEM 1 M MILKING UDDER QUARTER N 1 MILK YIELD Figure 3. Entities and relationships for cow s data. Based on empirically validated depending the number of rows in relational tables in the RDBMS response time (second part) and the results of the experiment [10] the ER diagram is modified so as to meet the database design process to accentuate the quality of software applications. The ER diagram (ER diagram innovation is presented on the example of Figure 3) is added to the set of entities, called the set of alerts (Figure 4). The set of alerts has two attributes MILK YIELD and COW. These two attributes are in the ER diagram (Figure 3) and the entity set COW and set MILK YIELD. In the set of alerts these two attributes are used to record the properties of typical saying for a set of entities MILK YIELD and COW. Text attributed the arrow represents the value to the attribute (this method was used in Chen [7]). ALERT 'Frequent access to entities.' MILK YIELD X X COW X 'Prediction: entities / year.' 'Prediction: 100 entities / year.' Figure 4: The entity set of alerts. The ES-A (Entity Set - Alert) is used to record the expected characteristics of real objects (entities), pervasive access from conceptual data model to database schema. ESA can be transformed into a logical data model (Figure 5). The ES-A is added attribute NUMBER A. This attribute is optional, s indexing table attribute in the model record. 76
85 NUMBER 1 1 ALERT# ALERT 1 1 MILK YIELD 1 COW 1 'Frequent access to entities.' TEXT X X TEXT X 'Prediction: entities / year.' 'Prediction: 100 entities / year.' Figure 5. The Set of Alert transformation to logical data model. Table 2 presents the resulting transfer of ES-A from a logical data model into a relational data model. Columns MILK YIELD and COW are entity sets from ER diagram (Figure 3). A NUMBER for each attribute, see the data that was recorded already in the conceptual data model design. In this case our example, the second column provides information about the entity (in the conceptual model), table (in the relational model) MILK YIELD. The MILK YIELD table is assumed greater frequency of records. NUMBER A Table 2. The set of alerts transformed in table. MILK YIELD COW 1 'Frequent access to entities.' 'Prediction: 100 entities / year.' 2 Prediction: entities / year.' Graphic appearance of the ES-A as it has been shown in Figure 4, becomes the major conceptual models unclear. Therefore, the ES-A can be transformed into a simplified way of representation (Figure 6). The set of alerts is graphically expressed by a triangle. Attribute values are written on the sides of the triangle. Attribute names are expressed in parentheses, which are attributed to each value. Frequently access to entities.' (MILK YIELD) 'Prediction: 100 entities / year.' (COW) Prediction: entities / year.' (MILK YIELD) ALERT Figure 6. The Set of Alerts simplified representation. Mathematical concepts of entities and relations remain unchanged. Conceptual data model expressed in the ER diagram with a set of alerts is called an Entity- Relationship Alert (ER-A) model. 77
86 3.2 Benefits of the ER-A model Verification using the ER-A model in practice were confirmed the following benefits: The ER-A model stores important meta-information about entities that would otherwise members of the development team were unavailable or subject to distortion. The model uses its graphical representation of the classic elements of the ER diagram. It is possible to use a triangle symbol for a graphical representation of a set of alerts. The model can be used in different types of database projects. Model complexity is increased minimally. The model is easily readable by all members of the development team (assuming that control modeling using the ER diagrams). The main benefit of ER-A model is more efficient way to create databases, so that the databases are optimized for a specific type of application on the basis of recording the meta-entities. 4. Discussion Method accenting on non-optimized database is verified on a single type of application. The ER-A model was compared in terms of continuity between the artifacts involved in any stage of the process of database development. Suitable models would be compared for example with honey. [11] The ER-A model is enriched by association rules (AR-EER, [12]), Mesodata [13], etc. The ER-A model does not allow for value-added sub-processes of communication with members of the development team. By extending the model of ER-A on the above mentioned subjects, receive the application the new process model dimension and an economic dimension, which increases its applicability in the real business practice. 5. Conclusion Today is a conceptual diagram depicting mostly through the ER model. This model and its notation Chen were published in Since then formed various alternative notation (Martin's notation, notation Bachman, IDEF1X, UML, etc.) and models - to notations and models became the ability to record as many different types of relationships, types of attributes, hierarchies, and their mutual correlation (the EER model, the AER model and others). In [4] proposed a set of metrics for measuring the structural properties of the ER diagrams for external quality prediction model. Article [1] shows that the presence of the relationship hierarchy is the main source of model complexity. All these findings are reason for using commonly understood notation for creating conceptual models, without additional elements which reduce the clarity of the model. The authors were introduced innovative Chen's ER model (called the ER-A model). This model uses the classical simple Chen's notation, a modified set of alerts (ES-A). ES-A model adds important information about the entities that would otherwise members of the development team was unavailable or subject to distortion (self-images of entities). The results of statistical tests confirmed that the response time of application is positively associated with the number of rows in a database. This is an important confirmation that the development of databases is necessary to predict future utilization of the database. This must be done structure and logic of conceptual, logical models and databases. Significantly is therefore accentuated the need to add information (having influence on the future application in terms of deceleration of the overall effectiveness of the database system) into the ER model. The proposed conceptual data model innovation aims to improve the quality of database projects created a way to avoid noise in the communication of information transfer between members of the development team. 78
87 References [1] Artale A., Calvanese D., Kontcha Extended ER Models, (2007) ER 2007, pp [2] Bachman C. W. (1969) Data Structure Diagrams, Database 1, 2, pp [3] Fahrner C., Vosseng G.(1995) A survey of database design transformations based on the Entity- Relationship model, (1995) Data and Knowledge Engineering, 15 (3), pp [4] Genero M., Poels G., Piattini M.(2007) Defining and validating metrics for assessing the understandability of entity-relationship diagrams, (2007) Elsevier, October [5] Chen P. P., (2002) Entity-Relationship Modeling: Historical Events, Future Trends, and Lessons Learned in: Software Pioneers: Contributions to Software Engineering, Broy M. and Denert, E. (eds.), Springer- Verlag, Berlin, Lecturing Notes in Computer Sciences, June 2002, pp , ISBN# [6] -Relationship models,entity-relationship Approach to Systems Analysis and Design (North-Holland, 1983). [7] Chen P. P.(1980) English sentence structures and Entity-Relationship diagrams, in: Chen, P.P. (ed.), Entity-Relationship Approach to Systems Analysis and Design (North-Holland, Amsterdam, June 1980). [8] Chen P. P.(1976) The entity relationship model: toward a unified view of data, ACM Transactions on Database Systems, 1, 1 (March 1976),9-37. [9] Navathe S.B., (1992) Evolution of data modeling for databases. Commun ACM 35(9): [10] Piattini M., Calero C., Genero M.(2001) Table Oriented Metrics for Relational Databases, (2001) Software Quality Journal, 9 (2), pp [11] traceability, Data & Knowledge Engineering 65, pp [12] Chen G., Ren M., Yan P., Guo X. (2007) Enriching the ER model based on discovered association rules, Information Sciences 177, pp [13] La- methodologies, Information and Software Technology, 50, pp
88 Experience of an Intensive Program Course on Utilization of High Technology Equipment Zoltán Hagymássy 1, Erzsébet Ancza 2 Abstract. An International Intensive Program facilitates students to achieve competences to work in the international context of agro engineering industry. In 10 course days students and teachers of Hamk University of Applied Sciences at Mustiala in Finland and University of Debrecen, Centre for Agricultural Sciences in Hungary and Stoas in Netherland have been together from 3 April till 16 April 2011 at the University of Agriculture (USAMV) in Cluj-Napoca, Romania to fulfill this course. The course content is triggered by usage of GPS in agriculture to improve efficiency by reduction of losses, both in usage of fertilizers and pesticides. After learning about fertilizer spreaders in general, students had the opportunity to adjust and then to check the adjustments with a real machine. The stages of the testing procedure: 1. Determination of the main physical properties of the fertilizer used 2. Flow-rate measurement 3. Spreading test Keywords: GPS in agriculture, Fertilizer distributor, Spreading test. Összefoglaló. Egy nemzetközi, intenzív program keretében a hallgatók kutatási és munkagyakorlatot szereztek nemzetközi agrárvállalati környezetben. A 10 napos program keretében hallgatók és kutató tanárok Magyarországról, -tól április 16.-ig tartó kurzuson Kolozsváron, Románia az USAMV Egyetemen, növelve a termelékenységet, csökkentve veszteséget, kijuttatása esetén. gépeket beállítani és vizsgálni. Az elvégzett vizsgálatok: 1. A fel meghatározása 2. Adagolás Kulcsszavak: GPS a zóró, 1. Introduction The modern agro-food sector has to meet society demands like food safety, sustainability and the aim that there should be enough food production in 2050 to feed 9 billion people. This implies the needs of high efficient use of nutrients in production processes (horticulture, crops, animal production). This includes low input farming / high output farming; cost price efficiency; reduction of environmental losses. High tech state of the art- technology contributes to this efficiency. The development of high tech mechanics in agricultural equipment is a continuous process of innovation. Both industry and research are stakeholders in this development process. Once applied in the agrofood sector special companies and contractors with a highly specialized workforce deliver the equipment, services or contractor services to the primary sector (farmers) Improvement the quality and increase the volume of multilateral cooperation Stoas University (Nl) cooperates in projects with Hamepolitechnics (Fi) and USAVM (Ro). The USAVM (Ro) cooperates with Debrecen (Hu) in the field of agricultural engineering. All cooperation is bilateral. This consortium aims to work together in a multilateral way. The cooperation includes both agricultural engineering aspects (GPS applications) and transfer skills in relation to advisory services and farmers. 1 Debreceni Egyetem Agrár- és Gazdálkodástudományok Centruma, -, Élelmiszertudományi és Környezetgazdálkodási Kar hagymassy@agr.unideb.hu 2 Debreceni Egyetem Agrár- -, Élelmiszertudományi és Környezetgazdálkodási Kar, ancza@agr.unideb.hu 80
89 1.2. Project objective The biotic and a-biotic circumstances, including climate, are different in the 4 participating countries: lowland and sea climate in the Netherlands, mountain area and central European climate in Transsylvania (Romania), puszta and central European climate in Hortobagy and Tiisza region (Hungary), South Finland and Scandinavian climate. Therefore the application of agriculture mechanisation will be different. It is important for future graduates to achieve the competences in the context of another country (biotic or a-biotic circumstances), or to get information from another context. The industry of agricultural mechanisation is an international one. The companies operate in the international market and the need middle managers and advisors who are able to work successful in an international work environment The innovative aspect The innovative character is first of all in the subject High tech mechanization, especially the application of GPS in precision farming and sustainable farming. The specialisation of different universities in this field is combined in the IP. Secondly: the farmers (primary sector) play a key role in the process of implementation and application of GPS. Therefore the programme focuses also on transfer skills to inform the farmers (indirect beneficiaries) and to coach or assist them to come to the decision they need for their enterprise. Thirdly students are able to consider sustainability from the investments from economical and social points of view, and from the point of view of efficient use of resources. Corporate Social responsibility (CSR) is part of the competences and CSR is defined as the concern for social impact of the companies operations and activities. The combination of these three aspects requires a multidisciplinary approach and competence based education. (see objectives and competences formulated just before) 1.4. The competences of the students A. Discussion and defining the problem-solving of an international approach of working with techniques for a sustainable agriculture under different regional conditions. B. Drafting a plan of advice: Drafting a plan of advice concerns the transferring of research results into a clear result directed written advice, and conducting an advisory interview, so that the results of the research will be incorporated and will be practically feasible. C. In-depth exploration of the sector: In-depth exploration of the sector is about being able to apply previously acquired knowledge, insights and experiences, and drawing connections between these so that one can be professionally useful. D. Obtaining new information, insights and developments in the sector: In obtaining new information, insights and experiences in the sector, one need to collect, interpret and apply these in a way in which one can move as a professional within the sector. 2. Materials and methods The Intensive Programme is developed and offered by a consortium of Finnish and Dutch universities of applied sciences, and Hungarian and Romanian research universities. The two week IP training will be offered yearly in one of the participating countries. The training content is competence based and therefore based on wants and needs of farmers and industry (agribusiness). In obtaining new information, insights and experiences in the sector, students need to collect, interpret and apply these in a way in which one can move as a professional within the sector. The course content is triggered by usage of GPS in agriculture to improve efficiency by reduction of losses, both in usage of fertilizers and pesticides or herbicides. Nevertheless it can not only be a high tech oriented course. The end-users of the high tech applications are farmers and contractors. The students will be trained in transferring skills to be professional intermediates, advisor, teachers or trainers. In 10 course days students and teachers of Hamk University of Applied Sciences at Mustiala in Finland and University of Debrecen, Centre for Agricultural Sciences and Engineering in Hungary and Stoas have been together from 3 April till 16 April 2011 at the University of Agriculture (USAMV) in Cluj-Napoca, Romania to fulfill this course. The course content is triggered by usage of GPS in 81
90 agriculture to improve efficiency by reduction of losses, both in usage of fertilizers and pesticides or herbicides. Nevertheless it can not only be a high tech oriented course. The end-users of the high tech applications are farmers and contractors. The students will be trained in transferring skills to be professional intermediates, advisor, teachers or trainers After the IP the student is able 1. to discuss advantages and disadvantages of GPS use in agriculture in consideration of social, economical and environmental aspects of sustainability.. 2. to apply GPS on farm level or contractors level 3. to assist farmers to come to a correct decision in relation to the farm objectives, farmers wants and needs and society demands. 4. to cooperate in the English language with peer students from other European countries, supervised by teachers from other European countries Facilitation of development of innovative practices in education and training Innovation, development and implementation of GPS-based technology in relation to management information systems is growing. It is a rapidly evolving area. This is strongly related to highly efficient agricultural systems. Therefore it contributes to sustainable agricultural approaches. The consortium is aware that it is necessary to share this experience and knowledge. Dissemnination of this knowledge and experience is one of the goals of this project. The direct link with extension and advice in agriculture (transfer of knowledge) is innovative, dependent on the educational culture of the consortium partners. The International Project contributes to the needs of farm enterprises and contractors too. Both categories need multidisciplinary trained and competent employers. On the level of course development and teaching the consortium partners share their experiences in competence based education and enhancement of self responsible learning. It is evident that there are differences in this respect between the two Western universities of applied sciences and the central or eastern European research universities. The research universities share their research experience and results with the universities of applied sciences. 3. Results and discussions 3.1. Utilization of high technology in nutrient supply. Testing a real fertilizer spreader After learning about fertilizer spreaders in general, students had the opportunity to adjust and then to check the adjustments with a real machine. It was explained that the highest level of technical equipment can be useless if the machine setting is not accurate and precise. A Rauch MDS 935 type of fertilizer spreader was provided by the Department of Machinery of the University. Students also had a copy of the Operator manual of the machine. The stages of the procedure: Determination of the main physical properties of the fertilizer used Flow-rate measurement Spreading test 3.2. Determination of the main physical properties of the fertilizer used The main objective of this operation was to draw attention on the differences of physical properties of fertilizers that we use and those in the manual even if the types are the same, and on the necessity to check them and then to use the results in the setting procedure Flow-rate measurement The bulk density (kg/l) of the Ammonium nitrate was measured and as it was definitely different (0.88 kg/l) from the bulk density of the Ammonium nitrate in the manual (1.05 kg/l), students had to modify the setting data given in the manual. The required application rate was 200 kg/ha. 82
91 3.4. Spreading test Details given in the spreading charts obtained using fertilizer with ideal physical characteristics. Relevant technical spreading characteristics of fertilizer can vary, even with the same type and brand. Manufacturers provide a practical test kit which offers an in-field simple and quick method of checking spread patterns. This means greater assurance of constant accuracy during spreading and increased precision. The spreading test was carried out on a field on the Experimental Research Facility of the University. Students worked in groups of 4 people. Before starting the test they had to adjust the machine (hoper height, vanes, metering slides), according to the instructions given in the manual. The layout of the field test is shown on Figure. 1. The actual working width was 15 meters and 6 catching trays were placed on the overlapping zone of the spreading. GPS equipment was installed in the tractor to help following the tramline and keeping the working width. (Csizmazia, Z. 1993) Carrying out three test runs (Practice Test) Layout: Test area width: 3 x track width Test area length: m The three tracks must be parallel. Figure. 1. The layout of the spreading test Perform a calibration test Ground speed: select 3-4 km/h. Run over tracks 1 to 3 in succession. Open metering slide 10 m before the catch trays. Close metering slides approximately 30 m after the catch trays. Evaluate the results and correct if necessary: Collect the contents of the trays and pour them into the measuring pipe from the left. The quality of the cross-distribution can be easily read from the fill level of the three sight glasses. Possible results of pass (Figure. 2): A: The same quantity is in all tubes (permissible deviation ±1 graduation): Adjustments are correct. B: Asymmetrical fertiliser distribution. 83


92 C: Too much fertiliser in the overlap zone D: Too little fertiliser in the overlap zone. Figure. 2. Possible results of pass 3.5. A standard spreading test procedure The transversal spreading pattern was determinate, the maximal and the optimal working width were determinate, available with the given fertilizer and with the given adjustment simulation of border spreading. Figure. 3 shows the real conditions during the test procedure. Two students are staying in the cabin of the tractor at the same time. One of them is driving the tractor while the other one is checking the operation of the GPS. Figure. 3. The Rauch MDS 935 fertilizer spreader during the testing procedure After completing the three runs students collected the content of the trays and evaluated the result (Figure. 4). As the figure shows it was not correct for the first time. Following the suggestions of the manual the students made the correction of the spreader setting, which resulted in an excellent distribution (Figure. 5). 84


93 Figure. 4. Fertilizer distribution obtained by setting the machine according to the manual Figure. 5. Fertilizer distribution obtained after the first correction References Csizmazia, Z Technical Conditions of Equalized Fertilizer Applications. Hungarian Agricultural Research. 1993/12:
94 Results of a survey on conscious consumerism and food consumption habits among Hungarian higher education students Tünde Csapóné Riskó 1 Georgina Árváné Ványi 2 Abstract. The present article tries to define conscious, responsible and ethical consumerism through collecting and introducing relevant articles, studies and researches. It also tries to identify the common aspects, background of conscious, ethical and responsible consumer behaviours. Collects and introduces the findings of selected researches made in different countries in conscious and ethical consumerism. Besides introducing secondary data, details of a survey carried out among higher education students in Hungary in 2010 will also be introduced. Some results, findings of this primer research regarding conscious consumerism in general and conscious food buying habits will also be demonstrated. When preparing this above mentioned survey we wanted to find out: (1) whether Hungarian higher education students consider themselves as conscious consumers; (2) how conscious they think Hungarian consumers are. We also wanted to know (3) where they usually buy food and (4) what the main characteristics of a food product they take in to account when buying it. (5) Can consumers influence the business practices of companies and (6) Are they willing to pay premium for ethical products - the responses to these questions will also be introduced. Keywords: consciousness, responsibility, sustainability, ethical consumerism 1. Introduction The number of studies, articles examining ethical, conscious and responsible consumption is considerably high. The perspectives of social scientific research include economics, sociology, marketing, anthropology, psychology, human geography (Pepper et al citing Princen et al., 2002, Reisch and RØpke, 2004, Jackson, 2006). Some focuses on the trend, some looks for the motivations of conscious consumers, explores the relationship between the theory, or beliefs and the everyday practice. Some others emphasize that consumption is often embedded in relationships of obligations (Szmigin et al., 2009, ScienceDaily, 2007). Some studies investigate whether negative information about a company affects consumers opinion of the company and ultimately, their product purchasing decisions (Brenton Hacken, 2006, Cotte - Trudel, 2009). There are some studies investigating whether consumers are willing to pay a premium for an ethical product (Tallontire et al., 2001, GfK NOP, 2008, Magyar Gallup Intézet, 2005, Cotte - Trudel, 2009, Lukács, 2006). These are quite important questions to study from the point of view of companies, as well, since they can get acquainted with the consumers way of thinking; what they expect from the companies; what kinds of business practices are acceptable for them; what kinds of information they consider and rank before making a consumer decision. It is worth being prepared for the expectations of consumers since companies can benefit from that. In our survey we wanted to investigate the opinion, beliefs and everyday practice of Hungarian higher education students in connection with conscious consumption. Results and findings are continuously compared to the results and findings of other surveys both in Hungary and abroad. 2. Defining the concept Public awareness of the human, ecological and environmental cost of consumption has increased over the past few decades. It has been closely accompanied by the idea that consumers can improve matters through responsible consumer choices. The ethical consumer is a fixed identity who makes rational use of available information about free trade/corrective solutions to consider the consequences of their purchase practices (Adams and Raisborough, 2010 citing Fraj and Maritnez, 2007 and Cherrier, 2007). 1 Assistant Professor, Budapest Business School, Faculty of Commerce, Catering and Tourism, Institute of Commerce, Budapest, Hungary csapone.riskotunde@kvifk.bgf.hu 2 Scientific Researcher, University of Debrecen, Faculty of Applied Economics and Rural Development, Institute of Business Economics 86
95 An increasing number of people make their consumption decisions on the basis of ethical values, such as environmentally friendly products and production methods, labour standards (wage rates and working conditions), and human rights. Ethical consumerism is a growing phenomenon that underpins ethical trade activities (Tallontire et al., 2001). What is ethical consumerism? Ethical Consumerism means adopting a different perspective on our disposable income. Instead of seeing money as a means to buying us status, luxury goods or an improved quality of life, we also need to consider our money as a vote which we use every time we go shopping. Buying cheap clothes which have made in sweatshops is a vote for worker exploitation. Buying a gas guzzling 4X4, especially if you are a city dweller, is a vote for climate change. Even small, everyday purchases, such as coffee, tea, breakfast cereal, bread or bin bags are a vote for something. Favouring organic produce is a vote for environmental sustainability and fair-trade, a vote for human rights. It is important to remember that while we might be saving money, there s always a cost somewhere down the line. Cheap clothing produced in East Asia or Central America comes at a cost to those making the clothes, earning barely enough to survive. Factory farmed animals, meanwhile, may make cheap meat but it comes at a price of the quality of life of the animal. When it comes to supermarkets, the cost can be to our high streets and local shops. Considering ethical issues when we go shopping means taking impacts like this into account ( When I go spend money I m making decisions based on where that money s going to go after. Is it going to be used against me or somebody like me someplace else in the world or is it going to actually contribute to building a world where the things that I value are also treasured? The following suggestions for ethical consumption are not meant to make people feel guilty about buying things or to feel overwhelmed with yet another task. Ethical consumption is a way to help us feel that we have power as consumers that we can vote with our dollars. By using this consumer power we can have an impact on the larger economy and help create a world where the economy benefits all people in more equal ways ( Ethical consumption activity includes positive choice behaviours such as the purchase of fairly traded or environmentally friendly products, and can involve avoidance and boycott of certain goods or companies (Szmigin et al., 2009 citing Cherrier, 2007, Newholm and Shaw, 2007). Szmigin et al. - citing Peattie, 1999 says, the best way to understand ethical consumerism is to view each individual s consumption as a series of transaction decisions that include decisions to engage or sometimes not engage in alternative consumption behaviour (Szmigin et al., 2009). Ethical consumerism has three main components: (a) animal welfare; (b) the environment; (c) human rights/working conditions and fair trade. Each of the three headings has positive and negative aspects: those products and practices which are upheld and promoted and those which are deplored and avoided/boycotted (Tallontire et al., 2001). Categories of ethical consumers: (1) Distancers: aim to avoid consuming goods and services they consider unethical, sometimes to the extent of limiting their overall consumption. Involves life style change, separating them from the bulk of consumer society. Some require considerable information to enable them to implement their holistic philosophy whilst for others minimizing their consumption is sufficient. (2) Integrators: attempt to implement their ethical views in all aspects of their life from work, to consumer goods to financial products. Because they spend much time working and campaigning on these ethical issues they may have to limit their engagement in ethical consumption. (3) Rationalisers: tend to act on their ethical values in certain limited ways, for example, consuming particular products with ethical attributes. They accept consumer society and enjoy its pleasures and conveniences. However, they believe they should act in those (few) cases where consumerism creates real problems (Tallontire et al., citing Newholm, 1999). Conscious consumption refers to choices to reduce or alter consumption that are conscientiously made and motivated by values such as social justice, sustainability, corporate behaviour, or workers rights. Conscious consumers seek to have a positive impact on the world for their own families, for the environment, or for communities across the globe (Schor and Willis, 2009). 87
96 Decisions we make and decisions others around us make are sometimes in line with how we d like to live and sometimes not. The problem is that we rarely see how our choices affect our world. Everything around us can seem completely out of control and out of our hands. Each time we buy a product or a service, we place a vote of confidence in that producer or service provider every source of raw material, every practice of environmental standards, every form of employee relations and every form of communication with the public. Everything that company or group does is something we support. Everything that company or service provider does and believes, we ve said yes, go ahead and keep doing it. We ve given them a bit of our energy, in the form of our money, to continue doing whatever it is that they do with it without accountability to us for any actions except for our continued support in buying their products and services and our reliance on our overburdened governmental controls to manage and regulate them ( The socially conscious consumer can be defined as a consumer who takes into account the public consequences of his or her private consumption or who attempts to use his or her purchasing power to bring about social change (Webster, 1975). Being socially conscious isn t something you do; it is something you are. Being a socially conscious consumer is about awareness. It s educating yourself about who and what is involved in bringing products and services into your life, and it s considering that process when you make decisions. It is getting in touch with yourself and your values and priorities figuring out what is important enough to you not to compromise on and what things you d like to support or avoid when it s feasible for you. It s developing habits in your consumption choices and not sweating the exceptions to the rule. It s not about taking the easy path every time, but it is about making realistic choices for your life. If you approach your life and your choices as a consumer in a thoughtful way, and consider the connections your actions have on a larger scale, then you re living a socially conscious lifestyle that is much more than a never-ending series of duties or obligations to make the socially responsible choice in every situation. As a socially conscious consumer, there will always be times when there are no good options to choose, times when you decide not to do the right thing, and times when you make the necessary sacrifices. And that s fine because being socially conscious isn t about doing the right thing every time. It is being the kind of person who cares about doing the right thing. You can decide you can t pay two times as much for a fair trade coffee on a regular basis or spend hours travelling to the nearest worker cooperative. You can even shop at Wal-Mart and still be a socially conscious consumer. If you can t afford to buy pricey fair trade goods, or haven t got the time to shop at the locally-owned grocery store on the other side of the town, that doesn t mean being socially conscious is not for you. As long as you re thinking about the impact of your decisions and are looking for socially conscious choices that are right for you, you re part of the solution ( The systematic review (Socially Conscious Consumerism Report), conducted by the Network for Business Sustainability, synthesises thirty years of research on whether consumers are willing to reward firms for their positive sustainability actions either by changing their behaviour or by paying a price premium. The authors summarise findings from over 90 academic and practitioners articles to summarise current knowledge in this area. Two out of the ten key findings are as follows: (1) there is currently no coherent view who a socially conscious consumer is. All the usual descriptions used in consumer research, such as demographics and psychographics, have provided conflicting results this far; (2) there is some evidence that factors other than sustainability attributes are more important in driving consumer behaviour, such as prompting consumers, making their purchasing decisions visible, and making them feel like their purchases will make a difference (Cotte - Trudel, 2009). Pepper et al. says, citing Jackson and Michaelis, 2003, sustainable consumption as a discourse, a field of enquiry and a course of action, has arisen within a context of growing awareness of the ecological limitations on human activity. Sustainable consumption is a broad and contested concept that concerns the interaction of social and ecological issues such as environmental protection, human needs, quality of life, and intra-generational and inter-generational equity (Pepper et al., 2009). As the diverse citations shows, defining the concept is not an easy task. The available literature and research findings in this field are considerable. What do we mean by ethical / conscious / sustainable 88


97 consumer or consumption? It is a quite complex question. It can be stated that the common point is responsibility. These consumers consider not only financial, economic aspects when buying a product or service. They look beyond the product, the service and consider social and environmental questions, problems, as well. They are sensitive, aware and believe that buying a product or service is not a simple economic decision or action. They care about their narrower and wider social and natural environment, as well as the future of our planet. They believe that we have to be responsible as consumers also. The drivers of these actions, the motivations can be rather diverse and that makes the question really complicated and exciting to study. 3. Survey on conscious consumption among Hungarian higher education students 3.1. Material and applied methods questionnaire in Aprl-May Altogether 504 filled in questionnaires were suitable to be processed and evaluated. SPSS was applied for using different statistical methods. number of responses number of responses Figure 1. Gender ratio of respondents Figure 2. Level of education of respondents (Own data collection, 2010) (Own data collection, 2010) Figure 1. shows the gender ratio of respondents. As it can be seen female students are overrepresented, their ratio does not correspond to the ratio of female students enrolled in higher education. Their ratio in the 2009/2010 academic year was only 56 percent (Statistical Yearbook of Education 2009/2010). As Figure 2. shows mainly Postsecondary and BSc/BA students were involved in the survey. Figure 3 shows the permanent address distribution of respondents, while Figure 4. the place of current studies. Students at five higher education institutions in three towns were involved in the survey. number of responses number of responses Figure 3. Permanent address of respondents Figure 4. Place of current studies (Own data collection, 2010) (Own data collection, 2010) 89
. Number of responses Figure 5. Responses to How conscious consumer are you?")
98 3.2. Conscious consumerism in general Respondents to the survey were asked to evaluate how conscious they considered themselves as consumers. As Figure 5. shows, most of the respondents evaluated themselves as average conscious consumers ( 3 and 4 values). Number of responses Figure 5. Responses to How conscious consumer are you? (5=very much, 1=not at all) (Own data collection, 2010) We would like to point out the two extreme locations: Budapest, where the highest ratio of not at all=1 and lowest ratio of very much=5 can be found with 19,9% and 11,2% respectively. The other extreme is the county centre category, where the lowest ratio of not at all=1 and highest ratio of very much=5 can be found with 7,9% and 13,9% respectively. However we also have to point out that the relative standard deviation was 37,5, so the sample is quite heterogeneous and the average (3,16) does not represent the sample correctly. Respondents were asked to evaluate Hungarian consumers as conscious consumers. Figure 6. shows the opinion of the respondents. Responses were a little bit surprising. Although respondents considered themselves as good (4) or fair (3) conscious consumers, they have worse opinion as regards Hungarian consumers. 243 out of 504 believe that Hungarian consumers are only a little bit conscious, and 143 of them thinks that Hungarian consumers are not conscious at all. Number of responses Figure 6. Responses to How conscious consumers are the Hungarians? (Own data collection, 2010) 3.3. Conscious food consumption TÁRKI prepared an analysis to analyse certain aspects of consumer behaviour in the EU, by using data from the 2005 Special Eurobarometer survey on food safety. They report that the most influential factors in the choices of European consumers are quality and price. The elements were chosen by around 40% or more of the respondents. For about a fifth of the consumers, the appearance of the food is important. This is followed by taste, healthiness and family preferences. All the other elements were mentioned by less than 10% of respondents. The pattern of importance for the old member states is 90
99 almost identical to that for the EU25 as a whole, whereas there are certain discrepancies in the pattern of the newcomers. The element that was most frequently chosen by respondents from the new member states was price (46%). Quality was picked by only 34% (roughly the same as appearance). Taste was chosen by a fifth of the respondents, and 12% mentioned healthiness as a decision factor (Gáti, 2009). A survey was carried out in three towns of the Transdanubian region of Hungary among primary and secondary school pupils on their nutrition habits. In four groups out of the six focus groups shelf life was the most important factor when choosing a food. On the second place we can find healthiness three times, and quality, shelf life and taste. On the third place we can find six different factors: ingredients, taste, fat content, appearance, Vitamin content and quality. The underlined factors were chosen by the secondary school pupils (Fülöp et al., 2009). In May 2009 there was a survey among BA students in Budapest, Hungary. They wanted find out the importance of information, labels available on the packaging of foods in consumer decisions. Shelf life was the most important (85,2%), it was followed by healthiness (82,48%) and high Vitamin and mineral content (81,73%). From the other side of the list we can point out organic/bio (41,15%), Fair trade (40,87%), nutritional content 30,99% and calorie table 21,6%, it was the least important factor when choosing a food (Dörnyei, 2010). Our respondents were asked to evaluate on a scale of 1-5 that the listed criteria (price, origin, ingredients, shelf life, producer) how important are for them when buying a food product. The average results show that price is the most important criteria (4,29), the second one is shelf life (4,11), the third one is ingredients (3,94). The origin and the producer are the least important factors for the respondents with 3,31 and 3,12 averages respectively. Our results cannot be compared to the above cited survey results mainly because of the diverse studied/offered criteria. Price sensitiveness of our respondents and new EU member states that was supported by the TÁRKI report is a common characteristic of these consumers. Hofer and Varsányi carried out a survey in 2005 among university students in Hungary regarding their bio product consumption. They report that the most preferred location to buy a bio product is the place of production, the second one is certified shops. They are followed by fresh food markets, small shops and supermarkets (Hofer Varsányi, 2006). We also asked our respondents to evaluate on a scale of 1-5 how often they buy food at the listed locations. We offered the following locations: (1) hypermarket/supermarket, (2) small shop, (3) bio shop/bio market, (4) fresh food market and not from the same salesman/producer, (5) fresh food market and always from the same salesman/producer, (6) specialised shops (butcher s, greengrocery, bakery, etc.). The results show that the sample was quite heterogeneous, so the average results do not represent the sample correctly. The average was the highest (4,17) for the hypermarket/supermarket category. It was followed by small shops with an average of 3,11, then specialised shops (butcher s, greengrocery, bakery, etc.) with an average of 2,95. The lowest averages are the following: fresh food market and not from the same salesman/producer (2,04), fresh food market and always from the same salesman/producer, (1,83) and bio shop/bio market (1,25). Although we have to point out that the relative standard deviation was high, so the sample was quite heterogeneous and the average does not represent the sample correctly. The relative standard deviation was 25,3 in case of hypermarket/supermarket, so this is the category where the sample was the most homogenous 3.4. Influencing the business practices of companies Responses to the question: What is your opinion? Is the following statement true? We vote with our money, so with our money we support the production of the certain good or the operation of the producer company. Figure 7. shows the results. 452 out of 504 respondents believes that our money is a vote each time we pay for a product or service. The next question was quite similar: Can we influence the business practices of companies with our consumer decision? The results can be seen in Figure 8. Most of the respondents believe that consumers have the power to influence the business practices of companies. On the basis of these responses we can assume that consumers are willing to reward companies for their correct and responsible business practices and penalize them for their incorrect business practices. We also investigated the question of paying a premium for ethical products. This topic will be discussed in the next chapter. 91
100 number of responses number of responses Figure 7. Responses to question: Figure 8. Responses to question: With our...do we vote with our money? consumer decision can we influence the (Own data collection, 2010) business practices of companies? (Own data collection, 2010) 3.5. Willingness to pay a premium for ethical products The Network for Business Sustainability states in its systematic review that (1) the typical average premium that consumers indicate they would be willing to pay is around 10%; (2) some evidence suggests that consumers will demand a discount for unsustainability and that is greater than a premium for sustainability; (3) consumer willingness to change their behaviour (towards the socially conscious choice) is more common than willingness to pay a premium; (4) consumers often appear to expect the socially better choice to be of the same quality and price it does not appear that they will trade-off functionality (Cotte - Trudel, 2009). Tallontire et al. points out, that whilst income may play a part, there are two more factors that appear to be important in consumers willingness to pay a premium: awareness of the ethical issue related to the product and market characteristics of the product. Taking market characteristics first, the extent to which a product is considered to be essential or a luxury is important (Tallontire et al., 2001). GfK NOP made a survey in five countries (Germany, USA, France, UK, Spain) and reports that nearly one third of the respondents (31%) claim they are willing to pay a 5-10% premium for an ethical product (GfK NOP, 2008). A survey carried out in 2005 in Hungary finds out that 35-44% of consumers are willing to pay more for a product if it is Hungarian or the owners of the company are Hungarian, or if they support with their purchase a charity (Magyar Gallup Intézet, 2005). Lukács studied the importance of corporate social responsibility in consumer decisions. The survey was carried out among university students in Budapest. She reports that 61% of the respondents would choose a more expensive product produced by a responsible producer. Only 17,6% of the respondents would choose a cheaper product and not so responsible product. 16,3% is not sure, they believe their choice makes no difference (Lukács, 2006). We also investigated the question of paying a premium for an ethical product. Figure 9. shows the results. 92
101 number of responses Figure 9. Responses to Are you willing to pay a premium for a product that have been produced ethically by an ethical company? (Own data collection, 2010) 255 out of the 504 respondents (50,6%) would be willing to pay a premium for an ethical product. The ratio of those who do not care is almost 27%. It can be stated that these results fit into the Hungarian and foreign survey results. We can also state that there is a need from the side of consumers for ethical products and ethically operating companies. 4. Main findings On the basis of our primer research among Hungarian higher education students the following findings can be reported: Most of the respondents evaluated themselves as average conscious consumers ( 3 and 4 values). However we also have to point out that the relative standard deviation was 37,5, so the sample is quite heterogeneous and the average (3,16) does not represent the sample correctly. Roughly half of the respondents believe that Hungarian consumers are only a little bit conscious, and about one third of them thinks that Hungarian consumers are not conscious at all. Most of the respondents believe that our money is a vote each time we pay for a product or service. They believe that consumers have the power to influence the business practices of companies. More than half of the respondents would be willing to pay a premium for an ethical product. The ratio of those who do not care is almost 27%. We can state that there is a need from the side of consumers for ethical products and ethically operating companies. As regards food purchase habits, the average results show that price is the most important criteria (4,29), the second one is shelf life (4,11), the third one is ingredients (3,94). The origin and the producer are the least important factors for the respondents with 3,31 and 3,12 averages respectively. References Adams, M., Raisborough, J Making a difference: ethical consumption and the everyday. The British Journal of Sociology. Volume 61, Issue 2, p Brenton, S., Hacken, L Ethical Consumerism: Are Unethical Labour Practices Important to Consumers? Journal of Research for Consumers. Issue 11. p Cotte, J., Trudel, R Socially Conscious Consumerism. Executive Briefing of the Body of Knowledge. accessed: 16 April 2010 Dörnyei, K Fogyasztói magatartásvizsgálatok az élelmiszeren található információtartalomról a jelölések, címkék és label használatának elemzése. Marketing és Menedzsment, 44. évf sz. p Ethical Consumer. A Beginners Guide. accessed: 6 September 2011 Fül vizsgálata. Marketing és Menedzsment, 43. évf sz. p
102 Gáti, A Conscious Consumption. An analysis of food purchase and change in consumer behaviour. accessed: 3 Sept GfK NOP Viewpoint: Consumers and ethical consumption. accessed: 10 September 2011 alapján. Magyar Marketing Szövetség Marketing Oktatók Klubjának 12. Országos Konferenciája. Budapest, augusztus Lukács, R Fenntartha Magyar Marketing Szövetség Marketing Oktatók Klubjának 12. Országos Konferenciája. Budapest, augusztus rországon. p accessed:30 September 2011 Ministry of National resources Statistical Yearbook of Education 2009/2010. p accessed: 6 Oct Pepper, M., Jackson, T., Uzzell, D An examination of the values that motivate socially conscious and frugal consumer behaviour. International Journal of Consumer Studies. Volume 33. Issue 2, p Schor, J. B., Willis, M Conscious Consumption. Results for a survey of New Dream members. accessed: 10 September 2011 ScienceDaily Ethical Consumption: Consumer Driven or Political Phenomenon? accessed: 6 October 2011 Szmigin, I., Carrigan M., McEachern, M. G The conscious consumer: taking flexible approach to ethical behaviour. International Journal of Consumer Studies. Volume 33. Issue 2, p Tallontire, A., Rentsendorj, E., Blowfield, M Ethical Consumers and Ethical Trade. a Review of Current Literature. accessed: 10 September accessed: 30 September 2011 UNPAC. Ethical Consumption. accessed: 6 October 2011 Webster, F. E. JR Determining the Characteristics of the Socially Conscious Consumer. Journal of Consumer Research. Vol. 2. December
103 Results of Cluster Analysis for Foodstuff Consumers Élelmiszerfogyasztói klaszteranalízis eredményei Ibolya Brávácz 1 Abstract. Today issues like enviromental protection, healthy diet, quality assurance of food and consumer protection are attracting more and more publicity.the role of ecological consumer protection is constantly growing in Hungary, with ultimate targetting that conscious consumption will play important role in consumers values.an other basic factor, which has brought and continue bringing revolutionary changes in consumption practices, is the speedy evolution of information technology. The volume and the great variety of reaching the information available results growing differences amongst customers and also creates new consumer groups.my study mainly targets one element of this topic: consumers priorities in foodstuff markets, exploring trends with respect to health and environmental consciousness.i made nationwide primary research in June 2009, the main results are published in this study.i will briefly review the segments of foodstuff consumers, which first have been identified using factor analysis followed by cluster analysis. Keywords: consumer habit, health consciousness, environmental consciousness, environmental protection, cluster analysis Összefoglaló. Napjainkban egyre nagyobb nyilvánosságot kap a környezetvédelem, az egészséges A másik nagyon lényeges - vonalazása - Kulcsszavak: környezettudatosság, környezetvédelem, 1. Introduction Today issues like environmental protection, healthy diet, quality assurance of food and consumer protection are attracting more and more publicity. The role of ecological consumer protection is constantly growing in Hungary, with ultimate targeting that conscious consumption will play important role in consumers values. An other basic factor, which has brought and continue bringing revolutionary changes in consumption practices, is the speedy evolution of information technology. The volume and the great variety of reaching the information available results growing differences amongst customers and also creates new consumer groups. I made nationwide primary research in June 2009, the main results are published in this study. The two main elements of the research: health consciusness, importance of health, survey and assessment of its extent and method enviromental consciousness, motivations of consumers to protect environment when purchasing foodstuff My target is to assertain the place and role of these elements in our foodstuff consumption. In my research the main question was: 1 Budapest Business School, Faculty of Commerce, Catering and Tourism bravacz.ibolya@kvifk.bgf.hu 95
104 How self restrictive and self-conscious are we when purchasing and consuming foodstuff? with every foodstuff purchases we make decisions on our environment, which indirectly has effect on the producers, manufacturers and dealers. 2. Materials and methods The nationwide questionnaire in June 2009 involved 1300 consumers of which.1053 was suitable for evaluation, hence this was the size of sampling. My purpose when creating the sample was representativeness and randomness. The sampling with Data survey were made inhome using standard questionnaire and personnel interviews. Response time was minute 20-25, the number of structured questions inclusive of personnel data were 31. Data obtained were analyzed with SPSS programme. I made analyses using one and multiple variables. Scale type of questions were analysed with using average and percentage computations as well as crosstabulations. 3. Results and discussion 3.1. Health behaviour, conscious nutrition Health behavior: An action taken by a person to maintain, attain, or regain good health and to prevent illness. Health behaviour reflects a person's health beliefs. Some common health behaviours are exercising regularly, eating balanced diet, and obtaining necessary inoculations. Conscious Nutrition: Conscious nutrition incorporates the whole food model and takes it one step further to an energetic level. The purpose of conscious eating is twofold; firstly we must nourish our bodies by eating organic whole foods. Secondly we can use our food choices to enhance our spiritual practice and our subtle energy fields. In this model foods are chosen not only for their nutritional benefits but also for the affect they have on the consciousness The rising of New Consumer and the LOHAS group Consumer's behaviour is under transformation. Therefore companies shall be prepared for the increasing appearance of consumers making conscious, well informed and independent decisions. This is what Lewis and Bridger address in their book The Soul of the New Consumer when discoursing the old and new consumer behaviours. consumer s OLD Comfort Follows others Less active Accommodating Less informed behaviour NEW Authenticity Innovator Active Independent Well informed Figure 1:.Features of the behaviour of old and new consumer Source: Lewis and Bridger, 2001 The convenience what is the most important for the old type of consumer, this drives his decisions and consumer behaviours. His purchasing decisions are more of followers style rather than initiative and opinion-shaper. Neither he is open for novelties and he rather belongs to the late majority in his purchases. He prefers the routine products and takes risk with new producs very rarely. Contrarily the New Consumer consciously looks for the reliance and credibility hence authentic producers and brands. He is initiative, open for novelties, can take risks when purchasing since well informed. 96

105 In the same time (2001, which is named LOHAS (Lifestyle LOHAS consumers tend to make their purchasing decisions in keeping with their values of social and environmental responsibility. LOHAS consumers are those who are passionate about the environment, the planet, social issues, health, about human rights, relationships, fair trade, sustainable practices, peace, spiritual and personal development. The LOHAS numbers show that an enormous consumer market exists for sustainable and healthy products. LOHAS is an acronym for Lifestyles of Health and Sustainability. It is a $355 billion market segment in the United States alone (growing about 10% yearly ket worldwide. The term LOHAS was first coined by sociologist Paul Ray and psychologist Sherry Anderson, coauthors of The Cultural Creatives: How 50 Million People are Changing the World LOHAS marketers call this group by many other names including: lohasians, conscious consumers, progressive consumers, tree huggers, humanist, responsible consumers, and green consumers, but none want to be labeled as such. The interconnections between global economies, cultures, environments, and political systems play a large role in the holistic worldview of the typical LOHAS Consumer, but equally important are the interconnections of mind, body and spirit within individuals. This focus on Personal Development, with the ultimate goal of achieving his or her full human potential, is of utmost concern to the LOHAS consumer Primary market research Consciousness and awareness in foodstuff purchasing Following to customs in purchasing, I have switched to the elements and size of consumers' consciousness. I wish to present some aspects of my analysis. Is that true, when foodstuff purchasing? Seven listed features have been classified in a five grade scale, response 1- means not true while response 5- means fully true. The most important results are shown in Table 1. Table 1: Average of Customer's features, Std. deviation, Variance, per gender and total Domestic foodstuff customers' self estimation is that they are very economic, conscious and specifically price responsives as There are significant differences in view of genders, the momen are more economic, more price sensitives and a little more informed then men. 97
106 Table 2: Average of Customer's features according to store types and totals We can see in Table 2 that, customers of traditional markets qualified the highest averages for all The result of segment analysis I will briefly review the segments of foodstuff consumers, which first have been identified using factor analysis followed by segment analysis. I have identified the following consumer groups based on health consciousness. Conscious majority (34,2%) The majority are women with higher qualifications. Quarter of this segment is from Budapest and the half of it are citizens. The size of the most characteristic houseolds are of 2-3, income is average between HUF or hypermarkets for shopping owing to their price responsiveness. They believe are well informed, the half of this group only purchase healthy food provided the prices are acceptable. Due to the high ages in this group they have the highest degree of healt problems. economical crisis they change their food shopping habits the most. Conscious by commitment (18,4%): LOHAS group? Mostly women from Budapest and large cities from countryside. Usually they live in houseolds of 2-3, with the highest number of enterpreneurs and income. They spend the most on foodstuff every Months especially when price is not important. They are the most health conscius customers, 30,9% of them purchase always healty food, mostly health nourishers. They are ready to change their diet for the sake of their health. They believe are very healthy dieters. They prefer local foodstuff based on quality. Reviewing domestic and foreign publications this segment corresponds the most to LOHAS group described before. My target is to get better aquainted with the attitudes of this segment during next research. 98
107 Economist Housewife (14,0%) ountryside. - - therefore they are the most price responsivenesses. The nourishement is the least healthy. They do not prefer domestic foodstuff, they belive the quality is medium only and they do not buy unless prices are less. They are conscious shoppers with list in hand, price plays the most important role in decisions, they are loyal to brands more than average. Youthfully eclectic (21,7%) Eclectic means their key factors when decision making are mix of styles and customs. the way to higher degr es in t This group includes mainly students and employ The prices are of less important, nor the quality. They do not really care about the origin of the products and brands. Passives (11,7%) and enterpreneur years. One of every four is single, mostly living in households of 2- They spend the less on foodstuff owing to single status, small households and low income. They are tipically inactive and unconcerned in decision makings, they are interested in prices only. 30% of them are not oriente interested in quality. This group is the least interested in health and environment con also believe have never got problems with their health due to unhealthy diet. 4. Summary The primary and secondary researches indicate transformation of our habits in food consumption. consider trust, sustainabilty, health and enviromental protection increasingly important. My primary research shows the difference in health consciousness between the five clusters by ment in Hungary (30% in develo is already there with one third of population, but their purchasing power is small, average income is not enough for more expensive halthy food. Health consciousness should take a greater role in our shoppings in the future. My further target is to investigate the development of clusters subject to health consciousness. Early education of children in schools and at home is important. It is the responsibility of parents and institutions that our growing children become health and enviromental conscious and also will keep constant eye on sustainable growth. 99
108 References Hofmeister- -Simon J.- kozás és marketing, Kaposvári Egyetem, (I. évf. 1- Lewis D.- Sajtos L.- Kaposvár - Szakály, Z. - est, Veres Z- Hoffmann M- 100
109 E-Competences and ICT in Europe László Várallyai 1, Miklós Herdon 2 Abstract. Over the past several years, a number of multi-stakeholder collaborations have succeeded in developing common understanding with regards to what kinds of capabilities are demanded by large organizations to be competitive in today's global and IT-enabled economy. At a national level, especially effective multi-stakeholder collaborations are in developing the e-competence Framework. In order to synchronize e-skills in the EU and implement the recommendations of the European e-skills Forum, the European Commission supported the development of the European e-competence Framework (e-cf) in coordination with a wide variety of ICT stakeholders. The aim of the framework is to establish a common understanding for ICT competences in Europe. It articulates the knowledge, skills and competence as needed and applied in the ICT workplace that can be used by ICT user and supply companies, the public sector, educational and social partners in Europe. In connection with EQF we are taking part a Lifelong Learning Transversal Program with 9 partners, which deals with definition of EQF for the Agricultural sector. The name of this project is: Implement Agriculture Qualification (ImpAQ). This is not easy task, because the agriculture includes several sectors. Keywords: e-competences, ICT, EQF, ImpAQ, e-skills gap 1. Introduction Demand from a range of organizations including both from firms that provide ICT services and from those who do not, from non-profit and from public sector organizations for ICT professionals is growing and becoming more diverse for two broad reasons. A greater number of organizations are using ICT to support an increasing percentage of operational processes, products, and services in large part because costs for ICT and ICT services have decreased, ICT vendors have made better and more relevant products and services, and as more organizations use ICT the network value of ICT has increased. As ICT becomes more integral to how an organization functions, organizations are discovering new strategic uses and roles for ICT professionals, such as managing projects and pursuing synergies across traditionally independent business units (e.g., standardizing technology and integrating data). Consequently, with the growing demand for ICT professionals, there is growing demand for managers with a broad variety of both technical and business capabilities. Today, many organizations are struggling to find e-competent managers. Even before the current economic crisis, companies all over the world were increasingly struggling to hire people who were competent in both information technology and business management. 2. e-competences 2.1. Demand for e-competences Over the past several years, a number of multi-stakeholder collaborations have succeeded in developing common understanding with regards to what kinds of capabilities are demanded by large organizations to be competitive in today's global and IT-enabled economy (Kolding, 2008). Several of these collaborations have identified a range of specific capabilities that go beyond traditional technical ICT operational capabilities and that reflect new roles for ICT in organizations, such as strategic enterprise architecture, systems management, business process mapping, change management, and project portfolio management. 1 University of Debrecen, CAAES varal@agr.unideb.hu 2 University of Debrecen, CAAES, herdon@agr.unideb.hu 101
110 At a national level, examples of especially effective multi-stakeholder collaborations include the Advanced IT Training System (Germany), e-skills UK, and CIGREF (France). At a European level, one of the most relevant multi-stakeholder collaborations is the CEN/ISSS Workgroup on ICT Skills, which includes representatives from industry, academia, and government who have collaborated in developing the e-competence Framework (European Parliament Council. 2008). In addition, some collaborative efforts are now working with other collaborative efforts to ensure their efforts relate to each other Developing e-competent ICT practitioners, managers and entrepreneurs There is a dearth of data on how firms meet their demands for e-competent managers. The only published examples that we found were a few reports that include some e-competences (Lanvin and Passman, 2008) and anecdotes from professional and general business publications. From the data we have thus far collected from interviews with senior ICT managers and news, journal, and web publications, we have found that firms rely on four general sources to meet their demand for e- competent managers: hire new employees from other firms; hire new employees from University; subcontracting or outsourcing employees; and enhancing capabilities of existing employees. Firms we have spoken to invest in all four sources to hedge the risks associated with each. There is also very little data on how firms develop e-competences of existing employees. Generally the firms invest in at least six different opportunities for developing the e-competences of existing employees: in-house training provided by a University; in-house training provided by an external firm; in-house training provided by employees; external business degree programs; external ICT degree programs; external University courses. In practice the e-competence development within a company is organized as a combination of several of these forms The role of Universities in supplying e-competences Universities are providing a wide variety of opportunities for those entering the workforce and from the existing workforce to develop e-competences (Goles et.al., 2007). For those entering the workforce, courses in business and ICT management that can lead to a University degree and courses that may lead to a certificate. For those from the existing workforce, Universities offer the same options that are offered to those entering the workforce and they offer in-house training to companies and advanced degree programs designed to accommodate work hours (Dill, 2010). For those entering the workforce, there are options such as: Degree in ICT Management Joint-degree programs Courses and design labs Certificate courses For those already in the workforce, there are options such as: Masters programs designed to accommodate work hours Executive education - onsite or on-campus; custom or general There are two general types of curricula development efforts to develop attractive content for these educational options. Industry-led efforts represent efforts led by ICT vendors to develop courses and certification exams that academic institutions can offer either for free or by paying a membership fee. For example: the Microsoft Academy is an annual membership program that enables member academic institutions to deliver training on Microsoft technologies and SAP 102
111 University Alliance provides University faculty with tools and resources to teach students about how organizations get value from ERP technology. University-led efforts at developing curricula represent efforts led by Universities that involve Universities, industry and government offices to develop curricula that foster e- competences. For example: IT-Vest (Denmark), CEFRIEL (Italy), IT-Services (Hungary) and the Innovation Value Institute (Ireland) as an example of a curricula development effort that started as industry-led (specifically, Intel) and is now university-led Emerging critical success factors from formal education sector There are four emerging critical success factors. First, developing consensus on definitions of e-competences and developing attractive curricula for fostering e-competences require having third-party organizations that coordinate and mediate the diverse interest of participating stakeholder groups. Second, the most popular courses include professionals who have left industry and joined the academic institute providing the course. Third, curricula were developed into components, to avoid becoming dependent on technological changes. Finally, curricula development efforts are part of a broader, more systemic approach at enhancing e-competences. For example, e-skills UK is coordinating and leading a number of efforts aimed at changing perceptions and building skills throughout the life of learning - from year olds to current professionals. It seems the important progress has been made with regards to a fundamental aspect of effective curricula development: developing common definitions of what key capabilities constitute "ecompetences" definitions that are useful to European universities, policy makers, and organizations that rely on e-competent managers. A next step is to better understand the multiple roles universities currently have in building e-competent managers and to identify different types of effective corresponding curricula. For each type of role and corresponding curricula, we have identified several isolated yet successful multi stakeholder party efforts at developing curricula for building e- competences The e-skills gap was worsening before the crisis; it now is an even greater threat The e-competences can define as technical and managerial capabilities that organizations need to achieve their objectives. E-competences are a subset of e-skills, which the European e-skills Forum (2004) has defined as consisting of three types of skills: ICT user skills: the capabilities required for effective application of ICT systems and devices by the individual. ICT users apply systems as tools in support of their own work, which is, in most cases, not ICT. User skills cover the utilization of common generic software tools and the use of specialized tools supporting business functions within industries other than the ICT industry. ICT practitioner skills: the capabilities required for researching, developing and designing, managing, the producing, consulting, marketing and selling, the integrating, installing and administrating, the maintaining, supporting and service of ICT systems. e-business skills: the capabilities needed to exploit opportunities provided by ICT, notably the Internet, to ensure more efficient and effective performance of different types of organizations, to explore possibilities for new ways of conducting business and organizational processes, and to establish new businesses. In September 2007, the European Commission adopted a policy Communication on e-skills proposing a long-term e-skills agenda and five action lines at European level Shrinking supply Before the current economic crisis, companies all over the world were increasingly struggling to hire people who were competent in both information technology and business management. In Europe, 103

112 the most recent research findings underscore the cost to competitiveness due to shortage of key ICT skills (Bell Canada, 2007). In 2008, IDC estimated a gap of close to 500,000 full time people in the ICT industry in Europe, growing by 8-10% per annum in a steady state scenario. Based on a survey they conducted of 717 European organizations, IDC found that about a third of European organizations had postponed projects due to lack of skills. Postponing projects, they pointed out, could lead to increasing costs, less flexibility, and slower reactions to business change - all of which constrain the competitiveness of European businesses (Kolding, 2008). Research findings from the United States, Canada and international organizations, such as the OECD, illustrate that the shortage of e-competent managers is a world-wide phenomenon. Although demographic factors are partially responsible, but the most significant factor in the decreasing number of qualified ICT professionals was a drop in enrolments in ICT programs in Universities. In Europe, organizations have responded by forming coalitions between companies, Universities, unions, and government organizations (chambers of commerce) to better understand and address the situation. Nowadays, fewer numbers of students are choosing careers in ICT. Two recently published studies one from Europe (Gras-Velazquez et al., 2009) and one from Canada (The Conference Board of Canada 2009), present strikingly similar results from surveys of students from 9 th to 12 th grade students. A minority are interested in ICT careers and few consider ICT jobs as interesting, fun and cool. Both studies also find significant differences between male and female perceptions, with girls even less enthusiastic than boys. They also both find that the decisions of boys and girls are likely influenced by the knowledge and attitudes of their parents, teachers and counsellors. These adults found ICT jobs even less appealing than kids on average Insights from e-competences relevant to other skill shortages in the EU European firms are facing skills shortages across several engineering and science related professions. It seems from the above listed causes that e-competences are critical to global competitiveness (Hegarthy, 2010). To better understand how Europe fared with the rest of the world, and to guide concerted capability-building efforts, we show it on the INSEAD elab Skills Pyramid - a skills pyramid comprising of indicators representing three types of skills: literary and basic skills; occupational skills; and global knowledge economy skills (similar to e-competences). Hungary is 27 th in this rank in the alarming zone, where the global knowledge economy skills is not distinctly better than competing economies. In this paper we focused on ICT professionals, are relevant to strengthening the role of Universities in building e-competences competences that are essential not simply for the ICT sector but also for the growing number of sectors that rely on ICT to compete. Figure 1. The INSEAD elab Skills Pyramid 104
113 3. European competence framework In order to synchronize e-skills in the EU and implement the recommendations of the European e- Skills Forum, the European Commission supported the development of the European e-competence Framework (e-cf) in coordination with a wide variety of ICT stakeholders. The Commission s interest in e-skills comes from an understanding that the future of ICT will impact the competitiveness and innovation within the EU. With this in mind, the framework targeted several EU-wide problems with ICT development including the minimal dialogue between the industry and academic world, the decline in skilled ICT practitioners, ICT illiteracy among users and the general lack of a focused longterm EU e-skills strategy. Stakeholders worked under the umbrella of the European Standardisation Committee (CEN/ISSS workshop on ICT skills). Together they developed the framework with the idea of not only promoting better e-skills among users but also to support the inclusion of ICT skills for employability purposes. The aim of the framework is to establish a common understanding for ICT competences in Europe. It articulates the knowledge, skills and competence as needed and applied in the ICT workplace that can be used by ICT user and supply companies, the public sector, educational and social partners in Europe. In particular, the framework provides a reference point for users in order to develop their general competences and for managers in the industry to use in long-term strategy planning. The framework identified 36 core ICT competences for practitioners and managers regardless of hardware/software components and classified according to five main ICT business areas - planning, building, running, enabling or managing skills - and link directly to the European Qualification Framework. Furthermore, the skills were organised by nine competence areas ranging from support/services to strategy management. These can be used to provide detailed profiling where various competence combinations are involved (see Figure 2.). The framework has been welcomed by a large number of stakeholders and the effort to create a common European understanding of e-competences in the ICT sector according to fast moving developments of the market. As it becomes more universally applied, the framework that was presented at the European e-skills Conference in 2008 in Thessaloniki (Lanvin, 2008), provides a fundamental tool which facilitates development of European curriculum and ICT qualifications and certification development. 4. ImpAQ project Qualifications of agricultural sector in EU have a common base but show significant geographical characteristics, reflected in the composition of the Learning outcomes and hence in their comparability, that could result partly critical. ImpAQ project considers these qualifications by identifying/analyzing the main specific issues to be addressed for relating them to the EQF and providing solutions, according to the best fit criterion. 105
 through")
114 Figure core ICT competences for practitioners and managers Sample Qualifications Inventory describes the qualifications issued in the partner countries, related to the EQF levels (Young, 2010) through the analysis of their Learning outcomes which will help understand what the quota of common Learning outcomes is for the Qualifications comparable at the same level and the quota of specific Learning outcomes related to territorial specific features. Range of issues and scenarios of possible solutions organized on different pillars of analysis: referencing process, quality assurance, recognition of non-formal/informal learning, recognition of credits, etc. The project impact concerns the implementation of EU qualifications comparison in agricultural sector with the Learning outcomes approach to contribute to gain the EQF goals. The increased comparability/portability of qualifications will bear a consistent interpretation/approval across systems, sectors, countries. In a long term the VET actors involved in the certifications could consider these criteria to promote qualifications more and more comparable at EU level. Besides, if the EU Qualifications/Inventory of Agriculture at sectoral level turns out to be the best way to describe comparable qualifications, this process will be started at institutional/eu level. EU citizens also benefit from the project: promotion of students/workers mobility thanks to EU shared qualifications; recognition/validation of informal/nonformal learning. 106
115 ImpAQ aims to compare the Qualifications related to the Agricultural sector, by identifying and analyzing the main issues to be addressed with the purpose of connecting them to the EQF and focusing on the best resolving approaches, following the "best fit" criterion. The project outputs will be developed with the active cooperation of the project target groups (Public bodies and other organizations in charge of EQF at national level, VET/ HE agencies and private research organizations; Agricultural sector associations) and taking into account the agricultural sector features. The project s long term impact will concern both project target groups and beneficiaries, the wide range of entities interested to the EQF and agricultural sector, and the citizens as indirect target group. In detail, the results of the comparison of the EU qualifications of the agricultural sector according the Learning Outcomes approach will produce a pivotal long term impact. Conclusion With the growing demand for ICT professionals, there is growing demand for managers with a broad variety of both technical and business capabilities. Today, many organizations are struggling to find e-competent managers. Even before the current economic crisis, companies all over the world were increasingly struggling to hire people who were competent in both information technology and business management. In order to synchronize e-skills in the EU and implement the recommendations of the European e- Skills Forum, the European Commission supported the development of the European e-competence Framework (e-cf) in coordination with a wide variety of ICT stakeholders. The Commission s interest in e-skills comes from an understanding that the future of ICT will impact the competitiveness and innovation within the EU. The aim of the framework is to establish a common understanding for ICT competences in Europe. It articulates the knowledge, skills and competence as needed and applied in the ICT workplace that can be used by ICT user and supply companies, the public sector, educational and social partners in Europe. In particular, the framework provides a reference point for users in order to develop their general competences and for managers in the industry to use in long-term strategy planning. The framework identified 36 core ICT competences for practitioners and managers regardless of hardware/software components and classified according to five main ICT business areas. We are taking part a Lifelong Learning Transversal Program with 9 partners, which deals with definition of EQF for the Agricultural sector. The name of this project is: Implement Agriculture Qualification (ImpAQ). This is not easy task, because the agriculture includes several sectors. ImpAQ aims to compare the Qualifications related to the Agricultural sector, by identifying and analyzing the main issues to be addressed with the purpose of connecting them to the EQF and focusing on the best resolving approaches following the "best fit" criterion. The project outputs will be developed with the active cooperation of the project target groups (Public bodies and other organizations in charge of EQF at national level, VET/ HE agencies and private research organizations; Agricultural sector associations) and taking into account the agricultural sector features. The project s long term impact will concern both project target groups and beneficiaries, the wide range of entities interested to the EQF and agricultural sector, and the citizens as indirect target group. In detail, the results of the comparison of the EU qualifications of the agricultural sector according the Learning Outcomes approach will produce a pivotal long term impact. References Bell Canada press release «Workforce shortages in the IT sector: Bell establishes coalition to ensure the next generation of IT resources" 4 December
116 Dill D Quality Assurance in Higher Education Practices and Issues. International Encyclopedia of Education, pp Goles, T., Hawk, S. and Kaiser, K.M "Information technology workforce skills: The software and IT services provider perspective." Inf Syst Front. 10: Gras-Velazquez, A., Joyce, A., and Debry, M. (2009). "Women and ICT: Why are girls still not attracted to ICT studies and careers?" White paper developed for European Schoolnet (EUN Partnership AISBL). June Hegarty S Education and the European Union, International Encyclopedia of Education, pp European Parliament Council Recommendation of the European Parliament and of the Council of 23 April 2008, Establishment of the European Qualifications Framework for lifelong learning pp 1-7. Kolding, M "The Demand for e-skills: Assessing the Skills Gap." presentation of IDC research by Associate Vice President, IDC, European SW & Services. Lanvin, B. and Passman, P.S "Building E-skills for the Information Age." in "The Global Information Technology Report : Fostering Innovation through Networked Readiness," S. Dutta and I. Mia (Editors), pp , Palgrave Macmillan, April Lanvin, B "E-skills, competitiveness and employability." Research paper presented at the EU Conference on E-skills (Thessaloniki, October 2008) based on research conducted in collaboration with Microsoft and the European Union. The Conference Board of Canada "Connecting students to tomorrow's ICT jobs and careers: A pan Canadian dialogue with grade nine and ten students, parents, and secondary school guidance/career counsellors." report prepared by The Conference Board of Canada for Bell Canada Inc. and Canadian Coalition for Tomorrow s ICT Skills. May 8, Young M Qualifications Frameworks and their Role in the Reform of Education and Training. International Encyclopedia of Education, pp
117 New Information Technology Possibilities in the Agriculture Róbert Szilágyi 1 Abstract. The new ICT technologies are not only fast developed but, in addition, are giving birth to newer ICT systems and tools. The Internet network have become essential communication tools in business processes recently. Using the Internet by means of mobile appliances increases the possibilities. If we study the business process the expenses, advantages, disadvantages can be seen well. Nowadays these applications are more and more successful in the following areas such as in agriculture, in different parts of food industry, in extension services, precision agriculture, logistics. While studying the use of these new ICT technologies it can be concluded that different types of services offer different possibilities. Mobile systems develop very dynamically both as regards the speed of data transmission and services. The third generation technology (3G) and the wireless network (Wi-Fi) are similar and different in various respects. The new devices like tablets and new services like Cloud Computing have great potential in agriculture. Cloud Computing provides better resource management and effective cost control. However, the business assessment of these technologies must not be done only on the basis of the technology and taken out of its environment randomly since the whole area is very complex. Keywords: ICT in agriculture, mobile devices, agriculture, Cloud Computing 1. Introduction The development of information technology has had a considerable influence on the agriculture of highly industrialised nations as well. There have emerged a number of new industry-specific technologies and applications over the past few years, including the ever-widening agricultural application of mobile communications devices and technologies. Further considerable improvement is expected in the use of the PDA (Personal Digital Assistant), the personal digital assistant and mobile computers (Handheld Computers) recently "renamed" Tablets as well as other mobile devices. Providing high broadband and mobile Internet access for every individual, especially for those living in rural areas (e-rural), is among the first priorities of the European Union s research and development programme for Information Society Technologies (IST). According to researchdevelopmental and application trends, as well as forecasts and expectations, these technologies and services are to become widely applied tools in enhancing business innovations and supporting business management. The focus of this research was those Internet applications based on mobile devices and the assessment of their effects on agriculture. Due to the fact that the development of applications and user applications require wide-ranging condition and effect systems, the investigation of several condition and effect mechanisms and research tasks were carried out. 2. Background 2.1. Characteristics of the Internet The characteristics of the Internet, in comparison with common communication channels, e.g. fax, telephone, direct communication (face to face), postal services or specialised services for electronic data interchange, can be summarised as follows: speed, consistency, immediate access, lower transaction costs, flexibility, and extensibility (Manecke, Schoensleben 2004) Mobile Internet technology There are two main mobile internet technologies: third-generation mobile (3G) (and the newer ones 3.5G and 4G) and wireless local area networks (WLAN). 3G is a technology for mobile service providers. Mobile services are provided by service providers that own and operate their own wireless networks and sell mobile services to end-users, usually on a monthly subscription basis. Mobile service providers use licensed spectrum to provide wireless telephone coverage over a relatively large, 1 University of Debrecen, Centre for Agricultural and Applied Economic Sciences szilagyir@agr.unideb.hu 109
118 contiguous, geographic serving area. To support this service, mobile operators maintain a network of interconnected and overlapping mobile base stations that hand-off calls as those customers move among adjacent cells. WiFi is the popular name for the wireless Ethernet b standard for WLANs. Wireline local area networks (LANs) emerged in the early 1980s, as a way to allow collections of PCs, terminals, and other distributed computing devices to share resources and peripherals, such as printers, access servers or shared storage devices. One of the most popular LAN technologies was the Ethernet. Over the years, the IEEE has approved a succession of Ethernet standards to support higher capacity LANs over a diverse array of media. The x family of Ethernet standards are for wireless LANs Impact of information technology The effects of IT can be divided into two groups: tangible and intangible effects. (Table 1). Table 1. Benefits of IT Tangible benefits Intangible Benefits Reduced cost Improved customer service quality Improved productivity Improved organizational efficiency Increased market share Quicker response to customers Savings in labour Deeper knowledge and Increased consumer surplus understanding of customers Improved decision-making ability 2.4. Providing information Management in agriculture is to a large extent the ability to make decisions under uncertainty, the latter being accumulated from three main sources (Thysen 2000): uncertainty due to lack of data about the current state of nature; uncertainty due to incomplete knowledge about the biological and physical systems and uncertainty due to inherently random processes. The farmers' use of IT must be looked upon from the point of view of farm economics. The majority of farmers will only use IT if they consider this to be economically beneficial. There are, however, reasons to believe that the economical value of IT in farming is increasing, which, eventually, will lead to a higher uptake of the technology. The main reason to expect a higher value of IT is the public concern about agriculture's negative impacts on the environment and the widespread fears concerning food safety. These consumer concerns are causing governments and primarily the food industry to enforce restrictions on the use of assumed harmful chemicals and, secondly, to demand a precise documentation of the primary production process. The general trend for hardware, software, as well as connectivity, is more value for less money Economic effects and innovation factors The studies on the innovation factors of the devices and of the application of mobile communication can be summarized as follows. None of the measurable and non-measurable advantages of IT can be left out as they have to be analysed within a complex system. As regards the trio of data, information and knowledge, it is knowledge and the demand for and ability to transfer knowledge that stands out. The importance to manage and transfer knowledge can be realised quickly and effectively through mobile technology. Economic and social trends, as well as technological opportunities, create a contiguous system. The relevant social groups of mobile communication (producers, civic groups, companies, consumers, workers) and the relationships between them are crucial factors. The ever increasing spread of mobile communication (and within it, the spread of the Internet) is an obvious development. 110
119 Innovation, adaptation and diffusion are influenced by several factors. The costs related to the environment (economic, cultural influences) and knowledge transfer are crucial factors. The modellike interpretation of a technology s usefulness illustrates the link between practical use, social acceptance and the subjective feeling of usefulness. The technological life cycle must not be forgotten either. The correct identification and interpretation of the current stage in the life cycle will define the future position of the technology. The relationship between the profitability of a company and the existence of the Internet has to be studied carefully, since personal and business communications are not clearly separable from each other. The Internet cannot be made use of at each and every stage of the decision making process, but the process itself can be accelerated by using the Internet. Due to the peculiarities of agriculture, mobile technology may become the right answer to the question of how to provide necessary information just in time. The demand for securing information is not a problem of our age only and emerged in earlier decades, but the technical potentials then available could not provide a perfect solution Driving forces for m-communication At present, mobile communication is driven by different factors (Dholakia - Zwick 2004): First, there are social development trends. M-commerce is an application of the Evernet idea; the possibility to be able to communicate privately or for business anytime and anywhere. While traditional communications services address all social layers, the future will bring a growing fragmentation of the market and customer segments. Second, there are transmission technology-related driving factors. Not only will we experience voice transmission of a quality comparable to a fixed line, we will also have mobile access to the Internet and to other Internet Protocol (IP)-based services and applications (Virvou-Alepis 2005). Third, there are economic drivers. Positive network externalities, attractive content, low costs and reasonable prices of the mobile services, substitution possibilities and other factors are contributing substantially to market growth. Based on these driving forces, we expect the mobile environment to be the next market attracting the attention of a large number of diverse and global players. (Buellingen, Woerter 2004) 2.7. Agricultural utilisation potentials In the course of assessing the agricultural applications built on mobile Internet technology, the areas where this technology has already been applied were analysed. The study had a dual objective: on the one hand, an overview of the applications was given and, on the other hand, ideas for new improvements could be obtained. Most of the applications deal with data exchanges, due to which the compatible data format is of crucial importance. Wireless data transfer technologies can be utilised very well in precision management. Indeed, such a form of management cannot even be thought of without the use of wireless technologies. Handling map data required by precision management cannot be solved without wide broadband applications. As regards wireless technologies, it is satellite transmission and WLAN that offer good alternatives. The advantage of satellite data transfer is the coverage of large areas and its disadvantage is that its price is still high. Mobile devices in crop production and horticulture are primarily used for data surveying. The more efficient and instant data recording ability is considered to be the biggest utilisation advantage of Tablets with GPS connection. The most important criterion in agricultural data surveying is simple handling and that the devise should be resistant to wear and tear. There have already been applications prepared for the distant management of irrigation and production. Their greatest advantage is the opportunity to intervene regardless of time and location. Food safety cannot be imagined without tracing. The already available RF-ID (Radio Frequency Identification) technology, coupled with mobile devices, offers an excellent solution for tracing purposes. Pest control can be supported efficiently by using handheld computers. Their application makes it possible to register data in the field and to then download it onto a central PC, to run models necessary for decision-making. The registration and veterinary control of utility animals are tasks 111
120 extending across international borders. The protection of the supply chain and efficient and timely service can be highlighted from among the several advantages such a utlility has. Electronic trading, transportation and logistics also have applications which offer seemingly limitless opportunities. Complex business applications, which primarily serve the flexible access to internal data, must not be overlooked either. The increasing interest in mobile Internet applications is also indicated by the increasing number of EU research projects The drawbacks of mobile devices Software does not integrate well. A desktop s browser can easily integrate a video stream player and call on appropriate applications to handle learning content. The input interface is not user-friendly. Some research and reports indicate that the cellular phone s keypad is not a good interface for keying in text. To key in the alphabet using the 12 keys may be relatively easy with English language text, but the task becomes quite onerous and inconvenient when keying in text in other languages (Churchill - Hedberg 2008). The screen size is sometimes too small. Because cellular phones and even their bigger brothers tablets have such small screens and cannot display much information, mobile web sites usually use a flow-layout to present content. Generally speaking, most synchronous learning systems display an instructor s video stream and lecture notes simultaneously. The battery life is limited. Turning on the backlight of a display panel and execution of the communication module usually consume the most battery resources of cellular phones. However, these two parts are necessaries when learning with mobile devices (Huang et al., 2008) New technology possibilities Certainly education, training and e-services play a very important role for ICT adoption by Agriculture and related areas (Herdon, Lengyel, 2008). Easy access to information, knowledge and e- services is a key factor. Availability of agricultural information, knowledge and services. ICT evolution is well advancing Moore s Law prediction of computer performance indexes. Indeed, these technologies are not only fast developed but, are giving birth to newer ones. These innovations of ICT are not only regenerating traditional sciences, like Agriculture. (Sideridis et al., 2010) To refer to a few examples of these innovations affecting Agriculture and Environmental Sciences: Cloud Computing provides equality in resources management and exploitability. Parallel Computing (Campbell, et al., 2010) brings exponentially increased core processing to low-end computers facilitating the use of huge computer power by small agricultural research units. The use of cloud computing is getting more and more popular in agriculture also (Hori et al. 2010). The GPS (Global Positioning System) and the 3G (Third Generation Network) are also useable in this case. There are two important part in knowledge management 1. Data storage, 2. Data analysis. The five universal values of cloud computing are the following: Reduction of initial costs, Allocation of resources on demand without limit, Maintenance and upgrades performed in the back-end, Easy rapid development including collaboration with other system in the cloud, More possibilities for global service development. The Japanese researchers also propose a platform which is contain in three layers: SaaS layer (Software as a Service), PaaS layer (Platform as a Service), IaaS layer (Infrastructure as a Service) (Hori et al. 2010) 112
121 The recently developed a system called the FARMA platform, the main aim of which is the storage and management of information on various categories of animals (e.g., sheep, cattle and pigs) (Voulodimos et al 2010). The data collection is based on RFID tags and the information can be accessed with mobile devices. The three main subsystems that constitute the system are the central database, the local database and the mobile RFID subsystem. The mobile RFID subsystem comprises a mobile device (a PDA, UMPC or a laptop) and a portable RFID reader/writer attached to the mobile device. During the experimental period, animals responded well to the RFID tags. With the help of this system, more up to date information is collected. One possible enhancement of the platform is the GPS (some mobile devices are indeed already equipped with it), so that individual animals can be located. Researchers highlight several ideas about the mobile internet in the field of agricultural e- government (Ntaliani et al 2010). They say that the existing web services have been adopted for implementing the e-government service as a cost effective and technical interoperable solution, by providing open sources. Mobile farm equipment featuring different sensors is able to collect a large amount of data while working (Steinberger et al 2009). Automated process-data acquisition can be the basis for informationsteered agricultural production. Unfortunately, the use of these data is restricted by hardware and software compatibility, different data formats, the lack of a concept for reusing data and the amount of data. Using tools for automated treatment and storage, mobile farm equipment becomes an important source of knowledge for information-steered plant production. Current and exact data are important on a farm. The on-farm sensor networks provide remote, realtime monitoring of important farming operations. The network is based on a 900Mhz network. The power supply consists of solar panels (which are unusable in cloudy weather conditions) (Pierce Elliott 2008). 3. Conclusion In surveying the studies it was concluded that the technological trends clearly indicated the everwidening spread of the new ICT technologies. Studies of the situation with mobile communication and the new ICT technologies revealed that the international trends show the possibilities of these. The mobile devices indicates that both the interest and the potential volume of users are available in agriculture and every chance is there to exploit the opportunity for growth. As regards the devices themselves, they can be said to have increasingly more functions; a development which is ensured by the high level of integration. The wider than earlier application and innovative spread of the wired and the Mobile Internet are primarily limited by economic and social factors, and the lag of the country is basically brought about by these two factors. The study of the technical and economic interpretation of the mobile Internet points towards an area that may become the basis for future research. In order to exploit the opportunities inherent in the technology, even services working on a market basis may be developed through the involvement of developers from the outside world. References Buellingen F., Woerter M. (2004): Development perspectives, firm strategies and applications in mobile commerce, Journal of Business Research No.57, p.p. Campbell, C., Johnson, R., Miller, A., Toub, S Parallel Parallel Programming with Microsoft.NET- Design Patterns for Decomposition and Coordination on Multicore Architectures. Microsoft patterns & practices Churchill D., Hedberg J. (2008): Learning object design considerations for small-screen handheld devices, Computers & Education No, p.p. Dholakia N., Zwick D. (2004): Cultural contradictions of the anytime, anywhere economy: reframing communication technology, Telematics and Informatics No.21, p.p. 113
122 Herdon M., Lengyel P. (2008): E-Learning course development in Moodle. Journal of EcoAgroTurism. Transilvania University of Brasov. ISSN X p.p. Hori M., Kawashima E., Yamazaki T. (2010): Application of Cloud Computing to Agriculture and Prospects in Other Fields, Fujitsu Science Technology Journal, Vol. 46. No p.p. Huang, Y.-M. et al., (2008): Toward interactive mobile synchronous learning, Computers & Education Manecke N., Schoensleben P Cost and benefit of Internet-based support of business processes, International Journal of Production Economics No.87, p.p. Ntaliani M., Costopoulou C., Karetsos S., Tambouris E., Tarabanis K. (2010): Agricultural e-government services: An implementation framework and case study, Computers and Electronics in Agriculture No p.p. Pierce F.J., Elliott T.V. (2008): Regional and on-farm wireless sensor networks for agricultural systems in Eastern Washington, Computers and electronics in agriculture No 61, 32 43p.p. Sideridis A. B., Koukouli M., Antonopoulou E. (2010): ICT and farmers: lessons learned and future developments, Agricultural Informatics (2010) Vol. 1, No. 2, p.p. Thysen I. (2000): Agriculture in the Information Society, AgEng 2000, 2-7 July 2000, ( ) Virvou M., Alepis E. (2005): Mobile educational features in authoring tools for personalised tutoring, Computers & Education No 44, p.p. Voulodimos A.S., Patrikakis C.Z., Sideridis A.B., Ntafis V.A., Xylouri E.M. (2010): A complete farm management system based on animal identification using RFID technology Computers and Electronics in Agriculture No 70, p.p. 114
123 Economic condition and labour market characteristics of IT sector Imola Cseh Papp 1 - Tünde Csapóné Riskó 2 Abstract. The study introduces the economic and labour market condition of IT sector on the basis of available relevant literature at both national and international level and in comparison. In this context special emphasis has been laid on the introduction of the current status and development opportunities of IT sector and labour market situation of the relevant professionals. The basis of the research work was to find answers to two assumptions. The first assumption: IT sector has been distressed by the economic crisis less than the average and recovers more rapidly from the shock than the other sectors, hereby the demand for IT professionals will increase dynamically the answer is not unambiguous. The second assumption: IT qualification provides better career opportunities than an average higher education degree has been proved unambiguously. Keywords: economic crisis, labour market, IT, economic condition 1. Introduction Due to the economic crisis, economic growth has been slowed down globally and influenced employment negatively. Unfortunately the indices of Hungary are among the worst ones in this context. It is well know that IT sector is one of the best thriving sectors and IT professional are pretty much called in the labour market. When analysing the situation of the IT sector it has been assumed that this sector has been distressed by the economic crisis less than the average and would start recovering earlier than the other sectors. It has also been assumed that IT qualification provides better career opportunities for employees than an average higher education degree. 2. World economic situation of IT sector Citing the data of Gartner, Kristóf (2009) describes the market and emphasises that in 2009 the value of the sold safety software was 14,5 billion USD that means 8% increase in comparison with year He also emphasises that it is not sure that this trend happened against the economic crisis, but maybe on the contrary, in hard economic situation there is a bigger debauchery for criminality so thus for phishing, thus more attention has to be paid to the protection of own property. On the basis of the article market researchers expected 13% increase for 2010, that is 16,3 billion USD. Global Market Information Database (GMID) calculates with increase similarly. On the basis of the GMID, from 2000 to 2009 the number of Internet users increased by more than 4,5-fold in the world and by 2020 another 75% increase can be expected. Taking Europe as an example, the number of PC users from 2000 to 2009 increased by more than 2,5-fold, and by 2020 another 34% increase can be expected. On the basis of the database, that there was a considerable decrease (-2,5%) in the sale of PCs, but the prognosis shows dynamic increase for the forthcoming years. For the period the highest increase is expected in the area of PC sale among the retail areas (13,7% and 9,7%). At the same time, referring to the OECD s report, the Business Online writes that in 2009 the decrease in the IT sector was 6%. The reason for that is governments and companies in the economic crisis and due to its effects reduce their IT expenditures, there will be hardly any new investments, the previous dynamism of the market will not return (Mártonffy, 2010 a). This 6% decrease, comparing it to the changes of the European Union s and United States GDP between 2008 and 2009, shows the following: GDP of the EU decreased by 6,4% that is higher than the IT expenditures, however the GDP of the USA increased by 2,8% (source: Eurostat). That means that the decrease in the IT sector was lower than in the other sectors of the economy. 1 Associate Professor, Szent István University, Faculty of Economics and Social Sciences, Department for Labour Economics, 2 Assistant Professor, Budapest Business School, Faculty of Commerce, Catering and Tourism, Institute of Commerce, Budapest, Hungary 115
124 On the basis of a survey carried out for 52 countries responsible for 98% of IT expenditures, expenditures will increase by 3,3% yearly in the forthcoming four years, thus by 2013 it will reach 2,8% of the GDP, that is billion USD. This improvement is higher than the expected yearly level of GDP growth in the surveyed 52 countries. Due to the acceleration, the number of IT employees will grow from 35,6 million to 41,1 million, that means 15% increase in employment. This increase is three times higher than in the other sectors. There is another opinion saying that there is a lack in professionals in the IT sector, emphasising that while the sector is rapidly improving, the demand is decreasing and education cannot keep up with this acceleration. This can lead to serious lack of professionals in the future. This lack in professionals will considerably worsen the competitiveness of the EU. On the basis of the data (MTI, 2010), in spite of the economic crisis and the related high ratio of unemployment, IT vacancies has not been filled in Germany. The result of the survey of TechAmerica Foundation is opposite, it says that since January 2009, workplaces has been lost in IT sector. It introduces the results of a survey made with the IT leaders of companies employing at least 100 persons each, saying that the labour market demand for IT professionals will start increasing only slowly (Thibodeau, 2010). The above assumption has not been proved and has not been disproved, since the related literatures are conflicting. 3. The effect of IT qualification on the labour market opportunities of employees The second assumption: IT qualification provides better labour market opportunities for employees than an average higher education degree. This assumption requires two different approaches: does the chance of unemployment decrease with an IT degree and can higher salary expected with such a degree. Raymond R. Panko (2008) shows the unemployment rate of IT occupations between 2000 and 2007 together with all occupations in his study. Data shows that the unemployment rate in IT sector is 1-2,5% lower than the unemployment rate of the entire labour market. Figure 1. Unemployment in the IT and all sectors Source: (Raymond R. Panko, 2008) Data concerning salaries available in IT sector are based on the article of Schneider, I. and Kaminsky, L. published in January 2010 in Wall Street Technology. In this article average yearly salaries can be found for 17 IT professions concerning the USA. Data show that the weekly average salary of employees with the highest degree is USD, that means USD yearly salary on the level of the national economy. The salary of 12 IT professions out of the listed 17 is higher than the one mentioned above, so it is true for 12 IT professions out of 17 that the salary opportunities are better than the average salary in positions requiring the highest degrees (Schneider, Kaminsky, 2010). System Architects have the highest salary, their average salary is about 67% higher than the average salary of employees with highest degrees. They are followed by Architects then Project leaders. The salary of General ITs and Telecommunication specialists are the same as the salary of 116
125 employees with college degrees in general. The lowest salary can be found at the Helpdesk position within IT, this salary is slightly lower than the salary of an average employee with college degree and considerably lower than the salary of employees belonging to other higher education degree categories. The preliminary assumption concerning IT salaries has been supported by the data collected for the most marketable professions on the career orientation website: Although IT regarding the vendibility of entrants was only the third in the USA after health care and business world, starting salaries proved to be the highest here: the average yearly salary of an entrant IT professional is USD, while the yearly salary of an entrant economist is USD. On the basis of the above data it has been proved that IT qualification really considerably improves labour market opportunities, better than an average degree. 4. Economic condition of IT sector in Hungary It is assumed that national trends in IT sector and labour market correspond with the international trends. Result of the joint survey of International Data Corporation (IDC) Market Research and Microsoft covering 52 countries including Hungary shows that IT expenditures are expected to grow by 2,9% yearly between 2008 and 2013 contrary with the expected 0,6% GDP growth. This increase in the demand will establish expectedly new work places in IT sector and companies using IT, that means 1,9% increase in IT employment yearly (IT café, 2009). A leading consultant specialised in IT sector has the same opinion, saying that IT sector has been considerably increasing. Among the reasons of this increase he mentions that companies willingly outsource such kinds of activities to Hungary since they can find high quality professionals at a reasonable price here and due to the economic crisis banks shifted from according credit to product development that requires IT developments (Mártonffy, 2010b). The experience of the acting manager of Dell Ltd. is totally different (Mártonffy, 2009), he says, that after some slight decreases, there was a considerable decrease in the middle-end of January 2009 in the national IT sector. After a single decrease, the decrease stopped and business stabilized at a lower level. This decrease affected mainly the public sector. In case of companies the ratio of fix contracts signed in advance is high and they do not postpone year by year their IT investments says the interview. Survey of Corvinus University on the situation of the national IT sector has come to analogue result. They investigated the status of IT at 65 national companies (60% large scale, 40% small and medium sized companies) (Fehér, 2010). 78% of the surveyed 65 companies reduced its IT expenditures in IT budgets decreased by 11,3% altogether on the average. These data unambiguously indicates that the economic crisis reached the national IT sector in The picture is somewhat better in 2010: in this year only 59% of the surveyed companies reduced their IT expenditures. The average decrease in 2010 was accordingly only 4%, in spite of the fact that the ratio of companies increasing their IT expenditures decreased slightly to 18%. Although the decrease in the setback can be seen unambiguously from the data, it should not be forgotten that this decrease realised from the already decreased level of 2009, so in 2010 the situation slightly further worsened. Comparing the ratio of IT expenditures to the revenues in the long run, the situation seems to be much better. IT expenditures compared to revenues in case of the surveyed 65 companies decreased only to the level of 2006, which is due to the dynamic improvement till 2007/2008 is still higher by 37-57% than the level in As regards the national situation of IT sector, one more fact has to be pointed out: the IT competitiveness index that shows how the environment of the IT sector - including the general business environment, human resource development, foreign investment policy of the country, legal environment supports the competitiveness of the sector in a specific country. The highest point to be reached is 100, from which Hungary reached 46,1. With this point it is the 28th among the surveyed countries. Estonia and the Czech Republic can be found on the 23rd and 26th places, while Slovenia 117
126 and Lithuania on the 29th and 31st places (Anonymus, 2009b). Considering the improvement of the competitiveness index, the article introduces further results of the Economist Intelligence Unit s research and recommendations of BSA (Anonymus, 2009c): introducing and spreading broadband networks as soon as possible; company culture supporting innovation; knowledge development; technology development funding not infringing equal competition conditions of market players; legal system protecting intellectual property. On the basis of the references, the present economic situation of the national IT sector is contradictionary, similarly to the international situation. 5. Effects of IT qualification on labour market opportunities in Hungary It has been assumed that the situation would be the same in Hungary just like in the international dimension, that IT qualification can help avoiding unemployment so thus getting employed better than a general higher education degree. The national human resource management survey of ÁFSZ carried out for the first quarter of 2010 shows that the employment expansion was above the average in the following areas: IT and communication, administrative services, public administration, agriculture, building industry, energy industry, water and waste management, scientific and technological areas, production of metal row materials and metal processing products. The most demanded professions were: mechanical engineer, electrical engineer, chemical engineer, environmental engineer, IT specialist and accountant (Hvg.hu, 2010). Informatics has been developing so rapidly hat IT specialists should learn new technologies in every second-third month on the average. Besides that, good command of English is also very important (Takács, 2010a). Because of all these, only half of the currently employed IT specialists posses up-to-date skills in Hungary. The conclusion (Takács, 2010b) such as IT profession is among the first three most demanded occupations is analogue to the above mentioned facts job offers are included in the database, most of them for engineers (521), it is followed by IT offers (456) and then offers for accountants (421). The survey of Monster for the first quarter of 2010 also mentions IT among the 10 occupations most difficult to fill in Hungary. In their survey they asked 753 companies. IT specialists are the 7th on the list, only skilled labours, engineers, drivers, machine operators, maintenance, physicians and other non-nursing health care staff are preceding them (Monster, 2010). Joint research of the ITJOBS and JOBSgarden in 2010 shows the following salaries for some IT occupations for Budapest. Comparing the salaries in the middle of the salary data interval with the salaries available for and year old employees with university degree it turns out that the salary available for IT seniors mainly exceeds the average salary available for university degree holders at the top of their career; the salaries of IT entrants or positions requiring only a couple of years of experience also exceeds the similar categories (entrant, couple of years of experience) available for university degree holders. The only exception is helpdesk (similarly to the international situation), where the salaries are lower than the average salaries of university degree holders. In case of entrants there are only slight differences, the salary of entrant IT specialists is only slightly higher than entrants with general university degrees. After acquiring the necessary work experience, the salary of an IT specialist can be 1,5-2 times higher than the salary of a university degree holder. The salary of SAP consultants is the highest, their salary is more than 2 times higher than the salary of an average university degree holder at the top of his career. 118
127 Table 1. Salaries for some IT positions Position Experience Salary (Gross/HUF + Allowances) Help Desk First Level 0-1,5 years HUF Help Desk Second Level 2-4 years HUF SAP Consultant (Employed) 2-3 years HUF HUF SAP Consultant (Freelancer) generally from 4 years HUF + VAT (perdiem) Abroad: EUR (depending on module) Project Manager 3-5 years HUF Developer (C,C++, C#, Java) 1-2,5 years HUF Windows System Administrator HUF HUF Windows System Engineer HUF Unix System Administrator HUF Unix System Engineer HUF Database Administrator (Oracle, MS SQL) 1-3 years HUF 4- years HUF Source: (ITJOBS and JOBSgarden, 2010) The second best paid position is the project manager with 3-5 years of work experience, it is followed by the UNIX system engineer and database administrator position with the same salary. It has been proved through the investigation that the situation is the same in Hungary just like abroad, labour market value of IT qualification is higher than an average higher education degree. 6. Summary, Conclusions As regards the first assumption, it is difficult to answer in what extent the economic crisis affected IT sector on both national and international level because of the different opinions. The following conclusions can be drawn carefully: Due to the heterogeneity of IT sector it has been affected by the economic crisis rather differently. Due to the economic crisis development of IT sector has slowed down although it is not unambiguous in what extent. Development of IT starts after the economic crisis, although it is questionable that the dynamism of the development will reach or not the level before the economic crisis. The second assumption proved to be correct. Although training programs on the supply side of the labour market do not match properly the demand, after all the labour market and salary opportunities are considerably better with a higher education degree, especially with IT qualification. High IT salaries also indicate that IT qualification is appreciated in the labour market. 119
128 References Anonymus (2009b.): Magyarország továbbra is 28. a globális IT iparági versenyképességi listán, 20 September 2009, Downloaded: Anonymus, (2009c.): Leaders: Has Europe got the answer?; Battling joblessness, The Economist. London: Nov 7, Vol. 393, Iss. 8656; pg. 16, ABI/Inform Global database Eurostat database, Data downloaded: 1-12 December Fehér, P. (2010.): Az informatika helyzete Válságos évek, utatás% pdf, Downloaded: 17 December FISZ Pályaorientációs oldal (2010): A legpiacképesebb diplomák 2010-ben, , Downloaded: 17 December GMID - Global Market Information Database Data downloaded: 27 November 4 December Hvg.hu (2010.): A legpiacképesebb diplomák 2010-ben, 3 June 2010, Downloaded: , Downloaded: 17 December ITJOBS and Downloaded: 17 December Kristóf, Cs. (2009.): Jól tartja magát a biztonsági piac, Computerworld, 8 October 2009, Downloaded: 17 December Mártonffy, A. (2009.): Hullámvasúton az IT ipar, business online, 28 April 2009, Downloaded: 17 December Mártonffy, A. (2010a): Lassan javulnak az IT-ipar kilátásai, Business Online, 23 November 2010, Downloaded: 17 December Mártonffy, A. 18 November 2010, Downloaded: 17 December May , Downloaded: 17 December 2010 MTI (2010): Informatikai tudáshiány elé néz Európa, hvg.hu, 3 March 2010, Downloaded: 17 December /2010. tanévben, Útravaló Ösztöndíjprogram Downloaded: 17 December Panko, R.R. (2008): IT employment prospects: beyond the dotcom bubble, European Journal of Information Systems (2008) 17, & 2008 Operational Research Society Ltd., ABI/Inform Global database Schneider, I., - Kaminsky, L. (2010.): IT salary survey, Wall Street Technology, 7 June 2010, Downloaded: 17 December 2010., O. (2009): Gyógyírt hozó iparág, Piac & Profit 2009/12, Downloaded: 17 December Takács, G. (2010a.): Kiket keresnek az álláspiacon?, Pályacsúcs Magazin, 5 November 2010, Downloaded: 17 December
129 Takács, G. ( January 2010, tanacsok.monster.hu/allaskeresesi-strategia/iparagi-trendek/mernok-informatikus-konyvelo-topon- 2010/article.aspx, Downloaded: 17 December Thibodeau, P. (2010): CIOs Say They're Hiring Again, Computerworld, Framingham: Sep 27, Vol. 44, Iss. 18; pg. 6, 1 pgs, ABI/Inform Global database 121
130 A talajvízállás, a csapadék és a felszíni vízállás kapcsolatának vizsgálata a Nyírségben 1 Abstract. First time we execute the examination of long-term ground-water trends, types of ground-water oscillations. A series of ground-water maps on the Nyírség region is created: highest level ever, lowest level ever measured, 10 year averages, average of long-term minimums, average of long-term maximums, oscillation of ground-water levels calculated both on altitude above sea level and on depth measured from surface. In the next phase of our examination we investigate the connection between precipitation, surface water levels and groundwater levels, determining which factor from among the aforementioned 2 has greater influence on the latter at certain terrain types using the methods of mathematical statistics and GIS. Keywords: ground water-level, precipitation, surface water-level, Nyírség region, factor and cluster analysis, Sustainability Index Model 1. Bevezetés Túri Zoltán, Demeter Gábor A talajdegradáció komoly környezeti probléma, amelynek egyik oka, súlyosbító tényezője az emberi tevékenység. Az Európai Környezetvédelmi Ügynökség (EEA) szerint 42 millió ha-t fenyeget az EU-ban a szélerózió, a földterületek 12%-át a vízerózió. A PESERA (Pan-European Soil Erosion Risk Assessment) alapján az EU-ban 54 millió ha területen következhet be évi 1 10 tonna, a földterületek 25%- án pedig 0,5 1 t/ha talajveszteség. A helytelen mezőgazdasági és erdőgazdálkodási módszerek alkalmazása, az ipari tevékenység, a turizmus és a burkolt területek arányának növekedése a Nyírségben is komoly problémát jelent, miközben e térség egyébként sem a legjobb minőségű talajokkal bír, ugyanakkor jelentős népességet tart el. A talajromlás akadályozza, hogy a talaj ellássa funkcióit az ember és az ökológiai rendszerek számára. Ennek következménye a talaj termékenységének, humusztartalmának és biológiai sokféleségének a csökkenése, a kisebb vízkapacitás, a tápanyagkörforgás megszakadása és a szennyezőanyagok lassúbb lebomlása. Mindennek határon átnyúló hatásai is vannak. A felszíni vizekbe mosódó műtrágya és peszticid szennyezőként jelentkezik. Egy 2008-ban induló projektben vállaltuk, hogy az EU irányelvek alapján elkészítjük a Nyírség és a Bihar-hegység fenntartható talajvédelmi stratégiáját. A stratégia kidolgozása felöleli a szél- és vízerózió, talajtömörödés, (mű)trágyázás, vízháztartás megváltozása okozta talajdegradáció vizsgálatát, a szervesanyag-gazdálkodás és a különböző használati módok hatását, a talajjavítás lehetőségeinek (bentonit, szennyvíziszap, biogáz) bemutatását. (Jelen tanulmány a projekt egyik altémájának kutatási eredményeit mutatja be.) Célkitűzéseink között szerepel egy egyszerű többváltozós rendszer az ún. Fenntarthatósági Index Model (Sustainability Index Model) kidolgozása, mely alkalmas a talajok állapotának és értékének minősítésére, különböző természeti-adminisztratív határok és eltérő területhasználat esetén is lehetővé téve a földrészletek összehasonlítását, a mezőgazdasági területek komplex többváltozós minősítését. Szeretnénk kiemelni, hogy az EU-ban nem készült még ilyen vizsgálat hasonló módszertannal, ilyen nagy területre, noha a talajvédelmi stratégia ezt előírná. Másrészt hangsúlyt fektetünk az alapadatokból olyan statisztikai mutatók, a talajvizet, csapadékot és felszíni vizeket reprezentáló változók kinyerésére és területi sajátosságainak bemutatására, melyek a későbbiek során egy függetlenségvizsgálatnak alávetve a SIM bemenő, egész területre interpolált mutatóit jeleníthetik meg. Úgy alakítjuk ki őket, hogy más (pl. mezőgazdasági és természetföldrajzi) változókkal együtt 25 ha-os alapegységenként vizuálisan megjeleníthetők és adatbázisból lekérdezhetők, összevethetők legyenek. Ez nemcsak a mezőgazdasági területek értékelése, minősítése szempontjából fontos, hanem a támogatási rendszer kialakításához, a döntéshozatalhoz is segítséget jelent. 1 A tanulmány megírását A Bihar-hegység és a Nyírség talajvédelmi stratégiájának kidolgozása az EU direktívák alapján (HURO/0901/2.2.3/135.) c. pályázat támogatta

131 Agrárinformatika 2011 Konferencia / Agricultural Informatics 2011 Conference 2. Anyag és módszer A célok megvalósításához összegyűjtöttük a középtáj területére eső hidrometeorológiai állomások és talajvízkutak közötti, továbbá a felszíni vízmércék közötti észlelési idősorait. Az adatbázisba rendezett adatokat egységes kiértékelési szempontok szerint többváltozós statisztikai és térinformatikai módszerekkel dolgoztuk fel, kartogramokon és diagramokon ábrázoltuk. 1. ábra. A hidrológiai, hidrometeorológiai törzshálózat vizsgált észlelőállomásai a Nyírségben (a FETIKÖVIZIG és a TIKÖVIZIG adatai alapján) A mintavételi pontok csökkenését, ill. ritkítását eredményezte: 1. a kapcsolatrendszer feltárása érdekében (a korrelációs vizsgálatok miatt) hosszú és azonos időintervallumra vonatkozó adatokkal kellett 2 123
132 dolgoznunk, 2. a vizuális megjelenítéshez egyenletes eloszlású ponthalmazra volt szükségünk. Utóbbi esetében a nem egyforma adatsűrűség a regionális kép kialakításában zavart okoz és torzulásokhoz vezet. A kapcsolatrendszer és térszerveződés elemeinek bemutatását korrelációs vizsgálatok, faktoranalízis és klaszteranalízis segítségével végeztük el. Ehhez az adatok normáleloszlása biztosított volt. A korrelációs vizsgálatoknál vizsgáltuk a rendszerelemeken belüli (pl. talajvíz-talajvíz) kapcsolatrendszer erősségét és a rendszerelemek közötti korrelációt (pl. talajvíz-csapadék). A faktor- és klaszteranalízissel a Nyírségen belül az egyes rendszerelemek hasonlóságát és térszerveződését (pl. a hasonló jellegű talajvízállások egymás szomszédságában fordulnak elő, vagy nem) vizsgáltuk. Végül kísérletet tettünk annak meghatározására, hogy a talajvízállást a csapadék, vagy a felszíni vízállás befolyásolja-e jobban. A talajvízadatokból nyert alap- és derivált változók a projekt egy további részében a SIM-ben történő alkalmazhatóság érdekében függetlenség-vizsgálaton esnek át, így egy részük szelektálódik. Ennek ellenére igyekeztünk olyan változókat létrehozni, melyeket vagy alkalmaznak jelenleg is, vagy önálló tartalommal bírnak. A következő változók mérésére került sor: évi közepes vízszintek átlaga; éves közepes vízszintek 1980 előtti átlaga (és 1990 előtti átlaga); éves közepes vízszintek 1980 utáni átlaga (és 1990 utáni átlaga); az 1980 (1990) előtti és utáni átlagok különbsége; az 1980 (1990) utáni átlag és a teljes átlag különbsége; a valaha mért havi maximális talajvízállás; az éves közepes vízállások maximuma; az éves közepes vízállásokból számolt minimális talajvízállás; a kettő különbségéből számolt ingadozás; az éves közepes vízállások szórása; az éves közepes vízállások eloszlásának csúcsossága. A 29 hidrometeorológiai állomás esetén az elemzésbe a következő változókat vontuk be: a csapadék átlaga; a csapadék átlaga 1990 óta; a kettő különbsége; az átlag és az 1980 utáni átlag különbsége; az éves átlagok szórása, csúcsossága; az 1950 óta mért minimum; az 1980 óta mért minimum; az utóbbi kettő különbsége; az átlagosnál kisebb éves csapadék relatív gyakorisága. A felszíni vízmércék idősoraiból származtatott változók: évi közepes, minimum, maximum vízállás és vízhozam; éves lefolyás és vízhozam; az közötti és az 1990 utáni vízállás átlagok különbségei; az közötti és az 1990 utáni vízhozam átlagok különbségei. A mintavételi pontok elhelyezkedését és a mintaterületet az 1. ábra mutatja be. A helyesebb interpoláció miatt néhány, a mintaterületen kívül eső mérőpontot is bevontunk a vizsgálatba. A térképi bemutatáshoz ArcGIS, a statisztikai elemzésekhez SPSS szoftvert használtunk. 3. Eredmények 3.1. A felszínközeli állomások közötti kapcsolat vizsgálata A talajvízkutak vízjárása, térszerveződése közötti kapcsolatok feltárása során nem volt célunk a középtájon üzemelő összes törzsállomás bevonása a vizsgálatba, hanem inkább az egyenletes lefedettségre törekedtünk. Így pl. Debrecenből csak 4 talajvízkút adatai kerültek bevitelre. Bár a túl sűrű mintavételezés az adott területen nagy pontosságot jelent, de a mintaterület regionális sajátosságait (ha másutt kisebb a pontsűrűség) nem reprezentálja jól. A 73 állomás korrelációs vizsgálata nem ad átlátható eredményt, ezért más, adatredukciót eredményező eljárások bevonásával érdemes megvizsgálni a kapcsolat erősségét a talajvízkutak vízszint értékei között (faktor- és klaszteranalízis). A faktoranalízis főkomponens-analízissel és varimax rotációval a 73 talajvízkút adatsorát 9 ősváltozóra vezette vissza, melyek az adatszerkezet (variancia) 83%-át tartalmazták. A faktoranalízis célja esetünkben a mérőállomások típusokba sorolása volt. E besorolás csak a kapcsolat erősségét adja meg, annak milyenségéről, jellegzetességeiről nem ad tájékoztatást. A rotált komponens mátrix alapján azonosítható az egyes mérőállomások besorolása. Az adott mérőállomás abba a faktorba tartozik leginkább, amellyel legerősebb a kapcsolata. A csapadékmérő állomásokkal ellentétben itt jóval több típus figyelhető meg, és az átmeneti kategóriák száma is nagyobb. Azon kutak tartoznak ide, melyek több faktorral is hasonló (közepes) korrelációt mutatnak, vagy éppen egyik faktorral való korrelációjuk sem erős. (A hiányzó adatokat a sorozat átlagával helyettesítettük a vizsgálatban.) A klaszteranalízis segítségével, a Ward-módszerrel kapott ágdiagram is lehetővé teszi a mérőállomások besorolását 2-től n-1-ig terjedő csoportba (n a mérőállomások száma). Miként a faktoranalízisnél, itt is 3 124

133 Agrárinformatika 2011 Konferencia / Agricultural Informatics 2011 Conference kritérium az adatok normáleloszlása, ezt Kolmogorov-Szmirnov-próbával teszteltük, majd az adatokat standardizáltuk. A hiányzó adatokat a sorozat átlagával pótoltuk. Nem vontuk be a vizsgálatba azokat a mérőpontokat, ahonnan az 1950 utáni periódusból 10-nél több adat hiányzott. Az adatok standardizálását állomáson belül végeztük. A klaszteranalízis csak a csoportképzést segíti elő, a csoportok minőségbeli különbségeire nem utal (2. ábra). 2. ábra. A felszínközeli állomások vízjárása alapján képzett klaszterek A talajvízszint változásának jellegét és időbeli sajátosságait tekintve a következő csoportokba sorolhatók az általunk vizsgált talajvízkutak: süllyedő vízszintet mutató talajvízkutak; stagnáló vízszintet mutató talajvízkutak; emelkedő talajvízszinttel jellemezhető talajvízkutak; kis amplitúdójú talajvízszint4 125
134 ingadozással jellemezhető kutak; nagy oszcillációval jellemezhető vízállású talajvízkutak; emelkedő minimumokkal/emelkedő maximumokkal jellemezhető kút; csökkenő minimumokkal/csökkenő maximumokkal jellemezhető kút; a minimumok és a maximumok változási iránya eltér, vagy az egyik stagnál. A ciklicitást mutató talajvízállás lassabban követi a csapadék indukálta változásokat. A vizsgált időszakra eső közötti talajvízszint-emelkedés oka nemcsak az évi extrém csapadék, hanem az azt megelőző két év igen alacsony és szeszélyes területi eloszlású csapadékmennyisége volt (400 mm-es különbség mm-es minimummal). A talajvízszint leginkább a Nyírség központi részén emelkedett meg, míg a csapadéktöbblet ott viszonylag kicsi volt. A talajvíz áramlása emiatt nem jelentett többletterhet a alacsonyabban fekvő területeknek, a nagyobb csapadéktöbblet viszont igen. A korrelációs együttható 0,7 feletti volt ban mérhető egy újabb vízszint-emelkedés, majd 1994 körül egy jelentősebb talajvízszintcsökkenéssel kell számolni, amit megint emelkedés követ. Az utóbbi csökkenés oka is egyértelműen a szárazodó időjárásnak köszönhető, amit a csapadékadatok is megerősítenek és 1994 között ugyanis elmaradtak a kiugró, 800 mm feletti csapadékmaximumok, csupán 650 mm körül alakult az esősebb évek (3-4 a periódusban) átlaga. Ez a mm-es csapadékhiány az as évek átlagához képest a Nyírség területén mintegy 1 m-es talajvízszint-süllyedést eredményezett, leginkább a Hajdúhát felé eső, részben lösszel fedett részeken és a Középső-Nyírség Ny-i zónájában. A Nyírség déli peremén szintén jelentős csökkenés volt mérhető. Még nagyobb volt a csapadékhiány a medencebelső felé haladva a Hajdúhát területén. Végeredményben tehát éves ciklicitással kell számolnunk a Nyírség területén. Emiatt feltételezzük, hogy a természetes folyamatokat az antropogén hatások nagysága nem múlja felül. Megjegyzésre érdemes, hogy a térségre jellemző hidrológiai folyamatok olykor egymástól távoli kutakban is kimutathatók (pl. az említett kettős maximum 1964 után, vagy a ciklusosság Újléta, Nyírkáta és Nyíregyháza kútjainál). Ez arra utal, hogy a nyírségi változások regionális változások, illetve a Nyírség a talajvíz sajátosságait tekintve is lehatárolható, homogén működéssel jellemezhető entitás A csapadékmérő állomások közötti kapcsolat vizsgálata Általánosságban érvényes, hogy a Nyírség mint táj viszonylag homogén csapadékeloszlással jellemezhető, és az egyes állomások jellegzetességei sem térnek el jelentősen egymástól. Ezt az állomások éves átlagai közötti korrelációs vizsgálatok is megerősítik. A csapadék maximuma június-júliusra, minimuma októberre és márciusra tehető, az egyes állomások között csak az eloszlás csúcsossága és a minimum mélysége, illetve a maximum szélessége alapján tehető különbség. Megállapítható az is, hogy lokális csapadékmennyiség-növekedéssel éppúgy kell számolni, mint csökkenéssel. Egyes állomásokon a csapadékmennyiség trendszerűen növekszik vagy csökken, hosszú távon stagnálást mutató szintén előfordul. Megfigyelhető a csapadékmennyiség hosszú távú ciklicitása is, mely meglepően egységesen 8 nagyobb és 5-6 kisebb maximumot jelent (3-4 éves ciklusok). A korrelációs mátrix alapján a hidrometeorológiai állomások közötti kapcsolat igen erősnek tekinthető, az r szinte mindenütt elérte a 0,7-et, ami az 50%-os (véletlen) valószínűség határa (csak Létavértes lóg ki a sorból). Ez arra utal, hogy a Nyírség területén a csapadékot és annak közötti eloszlását illetően nincsenek nagy területi különbségek. A faktoranalízis célja esetünkben nem feltétlenül a dimenzióredukció, hanem a mérőállomások típusokba sorolása, ősváltozókra való visszavezetése volt. A faktoranalízis pontosságát megadó KMO- Bartlett teszt értéke 0,888-as volt, azaz a vizsgálat megbízható eredményt ad. A 29 csapadékmérő állomás mindössze 3, főkomponens-analízissel és varimax rotációval kivont faktorba került összevonásra, ami alátámasztja azt a véleményt, hogy a csapadékeloszlást és az közötti csapadékjárást illetően a Nyírség nem mutat nagy változatosságot. A három kialakított faktor az eredeti adatszerkezet 77%-át tartotta meg. A rotált komponens mátrix alapján azonosítható az egyes mérőállomások besorolása. Az adott mérőállomás abba a faktorba tartozik leginkább, amellyel legerősebb a kapcsolata. A csoportképzést és 5 126
. A vizsgálathoz nem a faktorokat használtuk (hiszen ezek száma kicsi), hanem az összes állomás adatait (3. ábra)")
135 annak területi vetületeit vizsgálandó, a klaszteranalízis segítségével, a Ward-módszerrel kapott ágdiagram lehetővé tette a mérőállomások besorolását 2-től n-1-ig terjedő csoportba (n a mérőállomások száma). A vizsgálathoz nem a faktorokat használtuk (hiszen ezek száma kicsi), hanem az összes állomás adatait (3. ábra). 3. ábra. A csapadékmérő állomások klaszterei Miként a faktoranalízisnél, itt is kritérium az adatok normáleloszlása, ezt Kolmogorov-Szmirnovpróbával teszteltük, majd az adatokat standardizáltuk. A hiányzó adatokat a sorozat átlagával pótoltuk. Nem vontuk be a vizsgálatba azokat a mérőpontokat, ahonnan az 1950 utáni periódusból 10-nél több adat hiányzott A felszíni vízállások korrelációs vizsgálata 6 127
136 A felszíni vízállások éves átlagainak korrelációs mátrixa alapján megállapítható, hogy a felszíni vízállás sokkal nagyobb varianciát mutat és a mérőállomások több csoportba sorolhatók, mint a csapadékmérő állomások, azaz a két változó között szoros összefüggés nem mérhető. Egyes felszíni vízmércék egyetlen másikkal sem mutatnak erős kapcsolatot (Szarvassziget, Laskod, stb.), míg Kótaj vagy Nyírpazony adatsora több mérőállomással is korrelál. Érdekes módon az éves maximumok korrelációs mátrixa ettől eltér. A Lónyay-főcsatornán észlelő Demecser legmagasabb vízállásai pl. Kemecse és Kótaj állomásokkal mutatnak hasonlóságot, azaz a vizsgált időszakban a főcsatornán észlelő vízmércék esetében vélhetőleg a Tisza vízállása jobban meghatározta a helyi maximumokat, mint a Nyírség központi vízválasztójától É-ra lefutó kis vízfolyások, csatornák belvízhullámai. A Tisza árvizeinek a vízfolyásból történő kizárására, az árvízvédelmi biztonság növelésére a Lónyay-főcsatorna tiszai torkolatától 2,5 km-re egy torkolati műtárgyat (árvízkaput) építettek között, azóta a folyó vízvisszaduzzasztó hatása lényegében megszűnt (Kató S., 2010). A felszíni vízmércék vízállásainak faktoranalízise során a KMO-Bartlett teszt 0,6-es erősségű volt, a 10 vízmérce három faktorba került besorolásra varimax rotáció és főkomponens-analízis segítségével, mely 3 változó az adatszerkezet varianciájának 70%-át tartalmazta. Az átlagos vízhozam alapján Kemecse és Kótaj egy csoportba került, hiszen azonos vízfolyáshoz tartoznak. Levelek és Laskod ugyan földrajzilag közel esnek egymáshoz, de eltérő vízfolyáson helyezkednek el. Nagykálló, Kántorjánosi és Demecser egy faktorba kerülése meglepő, hiszen földrajzilag távol esnek egymástól. A klaszteranalízis már földrajzilag helyesebb eredményt adott: Laskod, Levelek, valamint Nagykálló, Kántorjánosi és Demecser egymással szomszédos állomásai ugyanazon csoportba nyertek besorolást, Kemecse, Újfehértó és Kótaj szintén. A vízhozam és a vízállás között nem minden esetben egyértelmű a kapcsolat: Nyírpazony és Újfehértó esetében igen, de a legteljesebb adatsorral rendelkező Levelek és Nagykálló esetében az r értéke 0,5 alatt marad. Igaz, ez utóbbinál az első 10 évben még 0,8 feletti volt a kapcsolat erőssége. Emiatt a vízhozam és a vízállás két külön változónak tekinthető. Sajnos a vízhozammérések hiányossága és kis intervalluma miatt nem vethető össze a talajvíz- és csapadékadatokkal. A továbbiakban tehát a vízállás talajvízre gyakorolt hatását fogjuk vizsgálni, a vízhozamét csak a két hiánytalan adatsorú állomás esetében nézzük meg. Érdekes jelenség, hogy pl. Nyírpazony vízállása Újfehértó, Laskod és Nagykálló átlagos vízhozamával is erős kapcsolatot mutat, míg Nagykálló átlagos vízhozamával nem, maximális vízhozamával viszont igen. Mindenképpen figyelembe kell ugyanakkor venni azt a tényt, hogy az adatpárok száma kicsi, így a kapcsolat erőssége kevéssé szignifikáns. Megállapítható, hogy Újfehértó kivételével elég erős korreláció mérhető az egyes mérőpontok átlagos vízhozamai között, ezért vélhetően kevés csoport képződik klaszterbe sorolásukkal. Kiemeltük azokat az egyéb változókat, melyek nem mutatnak erős korrelációt az átlagos vízhozamokkal. Érdekes jelenség, hogy sok esetben a maximális vízhozam vagy az éves lefolyás, esetleg a nagyvíz is erős korrelációt mutat az adott észlelőhely átlagával, sőt más észlelőhelyek átlagával is A talajvízállás, a csapadék és a felszíni vízállás kapcsolata; a felszínközeli észlelőállomások típusai Annak meghatározásához, hogy a talajvízállásra a csapadékmennyiség, vagy a felszíni vízállás hat-e jobban, ún. tripleteket jelöltünk ki. Ezek vízállás, talajvíz és csapadékadatot egyaránt tartalmazó, egymást esetenként átfedő elemi téregységek, melyek korrelációs és regressziós vizsgálatával a fenti tényezők kapcsolatára kerestünk választ. Mivel a középtáj területén csak a Lónyay-főcsatorna vízgyűjtőjén (2087 km 2 ) található vízfolyások törzsmércéin zajlik rendszeres vízállás/vízhozam észlelés, s a vízügyi igazgatóságtól ezeknek a felszíni állomásoknak a napi reggeli észlelési adatait kértük meg, ezért csak a nyírségi vízválasztótól É-ra és Ny-ra eső területeken végeztük el a változók alapján a csoportképzést (4. ábra)


137 4. ábra. A Lónyay-főcsatorna vízgyűjtőjén kijelölt hármas csoportok A hármas csoportok kijelölésénél figyelembe vettük a késleltető hatásmechanizmus szerepét is (a csapadékmennyiség hatása később jelentkezik a talajvíznél, mint a felszíni vizeké), mely az adatsorok egymáshoz való eltolását eredményezheti. A talajvízkutak, felszíni észlelőhelyek és hidrometeorológiai állomások távolsága km-es sugarú körön belül mozgott. A vizsgálat alapját az éves átlagok képezték mindhárom tényező esetében. Ott, ahol folytonos adatsorral rendelkeztünk, a vízállás mellett a vízhozamot is bevontuk a vizsgálatba. 5. ábra. A talajvízkutak típusai: 1. csapadék által meghatározott; 2. felszíni víz által meghatározott; 3. mindkettő által meghatározott; 4. egyik sem gyakorol hatást Egyes talajvízkutak többször, több tripletben is előfordulhatnak, hiszen több felszíni vízállást észlelő állomás, vagy hidrometeorológiai észlelőhely is lehet a közelükben. A korrelációs koefficiensek alapján 8 129
138 eldönthető, hogy az adott talajvízkutat a csapadékmennyiség vagy a felszíni vízállás befolyásolja-e inkább. A korrelációs vizsgálatba bevont 27 felszínközeli észlelőállomásnál a hatótényezők jellege és erőssége alapján a következő főtípusokat különböztettük meg: 1. csapadék által meghatározott; 2. felszíni víz által meghatározott; 3. mindkettő által meghatározott; 4. egyik sem gyakorol hatást (5. ábra). A főtípusok természetesen további altípusokra bonthatók aszerint, hogy egy talajvízkút vízjárása hány, a közelében található felszíni vízmérce vízállás-/vízhozam- és/vagy hidrometeorológiai állomás csapadékidősorával mutat szoros kapcsolatot. A kis elemszám miatt az altípusokra bontást nem végeztük el. A középtájon kívül eső, de vizsgálatba bevont 2578-as számú hajdúnánási felszínközeli állomás terepszinthez viszonyított vízmozgása legerősebben a csapadékkal korrelál (6. ábra). Megfigyelhető, hogy a talajvízállás 1-2 éves késéssel követi a csapadékmennyiség változását, ez elsősorban a talaj és talajképző kőzet vízáteresztő-képességétől, a finomfrakció mennyiségétől függ. 6. ábra. A talajvízállás és a csapadék kapcsolata Hajdúnánás térségében Feltételezzük, hogy a Keleti-főcsatorna közelében elhelyezkedő objektum vízjárására a főcsatorna üzemi vízszintjei is hatást gyakorolnak, bár vízállás/vízhozam adatsor hiányában ezt a relációt figyelmen kívül hagytuk. A vízgyűjtő vízfolyásainak és tározóinak/tavainak parti sávjában elhelyezkedő észlelőhelyek talajvízállása távolságtól függően szoros kapcsolatot mutat a vízfolyás hidrológiai elemeinek változásával, néha szinte teljes mértékben követi azt. A vízfolyástól távolodva a hatás erőssége az üledékek jellemzőitől és a víznyomás mértékétől függően lecsökken, majd megszűnik. A vízszintek változásából meghatározhatjuk azokat a periódusokat, amikor a vízfolyás táplálja a talajvizet, s amikor megcsapolja azt (Kovács Gy. et al., 1972). A feldolgozott talajvízkutak több mint fele ebbe a főtípusba tartozik (7. ábra). 7. ábra. A talajvízállás és a felszíni víz kapcsolata Kántorjánosi térségében A 3. főtípus csupán annyiban tér el az előzőtől, hogy a talajvízkutak vízmozgása a közeli felszíni vízfolyás(ok) vízállás-/vízhozam-adatai mellett egy vagy több hidrometeorológiai észlelőhely 9 130
139 csapadékadataival is erős korrelációt jelez. Ezek a felszínközeli állomások részben a Nyírség középső, központi részén, részben a középtáj peremi (Hajdúháttal, Rétközzel, Beregi-síkkal szomszédos) területein fekszenek (8. ábra). 8. ábra. A talajvízállás, a csapadék és a felszíni víz kapcsolata Apagy térségében A domborzati viszonyokat követő talajvíztükör a lejtésviszonyoknak megfelelően a mélyebben fekvő peremi területeken és a buckavonulatokat tagoló depressziókban (nyírvízlaposok, deflációs laposok, stb.) a felszínhez közelebb helyezkedik el (általában 2 4 m között). A laza üledékeken gyorsan beszivárgó csapadék vertikálisan táplálja (a kapilláris vízemelés csökkenti), a vízfolyások pedig horizontálisan befolyásolják a környezetükben létesített figyelőkutak vízfelszínét. A Nyírség felszíni vízfolyásokban szegény, vízhiányos Ny-i szegélyén létesített figyelőkutak vízjárására a korrelációs vizsgálatok alapján sem a mérőpontoktól viszonylag távol eső fő- és mellékfolyások, egyéb belvízlevezető csatornák lefolyási viszonyai, sem a felszínre hulló, s onnan beszivárgó csapadék nem fejtenek ki jelentős hatást (9. ábra). A csapadék- és hőmérsékletháztartás évszakos különbségei tetten érhetők a talajvízállás hosszú idejű és éves ingadozásában, de ennél a főtípusnál a természeti folyamatok (orográfiai viszonyok a peremek felé lejtő térszín, talajadottságok homokos, löszös üledékek, stb.) mellett az emberi tevékenység szerepe is meghatározó. 4. Összefoglalás 9. ábra. A talajvízállás és a csapadék közötti kapcsolat Téglás térségében Stelczer K. (2000) megállapításával összhangban elmondhatjuk, hogy a talajvíz, a csapadék és a felszíni vizek bonyolult kapcsolatrendszerének vizsgálatakor a talajvízkutak vízjárását befolyásoló természeti tényezők (domborzat, éghajlat, üledék és talaj, hidrológia, növényzet, stb.) mellett az antropogén hatásokat (pl. a közműolló kinyílása; kommunális, mezőgazdasági, ipari célú talaj- és elsősorban rétegvízkivétel; művelési ág váltás) is figyelembe kell venni, mert a mesterséges beavatkozások a természetes egyensúly megbomlásával a talajvíznívó fokozatos vagy hirtelen, ugrásszerű megváltozását eredményezhetik. 5. Köszönetnyilvánítás
140 Köszönjük a Felső-Tisza-vidéki Környezetvédelmi és Vízügyi Igazgatóságnak (Nyíregyháza) és a Tiszántúli Környezetvédelmi és Vízügyi Igazgatóságnak (Debrecen) az adatszolgáltatást. Hivatkozások eusoils.jrc.ec.europa.eu/esdb_archive/pesera/pesera_download.html Kató S A Lónyay-főcsatorna torkolati műtárgy üzemelési tapasztalatai. MHT XXVIII. Országos Vándorgyűlés, Sopron, július Kovács Gy. et al A felszín alatti vizek hidrológiája és hidrogeológiája. VITUKI, Budapest, 183 p. Stelczer K A vízkészlet-gazdálkodás hidrológiai alapjai. ELTE Eötvös Kiadó, Budapest, pp
141 Regional assessment of conditions in the Soil Information System (TIM) data, and 0.01 M calcium chloride extracts of soil parameters based Összefoglaló. 1. Anyag és módszer A három térség tápanyag-gazdálkodási adottságainak összehasonlítására a 133
142 2. A 0,01 M kalcium-kloridban oldható tápelem- Az enyhe extraháló szerek könnyen oldható és oxidálható szerves frakciója A könnyen mobilizálható N-készletek N-ellátottság A hazai talajvizsgálati és szaktanácsadási rendszerben humusztartalom 134
143 Az adatok értékelése, összehasonlítása 1. táblázat. Régiók -Tiszavidék Hajdúság Nyírség Mind Agyag A (%) A (%) A (%) H (%) A (%) A (%) A (%) A (%) A (%) A (%) A (%) A (%) A (%) Kategória < > Átlag < > Átlag < > Átlag Adatok száma ph (H2O) 6,19 6,28 6,25 6,25 5,69 7,33 7,10 7,14 5,79 6,26 6,35 5,97 6,32 ph (KCl) 5,21 5,03 4,86 4,92 4,62 6,55 6,30 6,33 4,76 5,20 4,83 4,91 5,23 Homok (%) 84,3 33,2 10,8 21,9 77,2 22,4 10,1 19,5 85,5 52,7 4,1 72,1 43,3 Iszap (%) 8,8 51,2 43,7 41,5 14,4 56,1 57,8 54,7 9,4 31,4 43,7 17,9 34,1 Agyag (%) 6,8 15,6 45,5 36,6 8,4 21,5 32,1 25,8 5,1 15,8 52,3 10,0 22,6 KA 26,0 39,6 60,3 53,4 25,0 39,8 42,9 40,5 25,1 32,8 67,0 28,8 39,9 Humusz (%) 0,91 1,82 3,83 3,20 1,19 2,87 3,02 2,85 0,75 1,48 2,93 1,06 2,19 NO3-N mg/kg 10,0 14,2 13,8 13,5 6,3 15,2 21,6 17,8 9,8 17,2 13,5 12,4 13,9 AL-P2O5 mg/kg 152,3 159,6 105,5 119,2 136,0 910,9 247,3 555,8 457,2 117,5 136,0 332,5 307,7 AL-K2O mg/kg 187,3 171,2 240,5 223,6 223,0 442,0 345,9 384,9 147,0 160,6 300,0 155,7 229,2 Mg-KCl mg/kg 60,7 217,2 562,2 454,5 80,0 199,8 313,7 247,4 40,8 138,2 520,0 86,7 248,6 Mn-KCl mg/kg 123,3 121,8 97,6 104,2 110,0 122,4 135,0 127,7 76,0 115,1 120,0 90,6 103,4 -Tiszavidék Hajdúságban Nyírségre 135
144 2. táblázat. Régiók -Tiszavidék Hajdúság Nyírség Mind Agyag A (%) A (%) A (%) H (%) A (%) A (%) A (%) A (%) A (%) A (%) A (%) A (%) A (%) Kategória < > Átlag < > Átlag < > Átlag Adatok száma ph (CaCl2)* 5,62 5,59 5,50 5,53 5,33 6,80 6,64 6,65 5,36 5,61 5,71 5,46 5,74 NO3-N (CaCl2)* 9,97 9,62 8,35 8,72 1,70 21,07 23,59 21,24 8,76 13,84 5,50 10,41 12,20 NH4-N (CaCl2)* 4,20 5,04 6,02 5,67 11,30 5,89 4,62 5,57 7,13 5,48 5,70 6,52 6,02 N-org (CaCl2)* 5,87 8,94 12,16 11,00 6,10 9,49 8,28 8,74 5,41 8,32 10,70 6,54 8,56 N-össz (CaCl2)* 20,0 24,8 26,5 25,5 19,2 36,4 36,5 35,6 21,1 27,6 21,9 23,4 26,8 Ortho P(CaCl2)* 2,87 1,82 0,85 1,21 4,31 3,49 2,73 3,17 3,30 1,49 1,01 2,62 2,25 P-org (CaCl2)* 0,74 0,96 1,33 1,21 0,80 1,48 0,77 1,11 0,60 0,96 1,08 0,74 0,98 P-össz (CaCl2)* 3,61 2,78 2,14 2,39 5,11 4,97 3,50 4,28 3,90 2,45 2,10 3,35 3,22 K (CaCl2)* 111,0 84,6 59,6 68,9 105,0 151,4 91,6 120,6 87,3 67,4 84,0 80,4 85,2 Mg (CaCl2) * 55,3 165,4 261,5 224,9 75,0 148,4 161,6 150,8 41,7 125,4 252,0 75,8 143,6 Mn (CaCl2)* 29,7 37,0 15,2 20,3 53,0 11,8 19,6 17,6 28,6 44,2 15,0 33,6 25,5 AL-Ca* 129,3 557,6 587,5 536,7 304,0 555,3 396,2 466,7 248,3 365,5 1126,0 311,5 423,1 *=mg/kg 3. A humusztartalom szerint csoportosított adatok értékelése 136
145 3. táblázat. Régiók -Tiszavidék Hajdúság Nyírség Mind Humusz H (%) H (%) H (%) H (%) H (%) H (%) H (%) H (%) H (%) H (%) H (%) H (%) Kategória <1,0 1,0-2,5 2,5> Átlag 1,0-2,5 2,5> Átlag <1,0 1,0-2,5 2,5> Átlag Adatok 1,0 9,0 20,0 30,0 7,0 12,0 19,0 25,0 9,0 4,0 38,0 87,0 ph (H2O) 5,6 6,2 6,3 6,2 6,7 7,4 7,1 5,7 6,1 7,1 6,0 6,3 ph (KCl) 4,5 5,1 4,9 4,9 5,9 6,6 6,3 4,7 5,1 6,1 4,9 5,2 Homok (%) 85,8 41,5 9,9 21,9 33,1 11,5 19,5 82,6 59,9 34,1 72,1 43,3 Iszap (%) 8,2 41,4 43,2 41,5 45,1 60,3 54,7 10,8 27,9 39,2 17,9 34,1 Agyag (%) 6,1 17,0 47,0 36,6 21,8 28,2 25,8 6,5 12,2 26,7 10,0 22,6 KA 24,0 38,2 61,8 53,4 36,4 42,8 40,5 26,0 29,8 44,5 28,8 39,9 Humusz (%) 0,62 1,76 3,98 3,20 2,11 3,29 2,85 0,64 1,36 2,94 1,06 2,19 NO3-N mg/kg 10,1 14,5 13,2 13,5 16,8 18,3 17,8 8,8 17,7 23,1 12,4 13,9 AL-P2O5 mg/kg 143,0 159,0 100,2 119,2 1018,9 285,7 555,8 123,5 135,1 2082,8 332,5 307,7 AL-K2O mg/kg 279,0 192,7 234,8 223,6 388,3 383,0 384,9 125,8 169,4 311,3 155,7 229,2 Mg-KCl mg/kg 34,0 200,7 589,8 454,5 141,4 309,3 247,4 44,2 117,3 283,5 86,7 248,6 Mn-KCl mg/kg 140,0 118,8 95,9 104,2 115,3 135,0 127,7 83,0 97,4 122,5 90,6 103,4 4. táblázat. Régiók -Tiszavidék Hajdúság Nyírség Mind Humusz H (%) H (%) H (%) H (%) H (%) H (%) H (%) H (%) H (%) H (%) H (%) H (%) Kategória <1,0 1,0-2,5 2,5> Átlag 1,0-2,5 2,5> Átlag <1,0 1,0-2,5 2,5> Átlag Adatok 1,0 9,0 20,0 30,0 7,0 12,0 19,0 25,0 9,0 4,0 38,0 87,0 ph (CaCl2)* 5,40 5,53 5,53 5,53 6,21 6,91 6,65 5,23 5,54 6,68 5,46 5,74 NO3-N (CaCl2)* 11,0 10,5 7,8 8,7 21,6 21,0 21,2 7,6 15,9 15,6 10,4 12,2 NH4-N (CaCl2)* 4,10 5,38 5,89 5,67 5,61 5,55 5,57 6,74 6,56 5,13 6,52 6,02 N-org (CaCl2)* 4,70 8,56 12,41 11,00 7,39 9,53 8,74 5,23 7,83 11,83 6,54 8,56 N-össz (CaCl2)* 19,8 25,1 26,0 25,5 34,6 36,1 35,6 19,4 30,3 32,4 23,4 26,8 Ortho P (CaCl2)* 3,33 1,85 0,82 1,21 3,46 3,00 3,17 2,60 1,92 4,26 2,62 2,25 P-org (CaCl2)* 0,60 0,98 1,35 1,21 0,95 1,20 1,11 0,56 0,84 1,60 0,74 0,98 P-össz (CaCl2)* 3,93 2,72 2,17 2,39 4,42 4,20 4,28 3,16 2,77 5,87 3,35 3,22 K (CaCl2)* 187,0 88,3 54,3 68,9 145,1 106,3 120,6 78,4 81,7 90,0 80,4 85,2 Mg (CaCl2)* 42,0 150,3 267,6 224,9 117,6 170,2 150,8 47,0 108,7 182,0 75,8 143,6 Mn (CaCl2)* 47,0 30,8 14,3 20,3 28,0 11,6 17,6 35,6 40,4 5,5 33,6 25,5 AL-Ca mg/kg 114,0 421,6 609,6 536,7 368,6 524,0 466,7 248,5 390,9 527,0 311,5 423,1 * = mg/kg 137
146 4. Összefoglaló értékelés -Tiszavidéken 138
147 Hajdúságban Nyírségre 5. Következtetések Hajdúság -Tiszavidéken Nyírség N-frakciók 139
148 Hivatkozások 140
149 Abstract. Keywords: 1. Bevezetés 141
150 2. Anyag és módszer 1. ábra 142

151 2. ábra. 143
152 3. Eredmények 3.1. A kritikus indítósebesség vizsgálata 144
 3.2.")
153 1. táblázat. textúraosztály átlagos kritikus indítósebesség (m/s) 3.2. A szélprofil vizsgálatok eredményei 3. ábra. 145
154 4. ábra Az erodálhatósági vizsgálatok eredményei 146
155 5. ábra A potenciális szélerózió-veszélyeztetettségi térkép Agrotopo 147

156 Agrárinformatika 2011 Konferencia / Agricultural Informatics 2011 Conference 2. táblázat.$ SRWHQFLiOLV V]pOHUy]LyV YHV]pO\H]WHWHWWVpJ PpUWpNH D 1\tUVpJEHQ Hektár Százalékban HUĘVHQ YHV]pO\H]WHWHWW közepesen veszélyeztetett gyengén veszélyeztetett kevésbé vagy nem veszélyeztetett QDJ\RQ HUĘVHQ YHV]pO\H]WHWHWW nem veszélyeztetett Összesen 6. ábra.$ 1\tUVpJ SRWHQFLiOLV V]pOHUy]Ly YHV]pO\H]WHWHWWVpJL WpUNpSH Hivatkozások %RUV\ = $ IXWyKRPRN PR]JiViQDN W UYpQ\V]HUĦVpJHL pv YpGHNH]pV D V]pOHUy]Ly HOOHQ $NDGpPLDL GRNWRUL puwhnh]pv.p]ludw S &RHQ * 0 7DWDUNR - 0DUWLQ 7 & &DQQRQ. 5 *RGGDUG 7 : 6ZHHWODQG 1 - $ PHWKRGIRUXVLQJ :(36 WR PDSZLQGHURVLRQULVN RI DOEHUWDVRLOV (QYLURQPHQWDO 0RGHOOLQJ DQG 6RIWZDUH SS *UHJRU\ - 0 :LOVRQ * 5 6LQJK 8 % 'DUZLVK 0 0 7($0,QWHJUDWHG SURFHVV EDVHGZLQGHURVLRQPRGHO (QYLURQPHQWDO 0RGHOOLQJ DQG 6RIWZDUH SS 148
157 149
158 Abstract. Keywords: 1. Bevezetés
159 3. Módszerek 151
160 1. ábra. 152
161 1. táblázat Mintaterület neve EOV tszf. mag. Forma Területhasználat Talaj 4. Eredmények 4.1. Széleróziós vizsgálatok 153

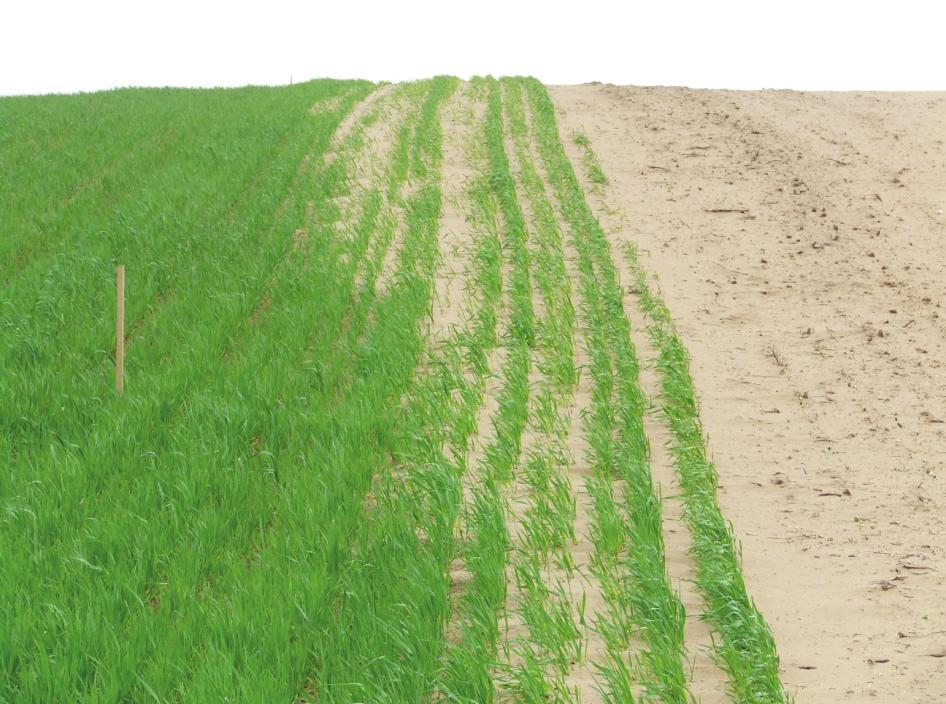
162 2. ábra. 3. ábra. 154
163 155
164 4. ábra. 2. táblázat. Átlagos felszínváltozás Egységnyi széleróziós Mintaterületek ( ) talajveszteség 4.2. Lepeleróziós vizsgálatok 156

165 5. ábra. 157

166 6. ábra. 5. Összefoglalás 158
167 Hivatkozások 159
168 Adatbázis szerkesztése sokparaméteres modellalkotáshoz a Nyírség és a Biharhegység területén historikus és mai adatbázisok alapján Szabó Gergely 1 Abstract. Nowadays there are many possibilities to gain database about certain areas from the European Union. A significant part of them are free of charge. For the development of the region of the EU is essential to know besides these databases the development of the area. Our ultimate goal is to construct land use and sustainability indices about two areas. One of them is the Nyírség in Hungary, another is the Bihar-Mountains in Romania. The main problem is the different existing databases of the two countries, on the other hand, the originally homogeneous EU databases are altering country by country. Keywords: GIS, database, data harmonization 1. Napjainkban az Európai Unió egyre nagyobb hangsúlyt fektet az egyes régiók, országrészek ásaival. A fejlesztésekben felvállalt célok teljesítésének ezen adatok alapján számíthatók ki a releváns változók, mint például a komplex Fenntarthatósági Index. Manapság nak, hogy bár az EU határain belül két mintaterületek. Az 1. ábrán a két mintaterület elhelyezkedését látjuk. 1. ábra. A két mintaterület elhelyezkedése. 1 szabo.gergely@science.unideb.hu 160
, a vonatkozó adatbázisok viszont PpJLV WDUWDOPD]QDN LQKRPRJHQLWiVRNDW PHUW D WULDQRQL HOV]DNDGiVW N YHWĘHQ D NpW RUV]iJ HOWpUĘ PyGRQ pv PLQĘVpJEHQ NpV]tWHWW DGDWEi]LVRNDW WHU OHWpUĘO $] DGatok")
169 Agrárinformatika 2011 Konferencia / Agricultural Informatics 2011 Conference A két terület térben nincs túlzottan távol egymástól (kb. 170km), a vonatkozó adatbázisok viszont PpJLV WDUWDOPD]QDN LQKRPRJHQLWiVRNDW PHUW D WULDQRQL HOV]DNDGiVW N YHWĘHQ D NpW RUV]iJ HOWpUĘ PyGRQ pv PLQĘVpJEHQ NpV]tWHWW DGDWEi]LVRNDW WHU OHWpUĘO $] DGatok egy része Uniós irányelvek szerint készült (pl. CORINE LA1' &29(5 GH PpJ H]HN HVHWpEHQ LV pu]pnhokhwę HOWpUpV NpW RUV]iJ esetében. 2. )HOKDV]QiOW IĘEE DGDWEi]LVRN 2.1. A Második Katonai Felmérés (Ferenc-féle országfelmérés) A Második Katonai Felmérésre I Ferenc császár adott utasítást 1806-ban. Geodéziai alapjai lpq\hjhvhq SRQWRVDEEDN YROWDN PLQW HOĘGMpQHN D] (OVĘ.DWRQDL )HOPpUpVQHN HPHOOHWW D] DONDOPD]RWW PyGV]HUHN pv PĦV]HUHN LV MyYDO IHMOHWWHEEHN YROWDN,WW PiU HJ\VpJHV MHONXOFVRW DONDOPD]WDN D] VV]HV V]HOYpQ\UH $ WpUNpSPĦ MHOHQWĘV KLEiMD YROW YLV]RQW KRJ\ LJHQ KRVV]~ LGĘQ iw WDUWRWW D PDJ\DURUV]iJL szelvények szerkesztése (1819- tj\ WDUWDOPLODJ MHOHQWpNHQ\ HOWpUpV WDSDV]WDOKDWy D OHJHOVĘ pv D OHJXWROVy V]HOYpQ\HN N ] WW $ PLQWDWHU OHWHLQN PLYHO HJ\PiVVDO pulqwnh]ę WHU OHWHN egységesen, egymás után kerültek felmérésre, az 1860-DV pyhn PiVRGLN IHOpEHQ (OĘV] U D Q\tUVpJL UpV]HNHW PDMG pedig a bihari területeket mérték fel. A bihari mintaterület egy része már az Erdélyi Nagyfejedelemség UpV]pW NpSH]WH (QQHN IHOPpUpVH D] HOĘEELHNQpO NRUiEEDQ -EDQ NH]GĘG WW GH NpV]tWpVH UpV]EHQ áthúzódott a III. Katonai Felmérésre. (Jankó A., 2007, internetes hiv-1.) 2.2. A CORINE adatbázis A CORINE (COoRdination de l INformation sur l Environnement) egy standard európai IHOV]tQERUtWiVL DGDWEi]LV PHO\HW -ban egységesítettek és alakítottak ki végleges formában (CORINE Land Cover - 7HFKQLFDO *XLGH (XURSHDQ &RPPLVVLRQ /X[HPERXUJ 2. ábra. A két mintaterület elhelyezkedése a CORINE Land Cover térképen. +D]iQN WHU OHWpUH ĘV]pUH NpV] OW HO D.RUPiQ\KDWiUR]DW DODSMiQ $ SURJUDPRW D 3KDUH 5HJLRQiOLV. UQ\H]HWL 3URJUDP ILQDQV]tUR]WD $] DGDWEi]LV pv méretarányokban készült el hazánkra. Ez utóbbi az EU által preferált méretarány, és az Európai. UQ\H]HWL hj\q NVpJ (($ KRQODSMiUyO LQJ\HQHVHQ OHW OWKHWĘ tj\ YL]VJiODWDLQN VRUiQ PLQGNpW 161
170 ssága 100m. Az alkalmazott osztályok száma a hazai állományban 27db. Az adatbázist fotóinterpretációs SPOT-4 hamis színes kompozitokat használtak fel, melyek 1998-tól álltak rendelkezésre. Az A CORINE adatbázis két példánya készült el az EU terü CORINE ben készült el Magyarországról, és ben gesen jobb, mint az 1990-esé. (internetes hiv-2, internetes hiv- -4) Az SRTM adatbázis - kább hagyományos térképek alapján RADAR és SIR- - felszínmodellezésére. Ebben még így is sok hiba maradt, amit majd csak az SRTM-2-ben korrigáltak. Azokon a területeken ahol sem az eredeti mérésekben, sem pedig a korrekcióknál nem sikerült helyek), ott a - -as értéket rendelték a pixelekhez. A -át fedi le, az északi féltekén a 60., a délin pedig az voltak. Az elkészült adatbázis átlagos vízszintes pontossága Európában átlagosan 8,8 m, magassági pontossága pedig 6-8 m. Saját vizsgálataink alapján hazai mintaterületeken megállapítottuk, hogy az Az egyes pixelekhez rendelt magassági értékek azonban 2- -es eltérést mutatnak, mégpedig oly - 2,9 m-rel alacsonyabb, mint a topográfiai térkép alapján számított domborzatmodell, tehát amennyiben más mintaterületen ekkora vagy ennél kisebb ábrán a bihari mintaterület SRTM modell-alapú domborzati térképét láthatjuk, a mintaterület határaival. 162

171 3. ábra. A bihari mintaterület SRTM modell-alapú domborzata a mintaterület határaival. A Google Earth-be építve az SRTM modellt, szintén jól hasznosítható adategyüttest kapunk, melyen a domborzat mellett a felszínborítás is jól tanulmányozható. (internetes hiv- etes hiv-6,, internetes hiv-7, internetes hiv-8, internetes hiv-9, Jakob 2001, Szabó G. 2010, internetes hiv-10.) A felhasznált topográfiai térképek szabályozza a topográfiai és a hadászati célú térképezéssel kapcsolatos tevékenységeket. E mellett 21.) FVM-HM- -HM- -HM-PM együttes rendelet módosításáról. hengervetület. Alapfelülete az forgási ellipszoid (IUGG-67), melyet úgy módosítottak, hogy optimálisan simuljon a geoid felülethez hazánk területén (HD-72). A rendelkezésünkre álló térképek frissítésének ideje az eltéréseket okozhat, ezért kizárólag a szintvonalakat használtuk fel, valamint a felszíni objektumokat - Internetes hiv-10, Internetes hiv-11). -es és 1980-as években frissített topográfiai szelvényeket sikerült Romania National Grid (Stereo 70). A vetület forgási ellipszoidja az abban 2.5. it dolgoztuk fel. Ezeknél a havi átlagokat vettük alapul. 163

172 A felhasznált csapadék adatok esetében a havi átlagokból éves átlagokat számítottunk, majd ezeket Vízadat.hu volt. -Tisza-vid adatbázis felépítése ut belvízfoltokat. Ezeket beszkenneltük, majd a foltokat objektumként vektorizáltuk. Másrészt a belvizes, csatornák leválogattuk a vízzel borított és a vízzel átitatott területeket. használtuk fel. Az adatbázis építéshez saját terepi mérések is készültek -eróziós jelle. Ezeknél anyagtranszport-mérés. A mérések alapján egyrészt a teljes területre interpolálhatóak lettek a transzportfolyamatok, másrészt laboratóriumi vizsgálatokat is A fenti mellett terepi biodiverzitás- - program adott alapot. (Internetes hiv-12, internetes hiv-1 ). Korlátozottan igénybe vettük a Google Earth felvételeket is. Mivel e felvételek készítésének beazonosítására, területek lehatárolására használtuk fel. A munka során geodéziai méréseket is folytattunk, hogy a fent részletezett térképi és távérzékelési alapadatbázisokat saját mérések alapján pontosítsuk. A terepi mérésekhez (4. ábra) Stonex S9 kétfrekvenciás GPS-t, valamint Trimble Recon egyfrekvenciás GPS-t használtunk. 4.ábra. A felhasznált adatbázisok és a két A tanulmány megírását A Bihar-hegység és a Nyírség talajvédelmi stratégiájának kidolgozása az 164
173 Hivatkozások 1. Arcanum Kft Land Accounts for Europe ISBN Shuttle Radar Topog 10. Varga József 20 -ig MTA TAKI - - Szabó Gergely Az SRTM adatbázis pontosságának vizsgálata síksági és hegylábi mintaterü Geoinformatika és Domborzatmodellezés. Miskolci Egyetem. ISBN
174 1 - és gyepterületein Diversitas experiments in Nyírség s forest and grass areas Tóth Albert Csaba 2 Abstract. In the course of the diversity studies carried out in 28 quadrant of five different habitat types (swamp, fresh grasslands, dry grasslands, bushes and woodlands) in the spring and early summer aspects of woodlands and grasslands in the Nyírség 226 plant species were identified in total. Following this, the social behaviour types, naturalness values and four ecological indicator values of all plant species were collected into tables. Most diverse and most complicated structured habitats are the open sandy oak woodlands with grassland mosaics and the closed sandy oak woodlands (29 species). At the same time habitats poorest in species were also found among woodlands: planted northern red oak with three species High number of species characterises natural open and closed sandy grasslands (25-27 species) and one studied site of fresh wet grasslands (24 species) as well. In the rest of the areas diversity was less with species number less than 20 and even less than 10 in the case of swamps. Analysing the social behaviour types of species and the naturalness values calculated from them it was revealed that not the most diverse habitats are the most valuable. They are the moderately diverse bushes (willow and birch marshes) and the least diverse swamps where the ratio of unique specialists, rare specialists, specialists and competitors is high. Keywords: sandy grasslands and woodlands, biodiversity, naturalness value, social behaviour types. 1. Bevezetés Az ember megjelenése óta folyamatosan változó, átformálódó Nyírség területén az antropogén a Ennek ellenére a homoki homoki gyepek, mocsár- és - és nyírlápok kisebb-nagyobb foltjai szerencsére még fennmaradtak. Ezeken a területeken a Hortobágyi Nemzeti Park Igazgatósága koordinálja a természetvédelmi feladatokat. A táj mozaikjainak szépsége, fajgazdagsága, valamint szükségessége hívta életre Bihar megyei kiterjedésben. A természet epek tanulmányozása mellett figyelmet kell fordítani a betelepített, vagy behurcolt, invazív, tájidegen fajokra és társulásokra is, re. A Nyírség biogeográfiai szempontból ományba tartozik, és annak Nyírségense flórajárását alkotja. A nyírségi flóra nagyobb része (kb. 55%- -európai DK-i (pontusi, pontusi-mediterrán) és D-i fajok, végül az atlantikus, az É- fajok együttesen is csak néhány százalékot képviselnek. A kutatás célja az volt, hogy jelentenek 1 A tanulmány megírását A Bihar-hegység és a Nyírség talajvédelmi stratégiájának kidolgozása az EU direktívák alapján (HURO/0901/2.2.3/135) c. pályázat támogatta. 2 toth.csaba@science.unideb.hu 166
175 2. Mihály ikor Kitaibel Pál, a magyar naturalizmus atyja, pesti egyetemi tanár a 18. század végén és a 19. század elején háromszor végigutazott a Nyírségen (1796, 1803, 1815), valamint a Nyírbátor melletti (Tuzson, 1915; Rapaics, 1925; Boros, 1932; Soó, 1933). Az és Dél- a sajnos fajok kipusztulásáról és ritka fajok eddig még nem ismert új populációiról, 1989a; 1989b; 1990) a dél- és Hajdúsáms, 2003; Matus et al., 2005). biodiverzitás-vizsgálatot végeztünk jelenlegi florisztikai jellemvonásait. -Nyírség területén fekszik, de a Délkelet-, az Északkelet- és a - kiválasztott 28 - száraz gyep; 4 üde rét, -típusét (1. ábra). Térképi Adatbázisa). A gyepek és mocsarak - gi értékük, meghatározásához Simon Tibor: A magyarországi edényes flóra határozóját használtuk fel (Simon T. 2000). A kvadrátos felvételezések mellett fotókkal is dokumentáltuk melyhez Borhidi A munkáját vettük alapul. A táblázatok minden oszlopának meghatároztuk az -típus szerinti csoportokba rendezve SPSS 14.0 szoftverrel b stabilitására, természetességi állapotára, a társulás regenerációs készségére ill. kapacitására, valamint a zavartság, átalakítottság, ill. a természetes állapottól való eltérés mértékére. A vizsgált nyírségi zavartság függvényében természetességi értékszámokat rendeltünk (1. táblázat) (Borhidi, 1993). 167
176 1. ábra -típus szerinti megoszlásai 1. táblázat A szociális magatartási típusok és a hozzájuk rendelt természetességi értékszámok Specialisták S + 6 Kompetitor fajok C NP + 3 DT + 2 Természetes gyomfajok W + 1 Meghonosodott idegen fajok I - 1 A - 1 Ruderális kompetitorok RC -2 Agresszív tájidegen inváziós fajok AC - 3 érték- ett figyelembe venni: ritka faj (r): +2 pont; unikális faj (u): +4 pont (Borhidi, 1993): A Szociális Magatartási Típus alap-értékszámaiból és a ritkasági pót- tt létre a természetességi értékszáma Az 1. táblázat és a ritkasági pót-értékszámok Sr (ritka specialisták): 8 pont (pl. Angelica palustris, Iris aphylla) Su (unikális specialisták): 10 pont (pl. Betula pubescens, Salix pentandra) 168
177 A szociális magatartási típusok (SBT) és a természetességi é i indikátor értékeit is feltüntettük táblázatokban. Ezeknek az alapjait Ellenberg dolgozta ki 9-12-fokozatú skálákban melyeket a hazai flórára Borhidi (B) alkalmazott (Ellenberg, 1974; Borhidi, 1993) r értékek TB: ; WB: a relatív talajvíz ill. talajnedvesség indikátor számai; RB: a talajreakció relatív mértékszámai (mészk - NB: a nitrogén-igény relatív értékszámai. 4. A Nyírség leg deflációs mélyedések, laposok, csatornák és nyírvízfolyások területén szárú vegetációtípus, a Ezek szélén, a parti zónában, általában a harmatkásás, békabuzogányos mocsári- alakult ki, amelyek hosszabb- A megvizsgált hajdúsámsoni során alacsony fajszám mellett (6 és 9), viszony -90%) voltak. ) fajok találhatók, kevés t ek. A talajok ph- számítanak (neutrális, gyengén baziklin fajok), melyek a tápanyagellátottsági értékszámok (N-igény) alapján szubmezotróf- képviselnek. A deflációs mélyedések, laposok peremén kialakult üde rétek, nedves gyepeken nyírségi vizsgálatai -típussal találkoztunk: mocsárrétekkel, ártéri és mocsári magaskórósokkal, valamint kékperjés láprétekkel. hogy viszonylag diverz, -24 faj), melyek természetességi értékszám ak túlsúlyban, de megjelennek a specialisták (S) és ruderális kompetitorok (RC) is, tehát az értékszámok szóródása nagyobb, mint a mocsarak esetében. A legértékesebb nedves gyepeknek a lápréteket tekinthetjük, ahol ípusok mellett megjelennek a ritka specialisták (Sr) is, mint a (Angelica palustris), a reliktum, szubalpin zergeboglár (Trollius europaeus). (Dactylorhiza incarnata), a békakonty ( ), a mocsári kosbor (Orchis laxiflora) és a vitéz kosbor (Orchis militaris). figyelembe véve neutrális- szu A Nyírség deflációs gyeptípussal találkozhatunk: a nyílt homokpusztagyepekkel és a zárt homoki sztyeprétekkel. Ezeken területeken kialakult fiatal parlagokon me t végeztünk. Összesen tehát 9 db 2 x 2 m-es száraz gyepkvadrát A nyílt homokpusztagyepek a nyírségi homokbuckák (garmadák, parabolabuckák) laza, humuszszegény, rossz vízgazdálkodású homoktalajain kialakult alacsony, maximálisan 75%-os záródású, 169
178 A felmért három vámospércsi nyílt homokpusztagyep adataiból -viszonyaiban ill. - területén végzett szemben a zúzmók és mohák, ezeken belül is a a (Polytrichum piliferum) borítási értékkel (43%) képviseltette magát. A Hajdúsámson - magyarázható, hogy a terület A zárt homoki sztyeprétek tápanyag-szolgáltató talajaik miatt a Nyírség területén szinte mindenütt beszántották állományaikat. (Pulsatillo hungaricae- Festucetum rupicolae) Pulsatilla pratensis subsp. hungarica) szerencsére még nagy egyedszámmal képviselteti magát. A hajdúsámson-martinkai homoki sztyeprét- Potentillo arenariae-festucetum pseudovinae), ahol a agressz. A fiatal parlagok, ugarok és utak menti bolygatott száraz gyepek fajszáma és fajkészletének en - és fedélrozsnok (Bromus strrilis, B. tectorum), valamint az agresszív tájidegen fajok (AC), mint artemissifolia) és a betyárkóró (Conyza canadensis) uralkodnak. Természetességi értékszám átlagai a ahol a természetes gyomfajok (W) és tékszámait tekintve az utolsó helyen állnak - - tápanyagszegény -bokros társulások, azaz a cserjések három típusát mértük fel nyírségi vizsgálataink cserjések. E három kvadrát biodiverzitása bár alacsony- - és nyírlápok a t elfoglaló nyírlápon két unikális specialista (Su): Betula pubescens és Salix pentandra, valamint négy specialista ink során ez a terület bizonyult a legmagasabb természetességi értékszám átla. Ökológiai indikátor értékein került ki. A talajok ph- -ellátottságú A nyírségi diverzitás- -típus számít a legváltozatosabbnak fajszámát, szerkezetét, -NÉR kategóriába sorolható típussal találkoztunk: 170
179 - ámít. Festuco rupicolae-quercetum roboris) a Nyírség savanyú homokján, Quercus robur) do Bánk - belül a Polygonato latifolii-quercetum roboris és a Convallario-Quercetum roboris társulástípusok került ellátottságú humuszos homoktalajok jellemzik. a nyírvízfolyások árterének azon szintjén alakultak ki, amely egykor évi velve ezzel az zergeboglár (Trollius europaeus), a fehér zászp specialisták (Sr), a sok specialista (S) és kompetitor (C) faj miatt ez a kvadrát a negyedik legmagasabb. ly- - területén egy fiatal, 3- ki egy 10 x 10 m- es kvadrátot. A vi változataira emlékeztet. ják el a legnagyobb területet. A kell emelni. Az Észak-Nyírség t fajszám (13-16 faj) mellett nagyon alacsony természetességi értékszám átlagot mutatnak (0,3-0,53). Ezekre t z egykori helyét foglalják el. Biodiverzitásuk és ezzel természetességi értékszámaik alacsonyak. 5. Összefoglalás A nyírségi - és gyepterületek tavaszi és kora nyári aszpektusán elvégzett diverzitásvizsgálatok - unk meg. Ezek után Borhidi A. (1993) munkája alapján ük táblázatokba. Az adatokat boxplot diagramokon ábrázoltuk, tések vonhatók le: uk a legkisebb diverzitású, fajokban 171
180 homoki gyepeket (25-27 faj) és az üde nedves gyepek egyik bi van (2. ábra). átlagait elemezzük, akkor megállapítható, hog - és nyírlápok), vagy egyenesen a legalacsonyabb fajszámú mocsarak, melyekben magas az unikális specialisták (Su), ritka specialisták (Sr), specialisták (S) és kompetitorok (C) aránya (3. ábra) rületek értékszámai negatív tartományba estek. tápanyagellátottságú savanyú h i 2. ábra 172
181 3. ábra 4. ábra A relatív talajvíz ill. talajnedvesség indikátorszámainak (WB) átlaga az egyes nyírségi -típusokon Boros Á A Nyírsé. - Útmutatója (ÉIÚ) 2.0. Kéz. H. Ellenberg lanzen. p. 173
182 formation of inland dune grassland in Hungary. Flora. 200(2005): Nyírség) flórájához. Kitaibelia. 8. (1): , a Dél- II/2. Debrecen, pp , a Dél- III/2. Debrecen, pp , a Dél Rapaics R (2): Simon T Soó R A Nyírség vegetációjának ismeretéhez. Debreceni Szemle. 1933: A magyar 33:
183 1 2 3 Abstract Keywords:,, 1. Bevezetés
184 A belvíz még 2. Anyag és módszer s)
185 es
186 i , mely - - b A Excel

187 1. ábra. 3. Eredmények 3.1. A nyírségi települések belvíz-veszélyeztetettségének értékelése az elöntési térképek alapján

188 - 2. ábra , elvízzel v belvízzel 180
189 belvíz- - belvíz- i Az i - - -i Az összehasonlító elemzések eredményei Kálló-Alsónyírvíz belvízrendszer A A -i

190 3. ábra. - A - - meg Az belvizes be is benyúl 182


191 -, ábra. - ben - Ér belvízrendszer belvíz, ábra. ben Köszönetnyilvánítás - - Hivatkozások - 183
192 , Y Internetes adatbázisok 184
193 1, 2 és 3 Abstract. - - n- n Bevezetés - e - -növény- -növény- - és - 2. A vízforgalom modellje alajból -növény- - ken a - l - í - 1, 2 -, 3, 185
194 - - e e e ws = (1 p)( fc wp)+ wp táblázat klai PE s = PET e s k a - - aktív a - -, a 186
195 PE 100% 90% 80% 70% 60% 50% 40% 30% 20% 10% 0% hy HV VK0.5sz VKsz VKmax 1. ábra nél y PE 100% 90% 80% 70% 60% 50% 40% 30% 20% 10% 0% hy HV Vkkrit_2 Vkkrit_1 VKsz VKmax 2. ábra
196 2. táblázat növény táblázat ,46 2 2,61 4,16 3 2,63 4,41 4 2,63 2,63 6,14 2 n - 188
197 1 0.8 ET/PET ,2 0,5 1,0 2,0 5, ábra A számítógépes modell A modellben alkalmazott technológiák A talaj-növény- 4 és a 6 és Adatbázis - a a 189
198 Öntözés 3.3. Processzor - nyek A processzor szerepe a grafikus ábrázolásban A a be az - Az és az a a és kí A - 4. Vízmérleg számítás az a Altalaj, a el - z k - - ö - 190

199 - 5. A webes felület szolgáltatásai 4. ábra. e é é - l - A a 2 -en letet a A a a a A a a több 191


200 víz fel a Az év -t latív a éves v A a szél an a A szélse és a a 5. ábra. A a talaj ként A a talajba a talaj Az az teljes öntözést a és A n a a talaj ét és 192

201 6. ábra. jelen ön talaj kez - st ábra. jelen - lében, ken az és a tényle ö 193


202 8. ábra í - - é ö özés n k 9. ábra. 194
203 6. Összefoglalás - al - k -növény- é Köszönetnyilvánítás - Hivatkozások u- -talaj l
204 Precíziós tápanyag-gazdálkodás gyakorlati alkalmazása Precision nutrient-management in practice Ferencsik Sándor 1, Sulyok Dénes 2 és Huzsvai László 3 Abstract. Nowadays, one of the main objectives is to create the conditions of sustainable farming. Precision agriculture enables these conditions to simultaneously prevail. They include production site-specific growing, technologies which change within a plot, integrated crop protection, high technology, remote sensing, geographic information systems, geostatistics, the change of the mechanization of crop production and the usage of information technology achievements in crop production. Production is carried out on 7878 hectares in the examined farms. We divided the area of the farms into sections (blocks). On the basis of expert advice we determined the amount of fertiliser and the quantity of the active substances with precision methods to be applied on the plots. Following this, we compared the technologies on the basis of the fertiliser prices as of June If we applied blocking instead of the actual sowing-structure, we can produce more homogeneous stock of plants within the crop production district, we can also improve the utilisation of our machinery systems in the operation of nutrient management, pest management, soil tillage and harvesting, and additional charges may be saved through this. Furthermore, we also examined a case, where 4 farms (7878 hectares) performed the activities of precision nutrient management and crop protection within the scope of purchasing new fighter of consortium. Keywords: precison agriculture, block, nutrient management, consortium Összefoglaló. megteremtése. Ezeknek a feltételeknek az együtt növényvédelmet, a csúcstechnológiát, távérzékelést, térinformatikát, geostatisztikát, a növénytermesztés gépesítésének változását és az információs technológia vívmányainak alkalmazását a növénytermesztésben. Vizsgálatainkba mintegy 7878 ha területet vontunk be. A gazdaságok területét növénytermesztési kerületekre (blokkokra) osztottuk.. Meghatároztuk az átlagszaktanács alapján, illetve precíziósan kijuttatandó hatóanyagmennyiségeket, maj. júniusi technológiát. Amennyiben a jelenlegi vetésszerkezet helyett a blokkosítást alkalmazzuk, azaz egy adott növénytermesztési kerületen belül minél homogénebb növényállományt termesztünk, a tápanyag- en is a géprendszereink kihasználtságát növelni tudjuk, ezen keresztül pedig további költségeket takaríthatunk meg. Megvizsgáltunk továbbá egy olyan esetet is, amennyiben 4 gazdaság (7878 hektár) konzorciumi gépvásárlás keretében végzi a precíziós tápanyag-gazdálkodási és növényvédelmi tevékenységet. Kulcsszavak: -gazdálkodás, konzorcium 1. Bevezetés ndó kockázati források a gazdálkodók számára. termelés Magyarország gazdasági életében valamiko -gazdálkodásban is megkívánja az emberi 1 Debreceni Egyetem AGTC ferencsiksanyi@fre .hu 2 Debreceni Egyetem AGTC FMTI sulyokd@agr.unideb.hu 3 Debreceni Egyetem AGTC huzsvai@agr.unideb.hu 196
205 szükségletek kielégítésének, illetve a környezeti- környezetvédelmi célok együttes megvalósítását, a környezet minimális terhelését, valamint a gazdaságoss eslegesen elhasznált i a hatékonyságot, valamint csökkenti a költségeket. döntéstámogatási információs rendszer áll rendelkezésére. Csökkenteni lehet a környezetterhelést, és a munkafolyamatok. - folyamatnak még mindenképp az elején tartunk. vetésszerkezetének elemzésén keresztül mutatjuk be a hagyományos és a precíziós tápanyagvisszapótlási módszer közötti különbségeket. 2. Szakirodalmi áttekintés A trágyázás célja a növények tápelem- (Huzsvai Nagy, 2003). Trágyázással pótoljuk a növények által a talajból elvont tápelemeket tápanyag- alkalmazni, kerülve a túltrágyázást, valamint a trágyaszereket helyesen kell megválasztani (pl. a (Loch tápanyag- elmulasztása a talajok term (Kádár, 2000). termesztés hazánkban ahol az agrárágazat a hazai szükségletek kielégítésén túl exportra is termel -specifikus részletes, tábla-szinten belüli felmérését (talaj- és növényvizsgálat, terméselemzés), valamint ezek lését kívánja meg. A GPS és a távérzékelés az adatok felméréséhez, a térinformatika (GIS) az adatok feldolgozásához -gazdálkodás, növényvédelem) megtervezése és alkalmazása érdekében (SZABÓ et al, 2002). A precíziós gazdálkodásban az 1: :1000 méretarány a kívánatos. Minél finomabb a felbontás, annál megbízhatóbb eredmények várhatók (NÉMETH et al, 2007). felhasználása (SULYOK FERENCSIK, 2008). -visszapótlási rendszerekkel szemben elvárt, hogy hosszútávon fenntarthatóak legyenek. A maximális termésszint gcélozni, amikor az egységnyi ráfordításra jutó hozamnövekedés a legnagyobb, és a gazdasági tevékenységgel a legnagyobb jövedelmet tudjuk elérni (NÁBRÁDI FELFÖLDI, 2007). pes termelés nélkülözhetetlen kihasználtsági értékek messze alatta maradnak az ökonómiailag megkívántnak. (GOCKLER, 2008). Ennek az esetek nagy részében az az oka, hogy nincs elég terület, illetve munkafeladat a kihasználtság javításához. 197
206 3. Anyag és módszer umi eredményeit (ph, humusztartalom, Arany-féle kötöttség, vízoldható összes só, CaCO3, NO2+NO3, P2O5, K2O, Nn, SO4, Cu, Zn, Mg, Na) használtuk fel. Kiválasztottuk a precíziós tápanyag-gazdálkodás céljára a mintagazdaságok a részminta alkosson egy átlagmintát. A részmintákat alaposan ö -1,5 kg-nyi táblaátlag alapján számolt tápanyag-gazdálkodási technológi hagyományos géprendszerek segítségével végzik el. Második változatként a - jelenlegi vetésszerkezet figyelembe vételével differenciált tápanyag-visszapótlást alkalmaztunk a 15 hektárnál - 4 talajminta vételi egységnél - nagyobb táblák esetében, míg az ennél kisebb táblákon táblaátlag alapján történt a Az 5 hektáros mintavételi egységenként szedett talajminták akkreditált laboratórium által történt - tápanyag-visszapótlási modulja segítségével a vizsgálatba bevont táblák tápanyag-gazdálkodási szaktanácsait. Valamennyi táblára vonatkozóan készültek táblaátlag alapján számolt szaktanácsok. A 15 hektárnál nagyobb táblák esetében elkészítettük a differenciált tápanyag-gazdálkodási -dózisokat számoltunk ki. A 4 mintavételi egységnél kisebb táblák esetében táblaátlag alapján, az ennél nagyobb figyelembe vettük az adott növénytermesztési körzetben termesztett növényeket, s ezekhez számoltuk -, illetve a kálium a szakirodalom ajánlásai, valamint saját kísérleti tapasztalataink alapján szórást vettük figyelembe, tekintettel a nitrogén hatóanyagok nagyfokú mobilitására a talajban. - és kálium hatóanyag mennyiségeket, majd a hozammal szerepeltek. Az egyes táblákra precíziós módszerrel kiszórandó dózisokat a parcellákra jutó mennyiséget a táblaátlag alapján számoltuk ki. Ezt. júniusi -os ammónium-nitrát 80 Ft/kg, - -os kálisóé pedig 150 forint/ kg. Az így kapott eredmények különbségét összterületre és hektárra vetítve is kiszámoltuk. Gazdaságossági számításaink során változóként kezeltük a foszfor- növényvédelem anyag- és kijuttatási költségeit. Valamennyi növény költség-jövedelem vizsgálatánál hagyományos, precíziós és precíziós-blokkos változatokat szerepeltettünk. Beruházás megtérülési vizsgálatainkat 10 évre - végeztük el. A vizsgált - illetve a közgazdaságilag tiszta támogatás nélküli megtérüléseket is számításba vettük, amikoris a megtérülés csupán a precíziós technika alkalmazásából származó felhasznált források megtérülési rátát (IRR-t) is valamennyi változatban. 198
, a táblán gyorsabban közlekednek (25 km/h), mint a függesztettek (8- - és felvonulásokban is gyorsabban mozognak (55-60 km/h), mint a traktorra")
207 géprendszer alkalmazását) jelenértékre való diszkontálását fejezi ki. gép típusától, tehát megegyezik a függesztett-, vontatott munkagépek és a magajáró kijuttató géprendszerek esetében. A magajáró gépek szórásszélessége nagyobb (32 méter), a táblán gyorsabban közlekednek (25 km/h), mint a függesztettek (8- - és felvonulásokban is gyorsabban mozognak (55-60 km/h), mint a traktorra szerelt berendezések (25 km/h). Emellett az automata kormányzás alkalmazásából származó költségcsökkenést az átfedések csökkenését is figyelembe kell vennünk. 4. Eredmények amennyiben ezt az adott térségben gazdálkodó cégek közös konzorciumi gépvásárlás útján valósítják meg. Vizsgálatainkba 4 gazdaság (Agro-Produkt Kft, Pásztó; Galgamenti Szövetkezet, - Nagykökényes) került bevonásra (1.ábra). 1. ábra. A konzorciumi gépvásárlásba bevont gazdaságok 199
208 A konzorcium négy gazdaságában a vetésszerkezet hasonló, az egyedüli kivétel a turai Galgamenti Szövetkezet, ahol nagy területen mintegy 700 hektáron termesztenek áru- és silókukoricát, míg a többi gazdaságban kukorica termesztése nem folyik (1. táblázat). négy gazdaságból háromban termesztenek, ennek a növénynek a területi részaránya valamennyi esetben kicsi. Áru- és hibridkukoricát, illetve tavaszi árpát csupán egy-egy gazdaságban termesztenek. 1. táblázat A konzorciumi gazdaságokban precíziósan és a blokkos technológiában termesztett növények (ha) Növény precíziós blokkos Repce Tavaszi árpa Napraforgó Kukorica Silókukorica Összesen A gazdaságokat több növénytermesztési kerületre (blokkra) osztottuk, majd elkészítettük a szaktanácsokat hagyományos-, precíziós-, illetve precíziós-blokkosított változatokra, és összesítettük az egyes (2. táblázat). 2. táblázat. - változatok függvényében Szükséges mennyiség (tonna) Kijuttatási mód Pásztó Tura Gyöngyöspata Nagykökényes Összesen Hagyományos Precíziós Precíziós blokkos NH 4 NO 3 300,8 773,0 577,5 MAP 156,7 123,4 175,1 547,3 Kálisó 146,5 188,8 62,7 108,6 506,7 NH 4 NO 3 300,8 773,0 577,5 MAP 61,3 138,2 502,0 Kálisó 130,0 162,4 44,2 436,1 NH 4 NO 3 300,8 773,0 577,5 MAP 61,0 127,5 Kálisó 123,4 400,8 A táblázatból kiolvasható, hogy a precíziós technológia, valamint a blokkosítás alkalmazásával -mennyiség az átlag szaktanácsok által javasoltakhoz képest. A helyspecifikus tápanyag- ulnak olyan esetek, amikor a -ellátottság miatt - többlet anyagköltséget jelent a hagyományos változatok képest az új technológia alkalmazása. Ezekben az esetekben cél az igen gyenge, gyenge ellátottsági kategóriájú talajok közepes ellátottsági kategóriájúvá javítása, a termesztett kultúrnövények mindenkori igényeinek a figyelembe vétele mellett. A 3. táblázat 200
209 3. táblázat. -megtakarítás a differenciált technológia alkalmazásával a vizsgált gazdaságokban (ezer Ft) Precíziós Pásztó Tura Gyöngyöspata Nagykökényes Összesen MAP Kálisó Összesen Precíziós + blokkosítás Pásztó Tura Gyöngyöspata Nagykökényes Összesen MAP Kálisó Összesen Az automata kormányzás alkalmazásával egyaránt 7- -ot lehet megtakarítani mindhárom üzemeltetési költsége 2200 Ft/ha, magajáró gépek esetén ez 2000 Ft/ha, és amennyiben blokkosítjuk a táblákat, úgy 1800 Ft-os hektáronkénti költséggel lehet számolni. Az automata kormányzás alkalmazása mellett is -. A felülkezelések elmaradása következtében kiküszöböljük az anyagköltségek csökkenése mellett azokat a felesleges éges esetben a felülkezelt növény pusztulásához is vezethetnek, de yek mindegyikénél hozamnövekménnyel lehet számolni a felülkezelések elmaradásából. A felülkezelések elmaradásával a többlet hozamok árbevétele mintegy 18 millió forint mindkét termesztéstechnológiai változat esetében. A növényvédelmi tevékenységet a konzorciumba bevont gazdaságokban két magajáró spórolható meg, valamint a nagy tápanyag- 4. táblázat mutatja be. 4. táblázat. A precíziós és precíziós blokkos technológia megtakarítás a konzorcium tápanyag-gazdálkodási és növényvédelmi tevékenysége során (ezer Ft) Precíziós Automata kormányzás alkalmazása 6363 Növényvédelem Felülkezelés-stressz megtakarítás Összesen Precíziós-blokkos Automata kormányzás alkalmazása Növényvédelem Felülkezelés-stressz megtakarítás alkalmazása 6745 Összesen
210 -gazdálkodási, valamint növényvédelmi technológiát, az 5. táblázatban felsorolt munka,- olgálja ki. 5. táblázat. A beruházás megvalósításához szükséges gépkapcsolatok és beszerzési áraik I. Megnevezés Bekerülési ár ezer Ft ezer Ft ezer Ft ezer Ft Magajáró ezer Ft ezer Ft Tartálykocsi ezer Ft ezer Ft Összesen ezer Ft ezer Ft A gépkapcsolatok bekerülési ára alapján elvégeztük a számításokat a nettó jelenértéket, valamint a megtérülési rátákat (6. táblázat). Amennyiben a négy konzorciumi gazdaság csak tápanyag- technológiai változatban ra növekednek az egyes technológiai változatokban. A tápanyaggazdálkodás mellé a növényvédelmi tevékenység felvállalása esetében többlet beruházási költségek lépnek fel. Ezek a második ön tartálykocsi. Amennyiben a konzorciumi gazdaságokban tápanyag-gazdálkodási és növényvédelmi tevékenységet egyaránt végzünk precíziós technológiai rendszernél megté - -ra változnak. 6. táblázat. Tápanyag-visszapótlás Tápanyag-visszapótlás + növényvédelem géptámogatás nélkül géptámogatás nélkül Megnevezés Nettó Jelenérték (NPV) (ezer Ft) kamatláb Precíziós Precíziós Precíziós géptámogatással Precíziós Precíziósblokkos Precíziósblokkos Precíziósblokkos Precíziósblokkos A gépberuházást a 4 gazdaság az új technológia alkalmazásából várható megtakarítások arányában finanszírozná (7. táblázat). Mindkét technológiai változatnál a legnagyobb megtakarítás a turai - kökényesi (27-, illetve 28), a pásztói - 202
211 7. táblázat. A beruházás finanszírozásának aránya az egyes gazdaságok esetén (ezer Ft) Precíziós Gazdaság Megtakarítás Részarány Pásztó Tura Gyöngyöspata Nagykökényes Összesen Precíziós blokkos Gazdaság Megtakarítás Részarány Pásztó Tura Gyöngyöspata Nagykökényes Összesen Következtetések, javaslatok A konzorcium tápanyag-gazdálkodási tevékenységében az ammónium- felhasználása mint a három technológiai változatban (hagyományos, precíziós, precíziós-blokkos) precíziósban 45,3 tonnával, precíziós blokkosban pedig újabb 56,6 tonnával kevesebbre volt szükség. Kálisó esetében hagyományos technológiai változatban 506,7 tonnát juttattunk ki. Precíziós esetben 70,5, blokkos technológia alkalmazásával pedig 105,8 tonnával kevesebbre volt szükség. tápanyag- a tápanyag-gazdálkodási tevékenység mellé növényvédelmet is felvállalunk a konzorcium valamennyi - végeztek felülkezeléseket. Valamennyi termesztett növény esetében a dupla dózisok elmaradásának megtakarítani. A precíziós gazdálkodás lehet az egyik megoldási alternatíva, amely alkalmas a hazai azokat kiszolgáló technikai, technológiai berendez megtérülését, illetve saját piaci környezetüket (pl. input-, output árak) tekintve, A számításokat ki kell terjeszteni a gazdálkodó szervezeteknek a saját gépek vásárlása, illetve a bérmunka szolgáltatás kérdésére is. Milyen többletköltségekkel jár számukra a saját 30- -kal is meghaladhatja a saját gép önköltségét. Még ebben az esetben is vannak olyan részletes számításokat kell elvégezni! Hivatkozások Antal J. Búzás I. Debreceni B. Fekete A. Nagy M. Sipos S. Sváb J. üzemi számítási módszer I. MÉM-NAK Központ. Budapest -ban. FVM-GI. I. sz. 203
212 Huzsvai L. Nagy J A hatása a kukorica (Zea mays L.) termésére öntözés nélküli és öntözéses termesztésben. Növénytermelés 52. 5: p Kádár I felvételére meszes csernozjom talajon - Loch J. Agrokémia és növényvédelmi kémia.. Budapest Nábrádi A.- rk.: Nábrádi A. Pupos T.- Takácsné Gy. K. DE AMTC AVK 2007 Németh T. Neményi M. Harnos Zs MTA TAKI. Szeged Sulyok D. Ferencsik S A differenciált tápanyag-gazdálkodás gazdaságossági kérdései. In: AgrárUnió - Sulyok D. Megyes A. Rátonyi T A tápanyag-gazdálkodás hatékonyságának vizsgálata a kukorica -46. o. Szabó J. Bakos L. Pásztor L Cservenák R- Pogrányi K GPS és internet alapú térinformatikai p 204
213 Bioenergetikai térinformatikai rendszer fejlesztése a Gyöngyösi Kistérség területén Developing a landuse model for bioenergy production for Gyöngyös Small Region Enyedi Péter 1, Kozma-Bognár Veronika 2, Gonda Cecília 3, Tomor Tamás 4, Ambrus Andrea 5 Abstract. Towards the spread of bioenergetics in the broadest possible circles, we presente an e-competencebased development and services of GIS that would also add to the job-retaining potentials of the region, in particular Gyöngyös Small Region. For the term of the project, we have set the objective to create GIS that provides us data and information for the determination of efficient farming districts for energy plants in the region. For the determination of the biomass production we use hyperspectral data. Keywords: bioenergetics, landuse, GIS, hyperspectralremotesensing Összefoglaló. -kompetencia alapú térinformatikai fejlesztés kerül bemutatásra, amely a régió azon belül is a Gyöngyösi Kistérség - munkahely olyan térinformatikai rendszer ztési körzeteinek meghatározásához szükséges fontosabb adatokat és információkat szolgáltatja. A biomassza hozam vizsgálatához hiperspektrális távérzékelt adatok kerülnek felhasználásra. Kulcsszavak:bioenergetika, földhasználat, GIS, hiperspektrális távérzékelés 1.Bevezetés problémája. A fosszilis dtek a megújuló energiaforrások, ezen belül az energianövények termesztésére irányuló törekvések. valamint azok a területek, amelyek hagyományos élelmiszernövények termesztésre nem, vagy nem növénykultúrák kialakítására. A terület kihasználás mellett nem elhanyagolható tény, hogy a megújuló energia- teremtését is megvalósíthatjuk. elterjesztésében, hozzájárulva ezzel az EU ig a teljes energia-felhasználáson belül 13 százalékra kell növelni a megújuló energiahordozók használatát. A -kompetencia alapú térinformatikai fejlesztés és szolgáltatás azon belül is a Gyöngyösi Kistérség - képességének javítását is szolgálja. 1 enyedipeti@gmail.com 2, kozma.bognar@gmail.com 3 gonda.cecilia@gmail.com 4 tomor@karolyrobert.hu 5 aambrus@karolyrobert.hu 205

 3. A modellhez szükséges input adatok meghatározása 4.")
214 2. -gazdálkodási és Vidékfejlesztési Karának Agrárinformatikai és Vidékfejlesztési Intézete 2009-ben a Nemzeti Kutatási és Fejlesztési Hivatal (NKTH) által -kompetencia alapú fejlesztés és szolgáltatás a Gyöngyösi Kistérségben energianövényekre vonatkozóan címmel elindítottuk a nyertes projektet. amely az energianövények hatékony termesztési körzeteinek meghatározásához szükséges fontosabb adatokat és információkat szolgáltatja a Gyöngyösi Kistérség területén. 1. Meghatározni a növénykultúrákat 2. Jelenleg rendelkezésre álló adatbázisok (adathiányos területek lehatárolása) 3. A modellhez szükséges input adatok meghatározása 4. Integrált adatbázis létrehozása (szerver beállítás) 5. Földhasználati modell (entrópia) 6. Internetes felület létrehozása 7. Szolgáltatás indítása Az energetikai céllal hasznosítható növénykultúrákat az alábbi csoportokra bontottuk: 1. Szántóföldi melléktermékek (pl. kukoricaszár) Fás szárú növények 3. A Gyöngyösi Kistérség települései egy igen változatos képet mutat (déli területe sík, alföldi 206

215 bioenergetikában alkalmazható növények számára. Gyöngyös körzetében több száz hektárnyi olyan terület található, amelyeken az alternatív kultúrákat tekintve eredményes és hatékony gazdálkodást lehetne megvalósítani. Erre utal a Földmérési és Távérzékelési Intézet (FÖMI) által készített vetésszerkezeti térkép is, amely a 4. FÖMI 2003 NÖVMON vetésszerkezeti térkép Olyan földrajz termesztését a gyöngyösi kistérségben. A modell kialakításához számos input adatot veszünk figyelembe (közigazgatási adatok, meteorológiai adatok, talajtani paraméterek, topográfiai adatok, területhasználati adatok, stb.) melyek között a projekt megvalósítása során a távérzékelt adatok, Az e-kompetencia alapú térinformatikai szolgál kerül kialakításra, amelyen elhelyezésre kerülnek elektronikus formában az energianövények termesztéséhez kapcsolódó kutatási eredmények, elemzések, feldolgozások. A rendszer alapja egy komplex logikai modell lesz, melynek konstans és változó értékeit, valamint algoritmusait a és ennek eredményeit egy WEB alapú felhasználói felületen tesszük közzé. A proje térinformatikai adatbázis létrehozása, karbantartása, 207
216 5. A -kompetencia alapú térinformatikai projekt során fel kívánjuk használni ezeket a jelenleg rendelkezésre álló adatokat, adatbázisokat, valamint a már pillanatnyilag kizárólag oktatási-kutatási jogosultsággal áll rendelkezésünkre: Közigazgatási-nyilvántartási adatok: - KSH Tstar adatbázis, - Ingatlan-nyilvántartási térképek, - Közigazgatási illetékességek adatbázisa, - MEPAR blokktérképei és vonatkozó adatai. Klimatikai adatok: - Csapadék adatok, - Globálsugárzási adatok, - Szél adatok, - Talajtani adatok: - Átnézetes Talajismereti Térképi (Kreybig) adatok, - Üzemi genetikus talajtérképi adatok 1:10.000, - Földértékelési talajtérképi adatok 1:10.000, - Géczy-féle talajtérképek 1:25.000, - Talajinformációs és Monitoring Rendszer adatai, - Agrokémiai Információs és Irányítási Rendszer (AIIR) TVG adatok, - Agrár-környezetgazdálkodási (AIR) TVG adatok. Topográfiai adatok: - Domborzat, - Felszíni vizek, - Közúthálózat, - Vasúthálózat, - Felszín alatti sérülékeny vízbázisok. Területhasználati adatok: - -50) vektoros adatállomány, - - Második Katonai Felmérés területhasználati adatai, Szakspecifikus adatok: - - Erdészeti üzemi térképi adatok, - Vadgazdálkodási térképi adatok, - Belvízi elöntés-térképi adatok, - -területek térképei, - Talajvíz-kutak adatai, - Természetvédelmi térképi adatok, - Bányászati területek adatai, - Infrastrukturális térképi adatok, 208

, képes")


217 - - Természetvédelmi térképek. A közigazgatási-nyilvántartási adatok segítséget fognak nyújtani az érintettek körének lokalizálására. A klimatikus, talajtani és topográfiai adatokat az agráralkalmasság vizsgálataiban fogjuk használni. A ter vizsgálatokat végezhetünk, a földhasználati stabilitás mértékének megállapítására. 6. valósultak meg. Az felvételezés során a push-broom típusú AISA Eagle hiperspektráliskamerát alkalmaztuk, amely a látható és a közeli-infra tartományban (VNIR), képes képalkotásra. A projekthez kapcsolódóan a Gyöngyösi kistérségben három repülési célterület került kijelölésre és felvételezésre: 3 Hiperspektrális felvételi sávok Tass-Pusztán - 17,95 km2 (balra), Gyöngyöspatán - 6,6 km2 (középen) és Kompolton - 3,85 km2 (jobbra). égre AISA Eagle II -1000nm közötti hullámhossz tartományban, 1,25-10nm közötti csatornaszélességgel és 0,3-3m- pontosabb geometria miatt nagy pontosságú GPS/INS rendszert (OxTS 3003) alkalmaztunk a A légifelvételezéssel kapott adatok egzakt feldolgozásához szükséges referencia adatokat, terepi kkel spektrofotométerrel mérések készültek a hiperspektrális felvételekkel azonos hullámhossztartományban. A kalibráció után elkészített reflektancia spektrumokból spektrális könyvtár készül, 209


218 7. 4 Terepi GPS (balra) és spektrofotométeres mérés (jobbra) A hiperspektrális felvételek radiometriai és geometriai feldolgozása után normalizált vegetációs növényzet által a közeli infravörös (NIR) és a látható vörös (RED) sugárzási tartományban visszavert intenzitások különbségének és összegének hányadosa határozza meg. Az NDVI meghatározásával következtethetünk az adott terület vegetációs aktivitására. Mivel az NDVI korrelál a területet takaró növényzet fajlagos klorofill tartalmával, fotoszintetikus aktivitásával ennek segítségével osztályozhatjuk a mintaterületet a biomassza-mennyiség alapján. A tass-pusztai területre az NDVI számítottuk. 5 készült felvétel, míg jobb oldalt az NDVI- 210
219 A fotoszintetikus aktivitás, pigment-tartalom és C/N meghatározására terepi spektrofotometriás lehetséges a fotoszintetikus aktivitás meghatározása a növényzet reflexiós tulajdonságaiból ezen keresztül hogyan lehetséges alkalmazni közvetetten a biomassza-hozam becslésre. kidolgozása, amelyek input asználati modell kialakításával és a hiperspektrális távérzékelés nyújtotta új információk birtokában a bioenergetikai növények hatékony termesztésére alkalmas területek kerülnek meghatározásra egy innovatív támogató rendszer keretében. Reményeink szerint a projekt megvalósításával hatást tudunk gyakorolni a régió versenyképességére, az javítására, sikeres piaci vállalkozások létrejöttére a régióban. Cservenák R., Bakos L Mintaterületi komplex térinformatikai rendszer, Térinformatika, XIII. évf. 1. szám, pp Deákvári J., Kovács L., Papp Z., Fenyvesi L., Tamás J., Burai P., Lénárt Cs. (2008): Az AISA hiperspektrális -50. Lénárt Cs., adatok elérésében (The use and importance of fieldcomputinginaccessing of regionalenvironmentaldata). Erdei Ferenc II. Tudományos Konferencia, Kecskemét Mucsi L., Tobak Z.,Leeuwen B., Kovács F., Szatmári J. (2008): Analyses of spatial and temporalchanges of theurbanenvironmentusing multi- and hyperspectraldata In. Jürgens, C. (2008): RemoteSensing New Challenges of HighResolution, Bochum Szabó J., Pásztor L., Suba Z., VárallyayGy. 1998a. Integration of remotesensing and GIS techniquesinlanddegradationmapping, Agrokémia és Talajtan; 47: pp Tomor T., Enyedi P., Ambrus A. (2011): Developing a landusemodelforbioenergyproductionfor Gyöngyös smallregion. LandQuality and LandUseInformationinthe European Union Confernce, , Keszthely. ISBN , ISSN , JRC 61094, LB-NA EN-C 211
220 Inventory management models applicable to agricultural input- and output stocks 1, 2 3 Abstract e - Keywords: Összefoglaló. Kulcsszavak: De
221
222
223 , - - * C 0 1 * 0 1 * 2 C0 C1 2 * C 2 * C2 C1 C2 3 N - Q *
224 M
225 f 6 * 2C0 C1 * 1 7 X 1 2C0 C1 X2 * X3 2C0 X 2 3 X1 X C1 X 2 2C 0 bb l l 217
226 Helyzetfelmérés az agrárvállalkozások számítógéppel támogatott állat-törzsadat nyilvántartásának tükrében Condition survey in the light of computer supported records of animal basic data in agricultural Teschner Gergely 1, Csatai Rózsa 2, Troján Szabolcs 3 Abstract. Wide range of agricultural businesses uses different computer aided technologies especially applications supporting agricultural activities. To raise sustainable competitiveness, puts even higher responsibility on the leaders of companies, who want to their cost management ground with IT (Information Technology) services to substantiate the business strategies and tactical decisions. In our study we have made stocktaking at agricultural businesses, which due to its size and wide range of activities have probably an advanced IT background. The survey was supported by GOP / es K+F tender. To create the base datasets we have studied information systems of 20 agricultural businesses from different regions of the country. During the study we have investigated the register methods connected to the base activity, the IT background especially with animal stock data, animal breeding and animal healthcare processes, soil register, plant production, inventory management, human resource management in a connection with production resources. In this study we would like to show the specificity of animal stock data, register of animal breeding data which are strongly connected to IT area. Companies which were attended at this survey are not using complex business leading systems; an isolated IT structure supports the production-related information processing.the professionals statement is that the high level of the IT supports of animal breeding at investigated businesses is essential and even the most important condition for competitiveness is considered. Keywords: ERP systems, livestock Összefoglaló. Napjainkban informatika által nyújtott szolgáltatásokkal dasági vállalkozásoknál (Kft.-k, ZRt.-k), / es K+F pályázat keretében történt. azdasági célú szolgáltatásokat megvalósító speciális illesztési protokolljainak fejlesztése. megvizsgáltuk az alaptevékenységekhez kapcsolódó nyilvántartások módszereit, informatikai hátterét, különösen az állat-törzsadatokkal, állattenyésztési és állatorvosi -gazdálkodással, termelési eszközökkel összefüggésben.jelen tanulmányunkban az állat-törzsadatok, az állattenyésztési folyamatok nyilvántartása és a mindezekhez közvetlenül kapcsolódó informatikai területek sajátosságait tottságának feltételének tartják. Kulcsszavak: állattenyésztés, vezetés 1 Teschner Gergely Nyugat- - és Élelmiszertudományi Kar, teschnergergely@gmail.com 2 Csatai Rózsa Nyugat- - és Élelmiszertudományi Kar, csatair@mtk.nyme.hu 3 Troján Szabolcs Nyugat- - és Élelmiszertudományi Kar, trojansz@mtk.nyme.hu 218
227 1. Bevezetés, irodalmi áttekintés 1.1 Információ és döntés ll reagálni, ehhez gyors döntéseket h gtöbbször a múltban lezajlott történéseket kell elemeznie és fel kell ismerni milyen lényeges irányzatok, tendenciák érvényesülnek.( 1997) rások mellett már több évtizede jelen van az adat és az inform hatékony információvá) alakítása nélkül a vállalati vezetés nem hozhat jó döntéseket (Hannon, 2005). információ-feldolgozó szervezetké alrendszer a vállalkozás minden érintettjével (fogyasztók, szállítók, versenytársak, vállalati termékek, kapcsolatban áll. orán alakulnak információvá, amikor is a feldolgozáson átesve érdemben használhatóvá válnak a döntéshozó számára, aki értelmezi az információt és ennek alapján döntéseket hoz (Chikán, 2005). a döntéshozatal során, szakirodalmi vizsgálatok alapján hat et al. 2007). sokféle technológiát felvonultató és számos szolgáltatást nyújtó rendszer él egymás mellett a múlt - és jelenbeli tényeket közl számviteli számára j eket és információs rendszer (Kardos et al. 2007). chnológiák, nyújtott szolgálta általában beszélünk végrehajtási tevékenységet 1.2 Információtechnológia és agrárgazdaság p- - atók és a szaktanácsadói szolgáltató szervezetek dolgozói során több helyen törekedtek komplex információs rendszerek kialakítására, melyekben fontos célként szerepelt a módon az ügyvitel-orientált -támogató folyamat miatt megtorpant. Kezdetben közepes és nagyszámítógépekes, majd a személyi számítógépek térhódításával újabb nagy gazdaságoknál, hanem a gazdaságok széles köre számára ógépes rendszerek, (melyek nagyrészt valamilyen nyilvántartási, számviteli rendszerek voltak) fejlesztése és alkalmazása felgyorsult 219
228 - azt kiszolgáló számítástechnikai alkalmazások igénye, jellege, tí (Herdon, 2004). folyamataihoz (Székely et al. 2007). számítógépes környezetben (Groenendaal et al. 2004). Ezt támasztja alá egy másik tanulmány is, mely kapcsolatának fontosságára. (Hogeveen et al. 1994) és élelmiszeripari vállalkozásokban Hampel 2010-ben végzett élelmiszeripari társas vállalkozások körében folytatott kutatásai alapján megállapította származó információkra támaszkodnak. Emellett ugyanilyen mértékben hozzák meg döntéseiket más származó információkra alapo média szintén a gyakran használt információforrások közé ha magyar rendszerekre vonatkozó felmérés az utóbbi években nem készült. 2. Vizsgálat-anyag, módszer, elemzés iós rendszere alkozások jellemzésére a boxplot módszert választottuk, mely grafikus ábrázolás kifejezi a kvartiliseket, mediánt, minimum, maximum értéket valamint az outlier-eket (Kerékgyártó et al. 2007). Korreláció számítás segítségével kerestünk összefüggést a helyzetfelmérés során feltárt adatok és az állat-törzs adatok számítógépes nyilvántartása között. Ehhez az SPSS verziójú szoftvert használtuk. a téma szempontjából releváns követelmények kerültek kijelölésre: ft., ZRt.). hosszabb ideje jól prosperáló céget képviseljen, nagyszámú alkalmazottat foglalkoztasson, mutasson hajlandóságot szakmailag adekvát válaszok megadására a kérdésekre vonatkozóan., szakembereivel folytatott mélyinterjú információi kerültek. 220
229 1. ábra. értékesíté (2009) Forrás: Céginfó, saját szerkesztés (SPSS) 2. ábra. vállalkozások foglalkoztatotti létszáma (2009) Forrás: Céginfó, saját szerkesztés n foglalkoztatottal (2. ábra) 1 milliárd körüli mérle 845 milliós nettó árbevételt (1. ábra) és 72 milliós mérleg szerinti eredményt produkáltak átlagosan a 2009-es üzleti évben. okat koztatotti létszám (2. ábra), a 4 milliárd körüli (1. ábra), mérleg szerinti eredményük a vizsgált évben -285 és +331 millió Ft között mozgott. foglalkoztatott (2. ábra), 472 milliós (1. ábra) és -30 milliós mérleg szerinti eredmény volt a i paraméter (nagyságrendileg tehát a Kft-khez hasonló). 221
230 számítógépes struktúra támogatja az üzemgazda alrendszerek kerültek kijelölésre a vizsgálódás szempontjából: 1. Állat-törzsadatok, állattenyésztési és állatorvosi folyamatok 2. Földnyilvántartás, hivatalos dokumentációk 3. Növénytermesztés 4. Készletgazdálkodás -gazdálkodás 7. Termelési adatok 8. Tervezés, elemzés Jelen tanulmányunkban az állat-törzsadatok nyilvántartására, az állattenyésztési folyamatok, termelési adatok nyilvántartására vonatkozó részkutatásokat szeretnék bemutatni. foglalkozik állattartással, az 1. táblázat szerinti bontásban. 1. táblázat Tartott állatfajok Vállalkozások száma (db) csak szarvasmarhát tart 8 csak sertést tart 2 csak baromfit tart 2 szarvasmarhát és sertést tart 5 három vagy ennél több állatfajt tart 3 Összesen: 20 Forrás: primer vizsgálatok 3. Vizsgálati eredmények Általánosan elmondható, hogy az állatállományi adatok számítógépes kezelése az utóbbi 20 évben valamit nagy állatállományokkal rendelkezik, az állományadatok nyilvántartása informatikai a rendszer segítségével, tetszés 3.1 A szarvasmarha tenyésztés informatikai háttere l csak egynek nincs semmiféle számítógépes háttere az állományi és a tenyésztési adatok nyilvántartásához, 2 vállalkozásnál nem speciális programot, a többi 13-nál pedig a szarvasmarha tenyésztéshez már több programot használnak (3. ábra). szaporodásbiológiai folyamatokhoz tartozó információk rögzítésére. ználja néhány vizsgált vállalkozás, hogy kapcsolatot építenek ki a alában beke állnia és a kompatibilitást technikailag is kiépíteni). összes felhasználó igényt. 222


231 3. ábra. Szarvasmarhát tartó gazdaságok megoszlása a szoftverhasználat tekintetében Általános problémaként jelenik meg a programmal kapcsolatban, hogy nincs elektronikus kompatibilitása a könyvviteli rendszerrel, így az állatállományhoz tartozó számviteli feladásra szolgáló igényt mind az adatok számviteli rögzítésére vonatkozóan, mind pedig megnövekedése kapcsán számviteli vi rendszerbe, mindig aktuális képet kapnánk a vállalkozás gazdálkodásáról. tovább-feldolgozásra küldeni, esetleg az állománnyal kapcsolatos jelentésekhez is meg szolgáltatna a rendszer, kevesebb ráfordítással és hibával. 3.2 A sertéstenyésztés informatikai megoldásai nt program a szarvasmarha tartóknál. tenyésztési folyamatok nyilvántartására, minden adminisztráció papír alapon folyik. Két helyen a ram a segítség a nyilvántartásoknál, 3 cégnél alkalmazzák a RÖFI, programot használja (4. ábra). az igényeket, viszont a vállalati szoftverkörnyezettel kompatibilitási problémáik vannak. 4. ábra. Sertést tartó gazdaságok megoszlása a szoftverhasználat tekintetében 223
232 Egy helyen találkozunk olyan rendszerrel, amelynél a KONT-net ügyviteli rendszeren belül a készletgazdálkodási modulon keresztül regisztrálják a sertés állományi adatokat és ezzel összefüggésben a készletváltozásokat. információt, például Excel táblázatokból, naplókból A baromfitenyésztéssel foglalkozó vállalkozások nyilvántartási rendszere ében 3 gazdaság foglalkozik baromfitartással (tyúk -tartás, keltetés, brojler hízlalás). Két üzemben egyáltalán nem használnak számítógépes nyilvántartást a nagy létszámú állományra vonatkozóan. Papír alapon vezetnek állomány-változásokra vonatkozó analit értékesítés (növendék állat, selejt állat, tojás, készáru) állatállomány egyéb mozgása szaporulat (keltetés) korosbítás, tárgyi eszközzé nyilvánítás (tojóvá). setben az analitika alapján havonta történik - manuális módon - a számviteli rendszerben. kiépítése, továbblépve ezen az integrált rendszer szükségességét is megfogalmazzák. Egy cégnél (ami kizárólag baromfitartással foglalkozik) találunk kiépített számítógépes hátteret az állattörzsadatok feldolg alkalmazza, rendszeren alapul, azonban nem egyedi, hanem állományi alapú un. batch típusú a napi termelés (tojás), mérlegelési adatok rögzítése szempontjából. Ezek az adatok azonban nincsenek kapcsolatban a legfontosabbnak azt jelölték meg, hogy az állat törzsadatok és az állomány nyilvántartási adatok egy rendszerben, integráltan legyenek kezelve, a készletmozgások automatikusan jussanak el nyvi könyvelésre. feldolgozása is manuálisan történik. ólak szerinti bontásban, oportok elkülönített kezelésére, a tenyésztéshez kapcsolódóan iportokat készítsen a kelési százalékra, a termelési mennyiségre, elhullási százalékra, a termékenységre vonatkozóan, kezelje a tenyésztés melléktermékeit: az árutojást és trágyahozamot, tárolja a tojások eredetét (telep, ól) és tojási idejét, ezek legyene 3.4. A juhtenyésztést támogató nyilvántartások folyik juhtenyésztés (sertés-, szarvasmarha- és tevékenység mellett). Kizárólag papír alapú nyilvántartásban testesül meg az állománynapló, a korcsoportok kezelése. Tenyésztési adatok is hasonló módon kerülnek rögzítésre, a fentiek szerint részletesen megfogalmazott információs igény mellett. 224
233 3.5. Összefüggésvizsgálat 2. táblázat. Összefüggés a vizsgált vállalkozások alkalmazotti létszáma és a telepirányítási rendszer között. száma Rendelkezésre áll telepirányítási rendszer? Rendelkezésre áll száma telepirányítási rendszer? Pearson Correlation 1 0,443 Szignifikanciaszint 0,050 Elemszám Pearson Correlation 0,443 1 Szignifikanciaszint 0,050 elemszám Forrás: primer vizsgálatok, saját számítás (SPSS) Korreláció számítás segítségével vizsgáltuk a telepirányítási rendszerek megléte, használata és a helyzetfelmérés során feltárt cégadatok közötti összefüggést. 5%-os szignifikancia szinten az alkalmazottak száma és a telepirányítási rendszer használata között van gyenge kapcsolat. Éves árbevétel Tevékenységi körök száma ményünk szerint a mintába vont 4. Összefoglaló következtetések ztési folyamat bonyolultsága, vizsgált vállalkozásnál nagyon megosztott helyzetet tapasztaltunk a papír alapú nyilvántartástól, a, a speciális, sertéstenyésztést támogató programokig. nem volt mint a szarvasmarha tartó támogatása a legkevésbé kiforrott. a vállalatot egészében kezelni tudó komplex megalapozottnak bizonyultak. z általunk jogszabályoknak való megfelelés könnyebbé válik. Jelen tanulmány folytatásaként megtérülési vizsgálatokkal támasztjuk alá, vagy cáfoljuk egy komplex vállalatirányítási szoftver bevezetését. Hivatkozások p. Groenendaal, H.- Galligan, D.T. - p.. 225
234 Hampel, Gy. (2010): Információforrások használatának gyakorisága és információs rendszerek az élelmiszeripari társas vállalkozásokban felmérés a Dél- tika pp Issue4. pp. 55- pp Hogeveen H.- Varne - - Dill D.E. - Noordhuizen-Stassen E. N. - pp Kacsukné - - p. - Szántó,I. - p Kerékgyártó Gy.- - Kiadó. pp Kövesi, J.- Gazdaságtudományi Egyetem. Typotex Kiadó. p ) Székely, Cs - - Debreceni Egyetem, Phd dolgozat, 94.p. 226
235 T -Specifikus Térinformatikai e-szaktanácsadási rendszer Production-site-specific GIS frame Gonda 1, Ambrus Andrea 2 3 Abstract. -site- -site Keywords: - Összefoglaló. A -Specifikus Térinformatikai e- - e-szaktanácsadási rendszer A - nnak Kulcsszavak: 1. Bevezetés ( A a - k a f piaci és ár nak, a a

236 2. Anyag és módszer Specifikus Térinformatikai e- 3. Modellkidolgozás folyamata a Gyöngyösi kistérségben - A medence 1.ábra. 228

237 2. ábra - - a a, a az, az - a oktatás a 3.1 TEST megoldandó feladatai ére, a ra, t t, a kukoricát, a osztarepcét 229

238 - értéke, -, A is fontos szempont kutatásunkban, a biomassza -ban és, Ca,, z, - 3.ábra. 230
![Agrárinformatika 2011 Konferencia / Agricultural Informatics 2011 Conference $ *\ QJ\ V NLVWpUVpJEHQ PLQWDWHU OHWHNHW YiODV]WRWWXQN NL PHO\HN iowdo UHSUH]HQWiOQL SUyEiOWXN WDODMWDQL és NOLPDWLNXV](/docs-images/73/68362253/images/239-0.jpg "DGRWWViJDLW D NLVWpUVpJQHN $ NLYiODV]WRWW PLQWDWHU OHWHN 'RPRV]Oy 1DJ\UpGH *\ QJ\ VKDOiV] pv *\ QJ\ VSDWD WHOHS OpVHNKez tartoznak ieud 4.ábra.")
239 Agrárinformatika 2011 Konferencia / Agricultural Informatics 2011 Conference $ *\ QJ\ V NLVWpUVpJEHQ PLQWDWHU OHWHNHW YiODV]WRWWXQN NL PHO\HN iowdo UHSUH]HQWiOQL SUyEiOWXN WDODMWDQL és NOLPDWLNXV DGRWWViJDLW D NLVWpUVpJQHN $ NLYiODV]WRWW PLQWDWHU OHWHN 'RPRV]Oy 1DJ\UpGH *\ QJ\ VKDOiV] pv *\ QJ\ VSDWD WHOHS OpVHNKez tartoznak ieud 4.ábra. $ PLQWDWHU OHWHN V]iQWyWHU OHWHL OHMWĘNDWHJyULD WpUNpSHQ PHJMHOHQtWYH $ WDODMWDQL pv NOLPDWLNXV DGRWWViJRNDW puwpnhoyh H]HQ PLQWDWHU OWHN DODSMiQ NpSHVHN YDJ\XQN D NtYiQW PRGHOOW IHOiOOtWDQL pv J\DNRUODWEDQ DONDOPD]KDWy DMiQOiVW DGQL *\ QJ\ V NLVWpUVpJ WHU OHWpQ JD]GiONRGyN V]iPiUD $ PRGHOO PĦN GĘNpSHVVpJpKH] HOHQJHGKHWHWOHQQHN WDUWRWWXN- D WHU OHWVSHFLILNiFLyQDN PHJIHOHOĘHQ D NLVWpUVpJ PH]ĘJD]GDViJL JpSiOORPiQ\iQDN D IHOPpUpVpW DPHO\ DGDWRN D YHWpVIRUJyN YDODPLQW D] DMiQORWW WHUPHV]WpVWHFKQROyJLiN PHJKDWiUR]iViKR] QpON O ]KHWHWOHQ LQIRUPiFLy $ JpSiOORPiQ\ IHOPpUpVpW két OpSpVEHQ KDMWRWWXN YpJUH (OVĘ OpSpVEHQ D WpUVpJ QDJ\ YiOODONR]iVDLQDN D N UpW NHUHVW N IHO pv W OWHWW QN NL YHO N NpUGĘtYHW PDMG H]W N YHWĘHQ a PRGHOOWHOHS OpVHN VV]HV JD]GiONRGyMiW WHOHIRQRV PHJNHUHVpV ~WMin OHNpUGH]W N $KKR] KRJ\ PHJIHOHOĘ V]DNWDQiFVDGiVW DGKDVVXQN V] NVpJHVQHN WDUWRWWXN IHOPpUQL KRJ\ Dzok a JD]GiONRGyN DNLN YiOODOWiN D] DJUiU-N UQ\H]HWJD]GiONRGiV FpOSURJUDPRW PLO\HQ V]LQWHQ WXGtak DONDOPD]NRGQL D] iowdoxn YiODV]WRWW FpOSURJUDP N YHWHOPpQ\HLKH] YDODPLQW H] PLO\HQ KDWiVVDO YDQ D JD]GDViJXNUD &poxqn YROW WRYiEEi PHJLVPHUQL D NpVĘEEL WHUYHLNHW D SURJUDPPDO NDSFVRODWEDQ HJ\ HVHWOHJHV ~MEyOL PHJKLUGHWpV VRUiQ 7HUPpV]HWHVHQ H]HQ FpOSURJUDPKR] FVDWODNR]y JD]GiONRGyN V]iPiUD D SURJUDPXQN DMiQOiViQDN ILJ\HOHPEH NHOO YHQQL KRJ\ D] $JUiU-N UQ\H]HWJD]GiONRGiVL FpOSURJUDP HOĘtUiVDLQDN LV PHJ NHOO IHOHOQL N DPHO\ V]iPRV NRUOiWR]y WpQ\H]ĘW MHOHQWKHW SpOGiXO D YHWpVYiOWiV NLDODNtWiViEDQ 0LXWiQ PLQGHQ V] NVpJHV LQSXW DGDW UHQGHONH]pVUH ioo D PHJIHOHOĘ IRUPiEDQ WpULQIRUPDWLNDL V]RIWYHUHQ HJ\HVtWpVUH NHU OQHN HJ\ DGDWWiEOi]DWEDQ $ OHJNLVHEE WHU OHWL HJ\VpJHW MHOHQWĘ SROLJRQRN D WDODMWDQL SDUDPpWHUHN iowdo DGRWW HJ\VpJHN OHV]QHN 231
240 3.2 A TEST outputjai része Eredmények A rendszert a nek teszi A pé ítási és és A Az adat- - s at és Ezen i mi- A a 232
241 1. táblázat. szaktanácsadási rendszer 4. Következtetések, javaslatok: és ne a a fen sem i nem zési Az adatbázis, A nak a a is, nek Hivatkozások 233
242 E-tananyagok E-learning materials from TÁMOP project s materials Aszalós László 1, Bakó Mária 2 Abstract. There is a growing demand for e-books among readers. Whether the novelty or the beneficial properties is the reason of this demand, we need to use this, and give the textbooks in this format to our students. The cost of the printing and the distribution disappear in the case of e-books, we need to honor the author and the editor only, and a huge amount could be saving. By the competition of TÁMOP several textbook had developed, and we will show in this article how easily we can generate the e-book variants. Keywords: e-book, DocBook, textbook Összefoglaló. A könyvolvasók között egyre nagyobb az igény az e-könyvekre. Akár az újdonság varázsa, akár az e- számára e-könyv formájában átadni a tankönyveket. Mivel ekkor a nyomtatás és terjesztés költségei meg- tananyag- munkával -tankönyvek. Kulcsszavak: e-köny, DocBook, jegyzet 1. Bevezetés szülessenek, ne a fiókban porosodó kéziratokat adják ki újra és újra. Annak érdekében, hogy az érintett irodalomként kezelése, napja elterjedését. A több ezer forintos jegyzet fénymásolása csak százasokba kerül, s ha sikerül - és filmiparnak is át kell alakulnia a ösztönzésének is újabb alapokra IA (Digitális Irodalmi Akadémia, 1998), ahol a ten KFDT oldalra (Kempelen Farkas Digitális Tankönyvtár, 2005) kerülnek fel, szabad hozzáféréssel bárki számára. Ebben a formában lassan már a mobiltelefonokat és tévékészülékeinket is ide soroljuk. Az elmúlt 1-2 évben kezdenek elterjedni az e-könyvolvasók, s úgy gondoljuk, hogy ideje lenne Ebben a cikkben azt mutatjuk be, hogy mire érdemes -dokumentumokról szólunk, majd a tankönyv-pályázatot mutatjuk be, különös tekintettel az elvárt formai kritériumokra. Miután több tankönyv? 1 Debreceni Egyetem, Informatikai Kar laszalos@unideb.hu 2 Debreceni Egyetem, Gazdálkodástudományi és Vidékfejlesztési Kar bakom@unideb.hu 234
243 2. E-könyv 2.1. E-könyv történelme Több évtizede velünk él, körülvesz bennünket az e-book. Gondoljunk csak a Project Gutenberg-re (Project Gutenberg, 1971) köz rendelkezésére bocsájtja. A jelenlegi állomány 36 az e-kön Hazánkban 1995-ben indult a Magyar Elektronikus Könyvtár (Magyar Elektronikus Könyvtár, 1995) által ingyen a közzé bocsájtott friss tanulmányok megtalálhatóak a könyvtárban, ám az e-könyv formátum még mostohagyerek itt. A Google, mely szinte egyeduralkodóvá vál rendelkezik (Google Könyvek, 2011), miután több amerikai könyvtár teljes állományát digitalizálta. A kapcsolódó extrákból profitálni: adott fogalmat tartalmazó könyvet eladni a felhasználónak Formátumok serege Az e- raktereket tartalmazó kvázi szabványos szövegfájl- én másolhat ki részleteket, vagy át is szerkesztheti, ami megálmodott formátumban éri el az összes olvasó az anyagot. olvashatnánk e-könyvet, a gyufaskatulyányi mobiltelefontól egészen a plazmatévéig. Viszont ekkor az egységes külalak kezd hátrá -kevésbé eleget tesz a webes szabvány: a HTML 1994) lhasználó Legújabb irányzatok A HTML szabványon alapul az EPUB (EPUB, 2008) és alkalmazás va -re (ibooks, 2011), vagy Aldiko Androidra (Aldiko, 2011). Léteznek ezen túl olyan eszközök, melyek direkt ilyen dokumentumok olvasására készültek, ezek az e-book reader-ek -book readers, 2011), vagy magyarul e-könyvolvasók. Ez utóbbiaknál igen hasznos az eink technológia (E Ink, 2005) nyomtatott szöveghez. Nem elhanyagolható az sem, hogy az ilyen készülékek csak lapozáskor 235

244 tucatnyi könyvet is elolvas. Mindezek mellett egy ilyen készülék több száz könyvet is képes tárolni, azaz az egyetemi hallgató teljes képzésének minden s azokat bárhova elviheti magával és bármikor felhasználhatja. Az eszköz képes teljes szöveges a hagyományos tankönyvekhez képest. 3. Tananyag-pályázat KFDT (Kempelen Farkas Digitális Tankönyvtár, 2005) Az Agrármérnöki M.Sc. szak tanagyagfejlesztése (TÁMOP /1/A ) és A Debreceni Egyetem környezetgazdálkodási és természetvédelmi mérnöki Msc szakok tananyag fejlesztése (TÁMOP /1/A ) pályázata eredményeképp ok formátumban (Walsh, 2011) -ban szöveget szerkeszteni, egy-két informatikustól eltekintve mindenki valami segédprogramot használ erre. (Bár leginkább az a rogram (Pixware, 2003) A program sok jó tulajdonsága között igen fontos, hogy ingyen, megkötések nélkül kipróbálható, és a leginkább elterjedt operációs rendszerek mindegyikén használható. 1. ábra. láthatjuk a végeredményt. A DocBook strukturáltságát kihasználhatjuk, s ahogy a képen látjuk, az 236
245 A kép jobb oldalán látható, hogy a szöveghez különféle meta-információkat, hogy a szöveg megfelel-e a szabványnak. A DocBook szabvány egy igen vastag kézikönyv lenne. Felmerül az olvasóban, hogy mire való ez miért nem jó a megsz 2006). foglalkozik, hanem annak a külalakjával, még akkor - ordulását, de a képletben keresés tt pedig lassan már csak a kereséssel tudunk felülkerekedni. A DocBook szabvány csak a jegyzet tartalmát határozza meg, a külalakról semmit sem feltételez. valamint a FOP, DbLatex (Guillon, 2009) vagy xmlroff (xmlroff, 2008) (Veillard, 2007) eten megtalálható docbook.css állományok. Nagyobb kiadók - melyek DocBook formátumban fogadják a könyveket, természetesen erül. Van egy elképzelése, hogy hogyan hanem nullától. Termés bonyolultabb képletet megadni, még az alsó- k az ábrák. A nyomdász feladata volt a szöveget kiszedni. Hiába volt tudása kimagasló, nem feltétlenül egy kefelenyomatot, az abban az általa talált hib anyagok ellentmondanak a nyomdász szakma több évszázados hagyományainak. Ezért érzésünk szerint a visszalépés, 4. Tapasztalatok Miután részünk volt a TÁMOP tananyag fejlesztési projektben, és több évtizedes, mögött, úgy érezzük ével. Bár ez alól kivétel a bonyolultabb képletek esete. A HTML formátum képes a MATHML 237

246 véletlenül eshet egybe. szellemiségét és szabályait. Például egy ábra egy egységet képez. Ennek része az általunk is szövegre, mely felsorolja, hogy mi is látható az ábrán. Ennek eredményeképp a felolvasó, szöveg további része. Nagy kár fél oldalak is üresen maradnak, pedig -oda mozgatásával megoldhatjuk ezt a helyzetet, de sokkal jobb lenne, ha ez automatikusan menne. Hogy ezt miért hoztam fel? A DocBook állományok feldolgo -ban kiszedet szúrjuk be a DocBook anyagba. Ez viszont azzal jár, hogy a felolvasó program nem tud mit kezdeni a képpel, pedig csak szöveges adat van rajta. további sorsa. képzésére. 5. E-tankönyvek a gyakorlatban Az e- -könyvolvasón könyveket, mint a monitoron. Ez kifejezetten igaz a hibakeresés fázisában. Környezetvédelmi szempontokból is jobban járunk, s megismételt fázisban nem nyomtatjuk ki az egész könyvet újra és újra, hogy egy-két elütést megtaláljunk. Innen jött az felvetés, hogy a tananyag-pályázat keretében készült könyvek olvashatók-e e-könyvolvasókon, vagy sem? Ahogy a trendeket látjuk, a jelenlegi középiskolások részben cáfolva azt a vélekedést, hogy kevesebbet olvasnak egyre nagyobb számban vásárolnak e-könyvolvasó eszközöket. Másrészt az általuk használt mobiltelefonok egy- -könyvek megjelen kiválóan megfelel. 2. ábra -könyv menedzser program 238


247 -jegyzet? Ott tartunk, hogy a projekt keretében elkészült a tananyag. alkönyvtárat, melyben a képek találhatóak, valamint a meta alkönyvtárat, mely a könyvre vonatkozó, Ha az xlstproc programot használjuk, akkor az xsltproc /docbook.xsl book.xml > book.html megnyithatjuk. Az Amazon cég (Mobipocket, 2000) formátumú e-könyvet gyárthatunk a kindlegen /book.html parancs kiadásával. Ez használható (Goyal, 2010)program használatával, melyet a 2. ábrán láthatunk. -könyv formátumra konvertáljuk, s ezután 3. ábra. Mobipocket formátumú jegyzet Vettünk egy, a projekt keretében elkészült jegyzetet. A DocBook forrást mind a kindlegen, mind a -könyvolvasón -nel generált állományról. Az itt látható folyamatos volt a szöveg, még feje -vel nyert változatnál már a tartalomjegyzéken belül is lapdobások voltak a fejezetekhez tartozó alfejezetek listája után. Viszont csak ez utóbbi bontotta a dokumentumot fejezetekre abban a tekintetben, hogy könnyedén navigálhattunk közöttük. kép mérete nem változik. Miután a táblázat csak szöveget tartalmaz, érdemes lett volna szövegként olyan területek 239
248 6. Összefoglalás -könyveket, melyek mára már saját eszközhöz jutottak, mellyel az olvasás olyan kényelmes, mint a könyv olvasása. Ám ezek az eszközök tankönyvek olvasására. Ehhez természetesen tananyag kell, mégpedig me - szükség van a szabványoknak 100 százalék - gazdáinak feladata, hogy a megszokott formátumok mellett az e-könyvolvasók formátumaiban is Hivatkozások Aldiko. (2011). Letöltés dátuma: , forrás: (2011). Apache FOP. Letöltés dátuma: , forrás: -book readers. (2011). Letöltés dátuma: , forrás: Wikipedia: - Digitális Irodalmi Akadémia. (1998). Letöltés dátuma: , forrás: EPUB. (2008). Letöltés dátuma: , forrás: Wikipédia: Google Könyvek. (2011). Letöltés dátuma: , forrás: -ebook.com/ uma: , forrás: ibooks. (2011). Letöltés dátuma: , forrás: itunes: Kempelen Farkas Digitális Tankönyvtár. (2005). Letöltés dátuma: , forrás: Magyar Elektronikus Könyvtár. (1995). Letöltés dátuma: , forrás: mek.oszk.hu/ Mobipocket. (2000). Letöltés dátuma: , forrás: Project Gutenberg. (1971). Letöltés dátuma: , forrás: Walsh, N. (2011). DocBook 5: The Definitive Guide. Letöltés dátuma: , forrás: xmlroff. (2008). Letöltés dátuma: , forrás: 240
249 The place and role of agricultural information systems in the higher education 1 2 Abstract. value both the theoretical and the practical knowledge - disciplines a profession in real- primarily in case of economic sciences - - Keywords Összefoglaló. Az információ értékként jelenik meg elméleti és gyakorlati tudásanyagát egyaránt - Kulcsszavak: információ információs rendszerek 1. Bevezetés amikor ami 1 Gazdaság- és 241


250 tudáscontrolling - ek - 2. kitöltésre 58%- z 13% 1. ábra 242
251 - Az i 1. táblázat. n (a,b) Multinacionális vállalat információáramlásának Pályázatok, statisztikai nyilvántartások Chi- 12, , ,6802 df 3,0000 3,0000 3,0000 0,0061 0,0058 0,0054 száma a - - -es 243


252 2. ábra. - 3 gy képzés 3. ábra. Az - 244


253 2. táblázat. rendszer fogalmá a rendszerszeml- - ná- lem szá Legyen képes listák, jelentések Chi- 6,94 df , % 90% 80% 70% 60% 50% 40% 30% 20% 10% 0% Középfokú szakmai Legmagasabb iskolai végzettség Egyetemi A képesség re vonatkozó elvárás foka 4. ábra. 3. Agrárinformációs rendszerek oktatása Magyarországon - köré 245
254 - lkodáshoz 3. táblázat. Károly i információs rendszerek magyarorszá Szegedi Szolnoki Agrárinfor mációs rendszerek Alkalma információs rendszere k rendszere k Informá ció menedzs Inform ációs rendsze rek Nincs informá ciós rendsze rekhez kapcsol ódó tantárgy Szakér rendsz erek gazdálkodás - X X X X X X X X X X X X X X X X X* X X X X X X X* X X X X X *: rendelkezik az intézmény olyan szakkal, amelyen nem történik információs rendszer oktatás, a többi intézménnyel ellentétben X Az információs rendszerek gazdasági és vidékfejlesztési agrármérnöki, informatikus és szakigazgatási agrármérnöki, regionális és környezeti gazdaságtan, vidékfejlesztési agrármérnöki e mindenhol A képzések - 246
255 forrás- 4. Következetések, javaslatok információs az i meg Csekély hangsúlyt fektetnek integrált vállalati információs rendszerek használatára - információgazdálkodással e Hivatkozások
256 Néhány e-szakigazgatási szolgáltatás bemutatása Presentation some of e-services for farmers Botos Szilvia 1, Cseh András 2 Szénás Szilárd 3 Összefoglaló: gazdaságban. fontos a szélessávú internet hozzáférés többek között az e- i és hogy a gazdák milyen módon és milyen célokra használják az internetet. Kulcsszavak: vidék, szélessáv, IKT használat, gazdálkodók Abstract: termine significantly the efficiency of farming. -administration is growing, broadband in - of internet access and the characteristics of broadband infrastructure in questionnaire. Keywords: rural, broadband, ICT usage, farmers 1. Bevezetés A J bevallások készítésére az állam intézmények számára (Szénás Sz et al, 2008). A magas jövedelemmel etrendszerét a nemzeti és az 1.1 Az elektronikus közigazgatás (e-közigazgatás) rövid bemutatása Sok szakember állítja változást hozhat, mert kialakulhat -demokrácia 1 - és Gazdálkodástudományok Centruma botos.szilvia@gmail.com 2 - és Gazdálkodástudományok Centruma csehandras83@fre .hu 3 HBM-i Kormányhivatal szenassz@mgszh.gov.hu 248
257 hogy az e-közigazgatás (e-government), mely mind költséges eszközrendszere (PC), mind viszonylag magas tudásigénye (PC és Internet használat) okán ún. digitális szakadékot hoz létre a társadalomban. legitimizálhatnak olyan modern közszolgáltatási megoldásokat, amelyeket a társadalomnak csak egy- az e-közigazgatási megoldások kevésbé kihasználtak, mert kisebb hagyományos eljárásokon nyugvó közigazgatási feladatok ellátásának -government Az igazság a két megközelítés között helyezkedik el hogy az internet segítségével számos o, kormányzati intézmények esetén. adódóan, lakosság és a közigazgatási szervek között zajlik. A kormányzati e-szolgáltatások terjedését hogy mindenki rende (Csótó M, Herdon M 2008). 1.2 Next Generation Access network) még mindig Keresleti elégtelenségek: Kulcsfontosságú ténye költségeit. A ker A gazdasági teljesítmény alacsonyabb azokban a régiókban, mel 2. Anyag és módszer - válaszadás teljesen önkéntes volt. Nagyságrendileg személy tagadta meg a válaszadást az informatikában való járatlanság valamit a saját informatikai informatikai 249
258 leíró statisztikai módszerek segítségével vizsgáltuk. lják, visszakeresik, továbbítják a gazdaság döntéshozatalt (Hetyei, 2002). Számos közigazgatási tényvizsgálat kimutatta, hogy az és az informatika egybefonódó fogalmak. Maga a CRM egy olyan nyil más fontos megvizsgálni, hogy az egyéni gazdálkodók mikortól rendelkeznek saját internet hozzáféréssel. Az egyéni gazdálkodók többsége a termelését a gazdálkodás az eredményének növelésére. Az 1. ábra mutatja a saját -használat és internet hozzáférés, az egyéni gazdálkodók között. PC- - -ban mértékben s ábra. - (teljes 250

259 2. ábra. Az internet használat mértéke az egyéni gazdák körében (n=151) között. Az internet használat mértéke (1 A gazdálkodók körében a web böngészés célját a 3. ábrán mutatjuk be. Láthatjuk az ábrán hogy leg -szolgáltatások. Az internetes kereskedelem használatának alacsony mértéke több tos a személyes találkozó 3. ábra. A web böngészés céljainak mértéke az egyéni gazdálkodók körében, az életkoruk szerint 251
 webold ítást ti elektronikus szolgáltatásokat. A Piaci élelmiszereket állítan álkodó 3.")
260 4. ábra. használó egyéni gazdák között (n=135) az egyéni gazdálkodók milyen mértékben látogatják az egyes kormányzati és szakigazgatási szervek oldalait (4. ábra). A Vidékfejlesztési Hivatal (MGSZH) webold ítást ti elektronikus szolgáltatásokat. A Piaci élelmiszereket állítan álkodó 3.1 Az e- A web GN elektronikus benyújtása minden Agrár- - -ig. kusan is
 eleget tehetnek elektroniku A GN és Nitrát")
261 kattintva Az elektronikus adatszolgáltatás (5. ábra). Az ele - (ÁNYK). vastag kliens Azon AKG- számítástechnikai ismeretekkel, a falugazdászok segítségével az úgynevezett GN vastag nem) eleget tehetnek elektroniku A GN és Nitrát vastag kliens esetében a falugazdászok jogosultsága csak a benyújtási 5. ábra: MGSZH 253
Felhívás. Agrárinformatika Folyóirat / Journal of Agricultural Informatics. folyóiratban való publikálásra. http://journal.magisz.
 Felhívás A folyóiratról Agrárinformatika Folyóirat / Journal of Agricultural Informatics folyóiratban való publikálásra http://journal.magisz.org A szakterület számára hiánypótló magyar/angol nyelvű folyóirat
Szakmai beszámoló a MAGISZ 2011. évi tevékenységéről (Az elnökség beszámolója) Dr. Herdon Miklós elnök. 2012.04.20. MAGISZ Közgyűlés 1
 Dr. Herdon Miklós elnök. 2012.04.20. MAGISZ Közgyűlés 1") Szakmai beszámoló a MAGISZ 2011. évi tevékenységéről (Az elnökség beszámolója) Dr. Herdon Miklós elnök 2012.04.20. MAGISZ Közgyűlés 1 Tartalom A.) Közgyűlés B.) Elnökségi ülések C.) Rendezvények C1.) Agrárinformatikai
Szakmai beszámoló a MAGISZ 2011. évi tevékenységéről (Az elnökség beszámolója) Dr. Herdon Miklós elnök 2012.04.20. MAGISZ Közgyűlés 1 Tartalom A.) Közgyűlés B.) Elnökségi ülések C.) Rendezvények C1.) Agrárinformatikai
Agrárinformatika 2011 Konferencia Innovatív információtechnológiák az agrárgazdaságban 2011. november 11-12. Debrecen
 Agrárinformatika 2011 Konferencia Innovatív információtechnológiák az agrárgazdaságban 2011. november 11-12. Debrecen Agricultural Informatics 2011 Conference on Innovative Information Technologies in
Szakmai beszámoló a MAGISZ (elnökségének) 2005 évi tevékenységéről
 2005 évi tevékenységéről") Szakmai beszámoló a MAGISZ (elnökségének) 2005 évi tevékenységéről Dr. Herdon Miklós elnök 2006.02.23. MAGISZ Közgyűlés 1 Tisztújító közgyűlés - 2002.02.09 MAGISZ Emlékérem A közgyűléssel összekapcsolt
Szakmai beszámoló a MAGISZ (elnökségének) 2005 évi tevékenységéről Dr. Herdon Miklós elnök 2006.02.23. MAGISZ Közgyűlés 1 Tisztújító közgyűlés - 2002.02.09 MAGISZ Emlékérem A közgyűléssel összekapcsolt
Hasznos és kártevő rovarok monitorozása innovatív szenzorokkal (LIFE13 ENV/HU/001092)
") Hasznos és kártevő rovarok monitorozása innovatív szenzorokkal (LIFE13 ENV/HU/001092) www.zoolog.hu Dr. Dombos Miklós Tudományos főmunkatárs MTA ATK TAKI Innovative Real-time Monitoring and Pest control
Hasznos és kártevő rovarok monitorozása innovatív szenzorokkal (LIFE13 ENV/HU/001092) www.zoolog.hu Dr. Dombos Miklós Tudományos főmunkatárs MTA ATK TAKI Innovative Real-time Monitoring and Pest control
A modern e-learning lehetőségei a tűzoltók oktatásának fejlesztésében. Dicse Jenő üzletfejlesztési igazgató
 A modern e-learning lehetőségei a tűzoltók oktatásának fejlesztésében Dicse Jenő üzletfejlesztési igazgató How to apply modern e-learning to improve the training of firefighters Jenő Dicse Director of
Ister-Granum EGTC. Istvan FERENCSIK Project manager. The Local Action Plans to improve project partners crossborder
 Expertising Governance for Transfrontier Conurbations Ister-Granum EGTC Istvan FERENCSIK Project manager The Local Action Plans to improve project partners crossborder governance «EGTC» URBACT Final conference
INTELLIGENT ENERGY EUROPE PROGRAMME BUILD UP SKILLS TRAINBUD. Quality label system
 INTELLIGENT ENERGY EUROPE PROGRAMME BUILD UP SKILLS TRAINBUD WP4: Deliverable 4.5 Development of voluntary qualification system Quality label system 1 INTELLIGENT ENERGY EUROPE PROGRAMME BUILD UP SKILLS
EEA, Eionet and Country visits. Bernt Röndell - SES
 EEA, Eionet and Country visits Bernt Röndell - SES Európai Környezetvédelmi Ügynökség Küldetésünk Annak elősegítése, hogy az EU és a tagállamok a szükséges információk alapján hozhassák meg a környezet
KÉPI INFORMÁCIÓK KEZELHETŐSÉGE. Forczek Erzsébet SZTE ÁOK Orvosi Informatikai Intézet. Összefoglaló
 KÉPI INFORMÁCIÓK KEZELHETŐSÉGE Forczek Erzsébet SZTE ÁOK Orvosi Informatikai Intézet Összefoglaló Tanórákon és az önálló tanulás részeként is, az informatika világában a rendelkezésünkre álló óriási mennyiségű
Pécsi Tudományegyetem Közgazdaságtudományi Kar Regionális Politika és Gazdaságtan Doktori Iskola
 Pécsi Tudományegyetem Közgazdaságtudományi Kar Regionális Politika és Gazdaságtan Doktori Iskola Kutatói együttműködések Web 2.0-es PhD kutatói közösség Doktori értekezés tézisei Készítette: Szontágh Krisztina
Skills Development at the National University of Public Service
 Skills Development at the National University of Public Service Presented by Ágnes Jenei National University of Public Service Faculty of Public Administration Public Ethics and Communication 13. 12. 2013
Sebastián Sáez Senior Trade Economist INTERNATIONAL TRADE DEPARTMENT WORLD BANK
 Sebastián Sáez Senior Trade Economist INTERNATIONAL TRADE DEPARTMENT WORLD BANK Despite enormous challenges many developing countries are service exporters Besides traditional activities such as tourism;
Újraszabni Európa egészségügyét II. rész
 Újraszabni Európa egészségügyét II. rész A dokumentum első részét lapunk előző számában olvashatják Tisztelt Olvasóink! Ezzel a jelszóval indítja programdokumentumát a European ehealth Task Force munkacsoport
Áttekintés a Jövő Internet agrárgazdasági alkalmazási lehetőségeiről Az NTP FI Agrár- és Élelmiszeripari tagozat
 Áttekintés a Jövő Internet agrárgazdasági alkalmazási lehetőségeiről Az NTP FI Agrár- és Élelmiszeripari tagozat Herdon Miklós, Botos Szilvia, Szilágyi Róbert Jövő Internet Nemzeti Technológiai Platform
Agrárinformatikai kutatási-fejlesztési eredmények disszeminációja
 Magyar Agrárinformatikai Szövetség Hungarian Association of Agricultural Informatics Agrárinformatika Folyóirat. 2012. 3. évfolyam 1. szám Journal of Agricultural Informatics. 2012 Vol. 3, No. 1 Agrárinformatikai
Az INNOGROW projekt bemutatása
 Az INNOGROW projekt bemutatása Dancsecs Roland projektmenedzser projektmenedzser roland.dancsecs@pannonnovum.hu Regionális Stakeholder Csoportülés, Győr, 2016.09.08 INNOGROW proposal Regional policies
SZAKMAI BESZÁMOLÓ EVK SZAKKOLLÉGIUM. BESZÁMOLÓ: A 2014/2015 A Pallas Athéné Domus Scientiae Alapítvány pályázatára 2014/2015-ÖS TANÉV
 SZAKMAI BESZÁMOLÓ EVK SZAKKOLLÉGIUM BESZÁMOLÓ: A 2014/2015 A Pallas Athéné Domus Scientiae Alapítvány pályázatára 2014/2015-ÖS TANÉV 1 Tőzsdekurzus A kurzus fókuszában - az elméleti bevezetőt követően
A WHO HRH támogató tevékenysége és prioritásai A WHO és a Semmelweis Egyetem Egészségügyi Menedzserképző Központja közötti együttműködés
 A WHO HRH támogató tevékenysége és prioritásai A WHO és a Semmelweis Egyetem Egészségügyi Menedzserképző Központja közötti együttműködés WHO ~ HRH Millenium Development Goals (Achieving the health related
Eladni könnyedén? Oracle Sales Cloud. Horváth Tünde Principal Sales Consultant 2014. március 23.
 Eladni könnyedén? Oracle Sales Cloud Horváth Tünde Principal Sales Consultant 2014. március 23. Oracle Confidential Internal/Restricted/Highly Restricted Safe Harbor Statement The following is intended
24th October, 2005 Budapest, Hungary. With Equal Opportunities on the Labour Market
 24th October, 2005 Budapest, Hungary Nemzeti és Etnikai Kisebbségi Jogok With Equal Opportunities on the Labour Market Equal Opportunities for the Roma Nemzeti és Etnikai Kisebbségi Jogok The government
NYOMÁSOS ÖNTÉS KÖZBEN ÉBREDŐ NYOMÁSVISZONYOK MÉRÉTECHNOLÓGIAI TERVEZÉSE DEVELOPMENT OF CAVITY PRESSURE MEASUREMENT FOR HIGH PRESURE DIE CASTING
 Anyagmérnöki Tudományok, 39/1 (2016) pp. 82 86. NYOMÁSOS ÖNTÉS KÖZBEN ÉBREDŐ NYOMÁSVISZONYOK MÉRÉTECHNOLÓGIAI TERVEZÉSE DEVELOPMENT OF CAVITY PRESSURE MEASUREMENT FOR HIGH PRESURE DIE CASTING LEDNICZKY
FOLYÓIRATOK, ADATBÁZISOK
 Szakkönyvtár FOLYÓIRATOK, ADATBÁZISOK 2013. szeptember Acta Oeconomica Állam- és Jogtudomány Élet és Irodalom Figyelő Gazdaság és Jog Határozatok Tára HVG Közgazdasági Szemle Külgazdaság Magyar Hírlap
Semmelweis Egyetem április Budapest, Üllői út 26. (Semmelweis University) 25 April Budapest, Üllői str. 26.
 25 April Budapest, Üllői str. 26.") 10. Magyar Nemzeti és Nemzetközi Lifelong Learning Konferencia 10 th Hungarian National and International Lifelong Learning Conference Semmelweis Egyetem 2014. április 25. 1085 Budapest, Üllői út 26. Semmelweis
10. Magyar Nemzeti és Nemzetközi Lifelong Learning Konferencia 10 th Hungarian National and International Lifelong Learning Conference Semmelweis Egyetem 2014. április 25. 1085 Budapest, Üllői út 26. Semmelweis
Informatika a felsőoktatásban 2014 konferencia, Debrecen, augusztus
 Tudás disszemináció és innovatív információs technológiák a mezőgazdaságban Knowledge dissemination and innovative information technologies in agriculture Szilágyi Róbert a, Herdon Miklós b, Lengyel Péter
Decision where Process Based OpRisk Management. made the difference. Norbert Kozma Head of Operational Risk Control. Erste Bank Hungary
 Decision where Process Based OpRisk Management made the difference Norbert Kozma Head of Operational Risk Control Erste Bank Hungary About Erste Group 2010. 09. 30. 2 Erste Bank Hungary Erste Group entered
MEGHÍVÓ. Második Felhívás. E-agrárium & E-vidék. AGRÁRINFORMATIKAI FÓRUM és KONFERENCIA
 MEGHÍVÓ Második Felhívás E-agrárium & E-vidék AGRÁRINFORMATIKAI FÓRUM KONFERENCIA Rendező : Magyar Agrárinformatikai Szövetség - MAGISZ Szent István Egyetem - SZIE Társrendező: Magyar Térinformatikai Társaság
Climate action, environment, resource efficiency and raw materials
 Climate action, environment, resource efficiency and raw materials Tóth Orsolya NCP NIH, Külkapcsolatok Főosztálya 2014. február 11. Célok Erőforrás-hatékony, éghajlatváltozásnak ellenálló gazdaság és
Professional competence, autonomy and their effects
 ENIRDELM 2014, Vantaa Professional competence, autonomy and their effects Mária Szabó szabo.maria@ofi.hu www.of.hu The aim and the planned activities at this workshop Aim: To take a European survey on
A DEBRECENI MÉRNÖK INFORMATIKUS KÉPZÉS TAPASZTALATAIRÓL. Kuki Attila Debreceni Egyetem, Informatikai Kar. Összefoglaló
 A DEBRECENI MÉRNÖK INFORMATIKUS KÉPZÉS TAPASZTALATAIRÓL TEACHING EXPERIENCES OF THE IT ENGINEERING COURSE OF UNIVERSITY OF DEBRECEN Kuki Attila Debreceni Egyetem, Informatikai Kar Összefoglaló A Debreceni
FOSS4G-CEE Prágra, 2012 május. Márta Gergely Sándor Csaba
 FOSS4G-CEE Prágra, 2012 május Márta Gergely Sándor Csaba Reklám helye 2009 óta Intergraph szoftverek felől jöttünk FOSS4G felé megyünk Békés egymás mellett élés több helyen: Geoshop.hu Terkep.torokbalint.hu
INFO-CAPITALISM IN CENTRAL EUROPE: THE VISEGRAD STRATEGY. By Pál TAMÁS [Institute of Sociology, HAS, Budapest]
![INFO-CAPITALISM IN CENTRAL EUROPE: THE VISEGRAD STRATEGY. By Pál TAMÁS [Institute of Sociology, HAS, Budapest]](/thumbs/32/15680230.jpg "INFO-CAPITALISM IN CENTRAL EUROPE: THE VISEGRAD STRATEGY. By Pál TAMÁS [Institute of Sociology, HAS, Budapest]") INFO-CAPITALISM IN CENTRAL EUROPE: THE VISEGRAD STRATEGY By Pál TAMÁS [Institute of Sociology, HAS, Budapest] A typology of FUAs, based on 5 functions: - population - transport - manufacturing GVA - no
INFO-CAPITALISM IN CENTRAL EUROPE: THE VISEGRAD STRATEGY By Pál TAMÁS [Institute of Sociology, HAS, Budapest] A typology of FUAs, based on 5 functions: - population - transport - manufacturing GVA - no
Éghajlatváltozással kapcsolatos akció, környezet, erőforrás-hatékonyság és nyersanyagok
 Éghajlatváltozással kapcsolatos akció, környezet, erőforrás-hatékonyság és nyersanyagok Tóth Orsolya NCP NIH, Külkapcsolatok Főosztálya 2014. január 24. Célok Erőforrás-hatékony, éghajlatváltozásnak ellenálló
ÉLETCIKLUS SZEMLÉLET ÉS ÖKOINNOVÁCIÓ A NEMZETKÖZI GYAKORLATBAN. Buday-Malik Adrienn, 2014.12.02, Miskolc
 ÉLETCIKLUS SZEMLÉLET ÉS ÖKOINNOVÁCIÓ A NEMZETKÖZI GYAKORLATBAN Buday-Malik Adrienn, 2014.12.02, Miskolc RÖVIDEN - LCA ÉS ÖKOINNOVÁCIÓ EURÓPÁBAN - NEMZETKÖZI PROGRAM-LEHETŐSÉGEK - JÓ GYAKORLATOK partnerségben
A MAGYAR AGRÁRINFORMATIKAI SZÖVETSÉG OKTATÁS-KUTATÁS TÁMOGATÁSA AZ AGRÁRINFORMATIKÁBAN
 A MAGYAR AGRÁRINFORMATIKAI SZÖVETSÉG OKTATÁS-KUTATÁS TÁMOGATÁSA AZ AGRÁRINFORMATIKÁBAN HUNGARIAN ASSOCIATION OF AGRICULTURAL INFORMATION- SUPPORTING EDUCATION- RESEARCH IN AGRICULTURAL INFORMATION Herdon
MAGASÉPÍTÉSI PROJEKT KOCÁZATAINAK VIZSGÁLATA SZAKMAI INTERJÚK TÜKRÉBEN 1 CSERPES IMRE 2
 MAGASÉPÍTÉSI PROJEKT KOCÁZATAINAK VIZSGÁLATA SZAKMAI INTERJÚK TÜKRÉBEN 1 CSERPES IMRE 2 Összefoglalás A konferencia kiadványhoz készített cikk a fejlesztés alatt álló építőipari kockázatelemző szoftver
A controlling és az értékelemzés összekapcsolása, különös tekintettel a felsőoktatási és a gyakorlati alkalmazhatóságra
 A controlling és az értékelemzés összekapcsolása, különös tekintettel a felsőoktatási és a gyakorlati alkalmazhatóságra Dr. Szóka Károly Nyugat-magyarországi Egyetem Közgazdaságtudományi Kar Egyetemi docens
Angol Középfokú Nyelvvizsgázók Bibliája: Nyelvtani összefoglalás, 30 kidolgozott szóbeli tétel, esszé és minta levelek + rendhagyó igék jelentéssel
 Angol Középfokú Nyelvvizsgázók Bibliája: Nyelvtani összefoglalás, 30 kidolgozott szóbeli tétel, esszé és minta levelek + rendhagyó igék jelentéssel Timea Farkas Click here if your download doesn"t start
Válasz az Éghajlatváltozás hatásaira az. integrált városfejlesztésen keresztül
 Válasz az Éghajlatváltozás hatásaira az integrált városfejlesztésen keresztül Climate Change Response through integrated urban management Egerszegi Zita Balatoni Integrációs Közhasznú Nonprofit Kft. Balatoni
A MAGYAR H2020 SZEREPLÉS TAPASZTALATAI
 Mintacím szerkesztése A MAGYAR H2020 SZEREPLÉS TAPASZTALATAI Jeney Nóra főosztályvezető-helyettes Nemzeti Kutatási, Fejlesztési és Innovációs Hivatal TéT Konferencia, 2016. július 13. Germany United Kingdom
1918 December 1 út, 15/H/4, Sepsiszentgyörgy (Románia) Mobil 0040 748239263 biro_biborka@yahoo.com
 Mobil 0040 748239263 biro_biborka@yahoo.com") Europass Önéletrajz Személyi adatok Vezetéknév (nevek) / Utónév (nevek) Cím(ek) Bíró Bíborka Eszter 1918 December 1 út, 15/H/4, Sepsiszentgyörgy (Románia) Mobil 0040 748239263 E-mail(ek) biro_biborka@yahoo.com
Europass Önéletrajz Személyi adatok Vezetéknév (nevek) / Utónév (nevek) Cím(ek) Bíró Bíborka Eszter 1918 December 1 út, 15/H/4, Sepsiszentgyörgy (Románia) Mobil 0040 748239263 E-mail(ek) biro_biborka@yahoo.com
A SYMBI projekt általános bemutatása
 A SYMBI projekt általános bemutatása Kalcsú Zoltán Projektmenedzser zoltan.kalcsu@pannonnovum.hu Regionális Stakeholder Csoportülés, Győr, 2016.09.08 SYMBI proposal Industrial Symbiosis for Regional Sustainable
DR. BOROMISZA ZSOMBOR. A zalakarosi termáltó tájbaillesztése
 DR. BOROMISZA ZSOMBOR A zalakarosi termáltó tájbaillesztése A zalakarosi Termáltó és Ökopart projekthez kapcsolódóan a tájépítészeti eszköztár szinte minden elemére szükség volt, hiszen védett növények
DIGITÁLIS VILÁG ÉS TERÜLETI VONZÓKÉPESSÉG
 DIGITÁLIS VILÁG ÉS TERÜLETI VONZÓKÉPESSÉG Zuti Bence http://www.interreg-danube.eu/approved-projects/attractive-danube 24.05.2017 1 I. DIGITALIZÁCIÓ 24.05.2017 2 I. DIGITALIZÁCIÓ? 24.05.2017 3 I. DIGITALIZÁCIÓ
HALLGATÓI KÉRDŐÍV ÉS TESZT ÉRTÉKELÉSE
 HALLGATÓI KÉRDŐÍV ÉS TESZT ÉRTÉKELÉSE EVALUATION OF STUDENT QUESTIONNAIRE AND TEST Daragó László, Dinyáné Szabó Marianna, Sára Zoltán, Jávor András Semmelweis Egyetem, Egészségügyi Informatikai Fejlesztő
CONCERTO COMMUNITIES IN EU DEALING WITH OPTIMAL THERMAL AND ELECTRICAL EFFICIENCY OF BUILDINGS AND DISTRICTS, BASED ON MICROGRIDS. WP 5 Del 5.
 CONCERTO COMMUNITIES IN EU DEALING WITH OPTIMAL THERMAL AND ELECTRICAL EFFICIENCY OF BUILDINGS AND DISTRICTS, BASED ON MICROGRIDS WP 5 Del 5.14 1 st period Szentendre Papers and articles in specialist
ÖNÉLETRAJZ Kővári Edit
 ÖNÉLETRAJZ Kővári Edit SZAKMAI TAPASZTALAT 2015 február- One Téma alapítása (kerekasztal mediátor) 2013 szeptember-december Vendégoktató, University of Derby, Üzleti Iskola és Buxton, Turizmus és Spa Menedzsment,
Horizont 2020 Éghajlatváltozás, környezet, erőforráshatékonyság. Climate action, environment, resource efficiency and raw materials
 Horizont 2020 Éghajlatváltozás, környezet, erőforráshatékonyság és nyersanyagok Climate action, environment, resource efficiency and raw materials Tóth Orsolya EU referens NKFI Hivatal Nemzetközi Kapcsolatok
FORGÁCS ANNA 1 LISÁNYI ENDRÉNÉ BEKE JUDIT 2
 FORGÁCS ANNA 1 LISÁNYI ENDRÉNÉ BEKE JUDIT 2 Hátrányos-e az új tagállamok számára a KAP támogatások disztribúciója? Can the CAP fund distribution system be considered unfair to the new Member States? A
Cloud computing. Cloud computing. Dr. Bakonyi Péter.
 Cloud computing Cloud computing Dr. Bakonyi Péter. 1/24/2011 1/24/2011 Cloud computing 2 Cloud definició A cloud vagy felhő egy platform vagy infrastruktúra Az alkalmazások és szolgáltatások végrehajtására
Miért válaszd az E-business menedzsment szakirányt?
 Miért válaszd az E-business menedzsment szakirányt? Az e-business menedzsment több, mint egy újabb oktatás az elektronikus kereskedelemr l. Ha meg akarunk felelni az elektronikus üzletvitel kihívásainak,
Mérnök informatikus (BSc) alapszak levelező tagozat (BIL) / BSc in Engineering Information Technology (Part Time)
 alapszak levelező tagozat (BIL) / BSc in Engineering Information Technology (Part Time)") Mérnök informatikus (BSc) alapszak levelező tagozat (BIL) / BSc in Engineering Information Technology (Part Time) (specializáció választás a 4. félévben, specializációra lépés feltétele: az egyik szigorlat
Mérnök informatikus (BSc) alapszak levelező tagozat (BIL) / BSc in Engineering Information Technology (Part Time) (specializáció választás a 4. félévben, specializációra lépés feltétele: az egyik szigorlat
Vállalatirányítási rendszerek
 Vállalatirányítási rendszerek Varga Zsigmond Üzletfejlesztési igazgató Budapest, 2015. március 03. Nyilvános Motiváció? 2013 SAP AG. All rights reserved. 2 Adatrögzítés része a fejlődésnek 3 Mestermunkától
ACTA CAROLUS ROBERTUS
 ACTA CAROLUS ROBERTUS Károly Róbert Főiskola Gazdaság és Társadalomtudományi Kar tudományos közleményei Alapítva: 2011 2 (2) ACTA CAROLUS ROBERTUS 2 (2) ARCHÍV ANALÓG TÉRKÉPÁLLOMÁNY FELDOLGOZÁSA AZ INSPIRE
ELO Digital Office ERP integráció
 ELO Digital Office ERP integráció Lázár Péter ECM Business Unit Manager peter.lazar@itelligence.hu Enterprise Content Management www.elo.com Miért kell ERP integráció? Hozzáféréseket szabályozni és auditálni
Jegyzőkönyv. A MAGISZ március 28.-i közgyűléséről. Helyszín: Agrárgazdasági Kutatóintézet földszinti tanácsterme. Budapest, Zsil u 3-5.
 Jegyzőkönyv A MAGISZ 2014. március 28.-i közgyűléséről Helyszín: Agrárgazdasági Kutatóintézet földszinti tanácsterme. Budapest, Zsil u 3-5. Jelen vannak: 2 jelenléti ív. (mellékelve) 18 szavazásra jogosult
Károly Róbert Fıiskola Gazdaság és Társadalomtudományi Kar tudományos közleményei Alapítva: 2011
 Károly Róbert Fıiskola Gazdaság és Társadalomtudományi Kar tudományos közleményei Alapítva: 2011 ͳ ȋͳȍ ACTA CAROLUS ROBERTUS 1 (1) FOGLALKOZTATÁS A ZÖLD ZÖLDSÉGHAJTATÓ MODELLGAZDASÁGOKBAN Összefoglalás
TÁVOKTATÁSI TANANYAGOK FEJLESZTÉSÉNEK MÓDSZERTANI KÉRDÉSEI
 TÁVOKTATÁSI TANANYAGOK FEJLESZTÉSÉNEK MÓDSZERTANI KÉRDÉSEI A távoktatási forma bevezetése és eredményességének vizsgálata az igazgatásszervezők informatikai képzésében DOKTORI ÉRTEKEZÉS TÉZISEI dr. Horváth
4032 Debrecen, Böszörményi út 138., 1. Dr. Apáti Ferenc egyetemi docens Tanszék
 1. Dr. Apáti Ferenc egyetemi docens 2. Árváné dr. Ványi Georgina adjunktus GTK Vállalkozásfejlesztés nem önálló 3. Dr. Bácsné dr. Bába Éva egyetemi docens 4. Dr. Bai Attila egyetemi docens GTK Vállalatgazdaságtani
Az egészségügyi munkaerő toborzása és megtartása Európában
 Az egészségügyi munkaerő toborzása és megtartása Európában Vezetői összefoglaló Európai Egészségügyi Menedzsment Társaság. április Fogyasztó-, Egészség-, Élelmiszerügyi és Mezőgazdasági Végrehajtó Ügynökség
LDV Project. Szeretettel köszönjük Önöket Egerben a Leonardo Projekt Workshopján. We welcome - with much love - our dear guests!
 LDV Project Szeretettel köszönjük Önöket Egerben a Leonardo Projekt Workshopján We welcome - with much love - our dear guests! Akkreditációs eljárás Magyarországon Accreditation in Hungary 1. Tankönyv
Mérnök informatikus mesterszak mintatanterve (GE-MI) nappali tagozat/ MSc in, full time Érvényes: 2011/2012. tanév 1. félévétől, felmenő rendszerben
 nappali tagozat/ MSc in, full time Érvényes: 2011/2012. tanév 1. félévétől, felmenő rendszerben") Mérnök informatikus mesterszak mintatanterve (GE-MI) nappali tagozat/ MSc in, full time Érvényes: 2011/2012. tanév 1. félévétől, felmenő rendszerben Tantárgy Tárgykód I. félév ősz II. félév tavasz Algoritmusok
Mérnök informatikus mesterszak mintatanterve (GE-MI) nappali tagozat/ MSc in, full time Érvényes: 2011/2012. tanév 1. félévétől, felmenő rendszerben Tantárgy Tárgykód I. félév ősz II. félév tavasz Algoritmusok
Melyek az újdonságok a Microsoft Dynamics AX 2012-ben? Sasfi Imre 2012. 11. 27.
 Melyek az újdonságok a Microsoft Dynamics AX 2012-ben? Sasfi Imre 2012. 11. 27. * Planned to be released in Q1 CY2012 Microsoft Dynamics AX2012 Solution Overview Ágazat specifikus megoldások Gyártás Nagykereskedelem
Sex: Male Date of Birth: 02 August 1947 Citizenship: Hungarian
 PERSONAL INFORMATION Dr. János Szlávik 3300 Eger, Tompa Mihály u. 8. +36-36-520-400/3082 +36-30-4365-541 szlavik@ektf.hu www.gti.ektf.hu Sex: Male Date of Birth: 02 August 1947 Citizenship: Hungarian WORK
Publikációs lista. Gódor Győző. 2008. július 14. Cikk szerkesztett könyvben... 2. Külföldön megjelent idegen nyelvű folyóiratcikk...
 Publikációs lista Gódor Győző 2008. július 14. Cikk szerkesztett könyvben... 2 Külföldön megjelent idegen nyelvű folyóiratcikk... 2 Nemzetközi konferencia-kiadványban megjelent idegen nyelvű előadások...
Horizont 2020 Gyakorlati pályázati ismeretek adminisztratív, jogi és pénzügyi kérdések. Költségvetési tervezés
 Horizont 2020 Gyakorlati pályázati ismeretek adminisztratív, jogi és pénzügyi kérdések Költségvetési tervezés Kápli Balázs István Legal and Financial NCP Kik pályázhatnak? Egyéni pályázatok Marie Sklodowska-
Készült: Modern Vállalkozások Programja Megyei INFOrmációsnap Miskolc
 Készült: Modern Vállalkozások Programja Megyei INFOrmációsnap Miskolc 2017.02.08. 2005. 2013. ALAPVETÉS A hazai mikro-, kis és középvállalkozói réteg nem-, vagy csak részben használ digitális eszközöket,
Szakmai életrajz (2009. október)
") VÉGZETTSÉG, MINŐSÍTÉS Szakmai életrajz (2009. október) Dr. habil. Herdon Miklós (1950) 2006. habilitáció (szervezés és gazdálkodás tudományok) Debreceni Egyetem 1999. PhD (közgazdaságtudomány) Debreceni
VÉGZETTSÉG, MINŐSÍTÉS Szakmai életrajz (2009. október) Dr. habil. Herdon Miklós (1950) 2006. habilitáció (szervezés és gazdálkodás tudományok) Debreceni Egyetem 1999. PhD (közgazdaságtudomány) Debreceni
Publikációk. Könyvek, könyvfejezetek:
 Publikációk Könyvek, könyvfejezetek: 1. Molnár György: Az IKT-val támogatott tanulási környezet követelményei és fejlesztési lehetőségei, In: Dr. Benedek András (szerk.): Digitális pedagógia - Tanulás
TÉRGAZDÁLKODÁS - A TÉR MINT VÉGES KÖZÖSSÉGI ERŐFORRÁS INGATLAN NYILVÁNTARTÁS - KÜLFÖLDI PÉLDÁK H.NAGY RÓBERT, HUNAGI
 TÉRGAZDÁLKODÁS - A TÉR MINT VÉGES KÖZÖSSÉGI ERŐFORRÁS INGATLAN NYILVÁNTARTÁS - KÜLFÖLDI PÉLDÁK H.NAGY RÓBERT, HUNAGI TÉRADAT PONTOS FRISS ELÉRHETŐ CÉL Elvárások FELHASZNÁLÓ Helytállóság Elégedettség ESZKÖZ
FIATAL MŰSZAKIAK TUDOMÁNYOS ÜLÉSSZAKA
 '. ' : '.,.. ;. > ' ~. FIATAL MŰSZAKIAK TUDOMÁNYOS ÜLÉSSZAKA Kolozsvár, 2002. március 22-23. A GÉPKOCSIRONCSOK SZÉTSZERELÉSI ÉS RECYCLING STRATÉGIÁJA ÉS FOLYAMATAI Varga András Ph.D. hallgató Konzulens:
AZ ERDÕ NÖVEKEDÉSÉNEK VIZSGÁLATA TÉRINFORMATIKAI ÉS FOTOGRAMMETRIAI MÓDSZEREKKEL KARSZTOS MINTATERÜLETEN
 Tájökológiai Lapok 5 (2): 287 293. (2007) 287 AZ ERDÕ NÖVEKEDÉSÉNEK VIZSGÁLATA TÉRINFORMATIKAI ÉS FOTOGRAMMETRIAI MÓDSZEREKKEL KARSZTOS MINTATERÜLETEN ZBORAY Zoltán Honvédelmi Minisztérium Térképészeti
A jövedelem alakulásának vizsgálata az észak-alföldi régióban az 1997-99. évi adatok alapján
 A jövedelem alakulásának vizsgálata az észak-alföldi régióban az 1997-99. évi adatok alapján Rózsa Attila Debreceni Egyetem Agrártudományi Centrum, Agrárgazdasági és Vidékfejlesztési Intézet, Számviteli
Gottsegen National Institute of Cardiology. Prof. A. JÁNOSI
 Myocardial Infarction Registry Pilot Study Hungarian Myocardial Infarction Register Gottsegen National Institute of Cardiology Prof. A. JÁNOSI A https://ir.kardio.hu A Web based study with quality assurance
Exact Synergy Enterprise Időtervezés & Számlázás
 Exact Synergy Enterprise Időtervezés & Számlázás Füles Károly, Lengyel Attila 2009 Exact Tartalom Az Exact-ról Exact Synergy Enterprise áttekintés Exact Synergy az Accace Kft-nél Ajánlattól a fizetésig
Gibicsár Katalin tantárgyprogramjai
 Gibicsár Katalin tantárgyprogramjai Tantárgyprogram az Angol középfokú nyelvvizsgára felkészítő tantárgyhoz Az oktatásért felelős: Idegen Nyelvi Oktatási Központ Tantárgyfelelős: dr. Csendes Ferenc Oktató:
Publikációs lista Szabó Szilárd
 Publikációs lista Szabó Szilárd Tanulmányok Börcsök Áron - Bernáth Zsolt - Kircsi Andrea - Kiss Márta - Kósa Beatrix - Szabó Szilárd 1998. A Kisgyőri - medence és galya egyedi tájértékei - A "Nem védett
AZ INFORMÁCIÓS TÁRSADALOM TECHNOLÓGIAI TÁVLATAI. Detrekői Ákos a Nemzeti Hírközlési és Informatikai Tanács elnöke Székesfehérvár,
 AZ INFORMÁCIÓS TÁRSADALOM TECHNOLÓGIAI TÁVLATAI Detrekői Ákos a Nemzeti Hírközlési és Informatikai Tanács elnöke Székesfehérvár, 2010.03.17. TARTALOMJEGYZÉK 1. Bevezetés 2. Az Információs Társadalom Technológiai
Curriculum Vitae Csaba Toth, PhD Born: October 7, 1979; Miskolc, Hungary
 Curriculum Vitae Csaba Toth, PhD Born: October 7, 1979; Miskolc, Hungary Studies concluded: PhD in Political Science ELTE, Faculty of Law and Political Science, Budapest, Hungary (2012) MA in Sociology
Oktatói önéletrajz Dr. Molnár Bálint
 egyetemi docens Gazdálkodástudományi Kar Információrendszerek Tanszék Karrier Felsőfokú végzettségek: 1976-1981 Eötvös Lóránd Tudományegyetem, Matematikus Tudományos fokozatok, címek:: 1997, PhD Budapesti
Table of contents. Tuesday 31 March Wednesday 01 April Thursday 02 April
 Table of contents Tuesday 31 March 2015... 1 Wednesday 01 April 2015... 2 Thursday 02 April 2015... 4 i Tuesday 31 March 2015 Networkshop 2015 Tuesday 31 March 2015 T-Systems) - A Terem (15:00-16:20) -
KOMMUNIKÁCIÓS TERV 2012.
 KOMMUNIKÁCIÓS TERV Tanulj tőlünk- Tanulunk tőled! TÁMOP 3.1.7-11/2-2011-140 KOMMUNIKÁCIÓS TERV 2012. A kommunikáció tervezése része a TÁMOP 3.1.7 projekt szakmai tervezésének. A szakmai feladatok alapján
Széchenyi István Egyetem Diplomamunka: A marketing lehetőségei a közúti közlekedésbiztonság javításában
 Dr. Borsos Attila Curriculum Vitae Munkahelyi telefon: +36 (96) 613 634 Közlekedésépítési Tanszék Mobil: +36 (30) 453 3311 9026, Győr, Egyetem tér 1. E-mail: borsosa@sze.hu Lakcím: 9029 Győr, Sárási út
Technológia-semlegesség a szabályozásban
 16. Távközlési és Informatikai Hálózatok Szeminárium és Kiállítás 2008. október 15-17. Zalakaros Technológia-semlegesség a szabályozásban Nagy Péter nagy.peter@hte.hu Szabályozás korai szakasza Technológia
III. Bajai Gabona Partnerség. III. Baja Grain Partnership
 III. Bajai Gabona Partnerség Előadó:Nagy László, a Bajai OKK Kft. ügyvezetője 2011. Június 16. III. Baja Grain Partnership Presenter: László Nagy, managing director of Baja Public Port Ltd. 16th June,
hogyan válhat jövőképpé? Dr. Bársony Farkas Elnök, AmCham Hungary Ügyvezető igazgató, GE Hungary Kft. A Nemzeti Versenyképességi Tanács tagja
 A digitális vállalat hogyan válhat jövőképpé? Dr. Bársony Farkas Elnök, AmCham Hungary Ügyvezető igazgató, GE Hungary Kft. A Nemzeti Versenyképességi Tanács tagja Agenda A digitális vállalat A GE, az ipari
A USER Kft - mint Open Text partner - bemutatása
 A USER Kft - mint Open Text partner - bemutatása SAP konferencia 2008.szeptember 22. Tihany Copyright 2008 Open Text Inc. All rights reserved. Kárász Vilmos Sales Manager USER KFT vilmos.karasz@user.hu
Információtartalmú elemzések a közlekedéseredetű szennyezőanyagok hatásvizsgálatánál
 Információtartalmú elemzések a közlekedéseredetű szennyezőanyagok hatásvizsgálatánál Kozma-Bognár Veronika 1 Szabó Rita 2 Berke József 2 1 ügyvivő szakértő, Pannon Egyetem, Meteorológia és Vízgazdálkodás
Cloud computing Dr. Bakonyi Péter.
 Cloud computing Dr. Bakonyi Péter. 1/24/2011 Cloud computing 1/24/2011 Cloud computing 2 Cloud definició A cloud vagy felhő egy platform vagy infrastruktúra Az alkalmazások és szolgáltatások végrehajtására
WP2: Deliverable 2.1
 INTELLIGENT ENERGY EUROPE PROGRAMME BUILD UP SKILLS TRAINBUD WP2: Deliverable 2.1 European benchmark study on mutual recognition Q-BICON PROJECT INTELLIGENT ENERGY EUROPE PROGRAMME BUILD UP SKILLS TRAINBUD
EGYÜTT KÖNNYEBB MI JÓT HOZHAT, HA KLASZTERBE SZERVEZŐDÜNK? Dr. Puskás János DARIÜ társelnök
 EGYÜTT KÖNNYEBB MI JÓT HOZHAT, HA KLASZTERBE SZERVEZŐDÜNK? Dr. Puskás János DARIÜ társelnök Stratégiai menedzsment S W O T Quality, Level, Value 2 1 6 5 3 X 4 S W O T Time Dr. Puskás János 2 Cluster -
Smart City strategy in Hungary
 Smart City strategy in Hungary Dr. Kálmán Kovács Director, Federated Innovation and Knowledge Centre of Budapest University of Technology, Hungary 9th IT STAR, Warsawa, 8-9 October 2015 Topic I - National
A library for the user: new building, new organisation, new services
 A library for the user: new building, new organisation, new services Budapest-Debrecen, 2008.04.11. - 14. LIBER Alföldiné Dán Gabriella - Nagy Zsuzsanna 2 Primary goals of the library To make basic library
THE RELATIONSHIP BETWEEN THE STATE OF EDUCATION AND THE LABOUR MARKET IN HUNGARY CSEHNÉ PAPP, IMOLA
 THE RELATIONSHIP BETWEEN THE STATE OF EDUCATION AND THE LABOUR MARKET IN HUNGARY CSEHNÉ PAPP, IMOLA Keywords: unemployment, employment policy, education system. The most dramatic socio-economic change
Szent László TISZK (SZLTISZK) Kocsis Ibolya
 Kocsis Ibolya") Tolna Megyei Önkormányzat Szent László Szakképző Iskolája és Kollégiuma (TISZK) Szent László TISZK (SZLTISZK) Kocsis Ibolya deputy general director Leonardo Partnerships S.O.S. project coordinator Leonardo
Tolna Megyei Önkormányzat Szent László Szakképző Iskolája és Kollégiuma (TISZK) Szent László TISZK (SZLTISZK) Kocsis Ibolya deputy general director Leonardo Partnerships S.O.S. project coordinator Leonardo
Szaktanácsadás szakpolitikai változásai
 Szaktanácsadás szakpolitikai változásai Dr. Juhász Anikó helyettes államtitkár 2019. Július 4. Melyek a KAP céljai 2020 után? + Általános cél: MODERNIZÁCIÓ (Korszerűsítés) Modernizációs KAP cél TERV Modernizáció
TOURNAMENT DRAW ALL KYOKUSHIN KARATE WT - TOURNAMENT DRAW ALL KYOKUSHIN KARATE WT - TOURNAMENT DRAW
 TOURNAMENT DRAW WOMAN KATA TOURNAMENT DRAW WOMAN 55 KG TOURNAMENT DRAW WOMAN 65 KG TOURNAMENT DRAW WOMAN +65 KG Minôségi termékeink Világbajnok csomagolásban! World Champion in packaging! Valdor Darfresh
FAMILY STRUCTURES THROUGH THE LIFE CYCLE
 FAMILY STRUCTURES THROUGH THE LIFE CYCLE István Harcsa Judit Monostori A magyar társadalom 2012-ben: trendek és perspektívák EU összehasonlításban Budapest, 2012 november 22-23 Introduction Factors which
A JUHTARTÁS HELYE ÉS SZEREPE A KÖRNYEZETBARÁT ÁLLATTARTÁSBAN ÉSZAK-MAGYARORSZÁGON
 Bevezetés A JUHTARTÁS HELYE ÉS SZEREPE A KÖRNYEZETBARÁT ÁLLATTARTÁSBAN ÉSZAK-MAGYARORSZÁGON Abayné Hamar Enikő Marselek Sándor GATE Mezőgazdasági Főiskolai Kar, Gyöngyös A Magyarországon zajló társadalmi-gazdasági
Oktatói önéletrajz Dr. Vas Réka Franciska
 adjunktus Gazdálkodástudományi Kar Információrendszerek Tanszék Karrier Felsőfokú végzettségek: 1997-2002 Szegedi Tudományegyetem, közgazdász-gazdálkodási Tudományos fokozatok, címek:: 2008, PhD Budapesti