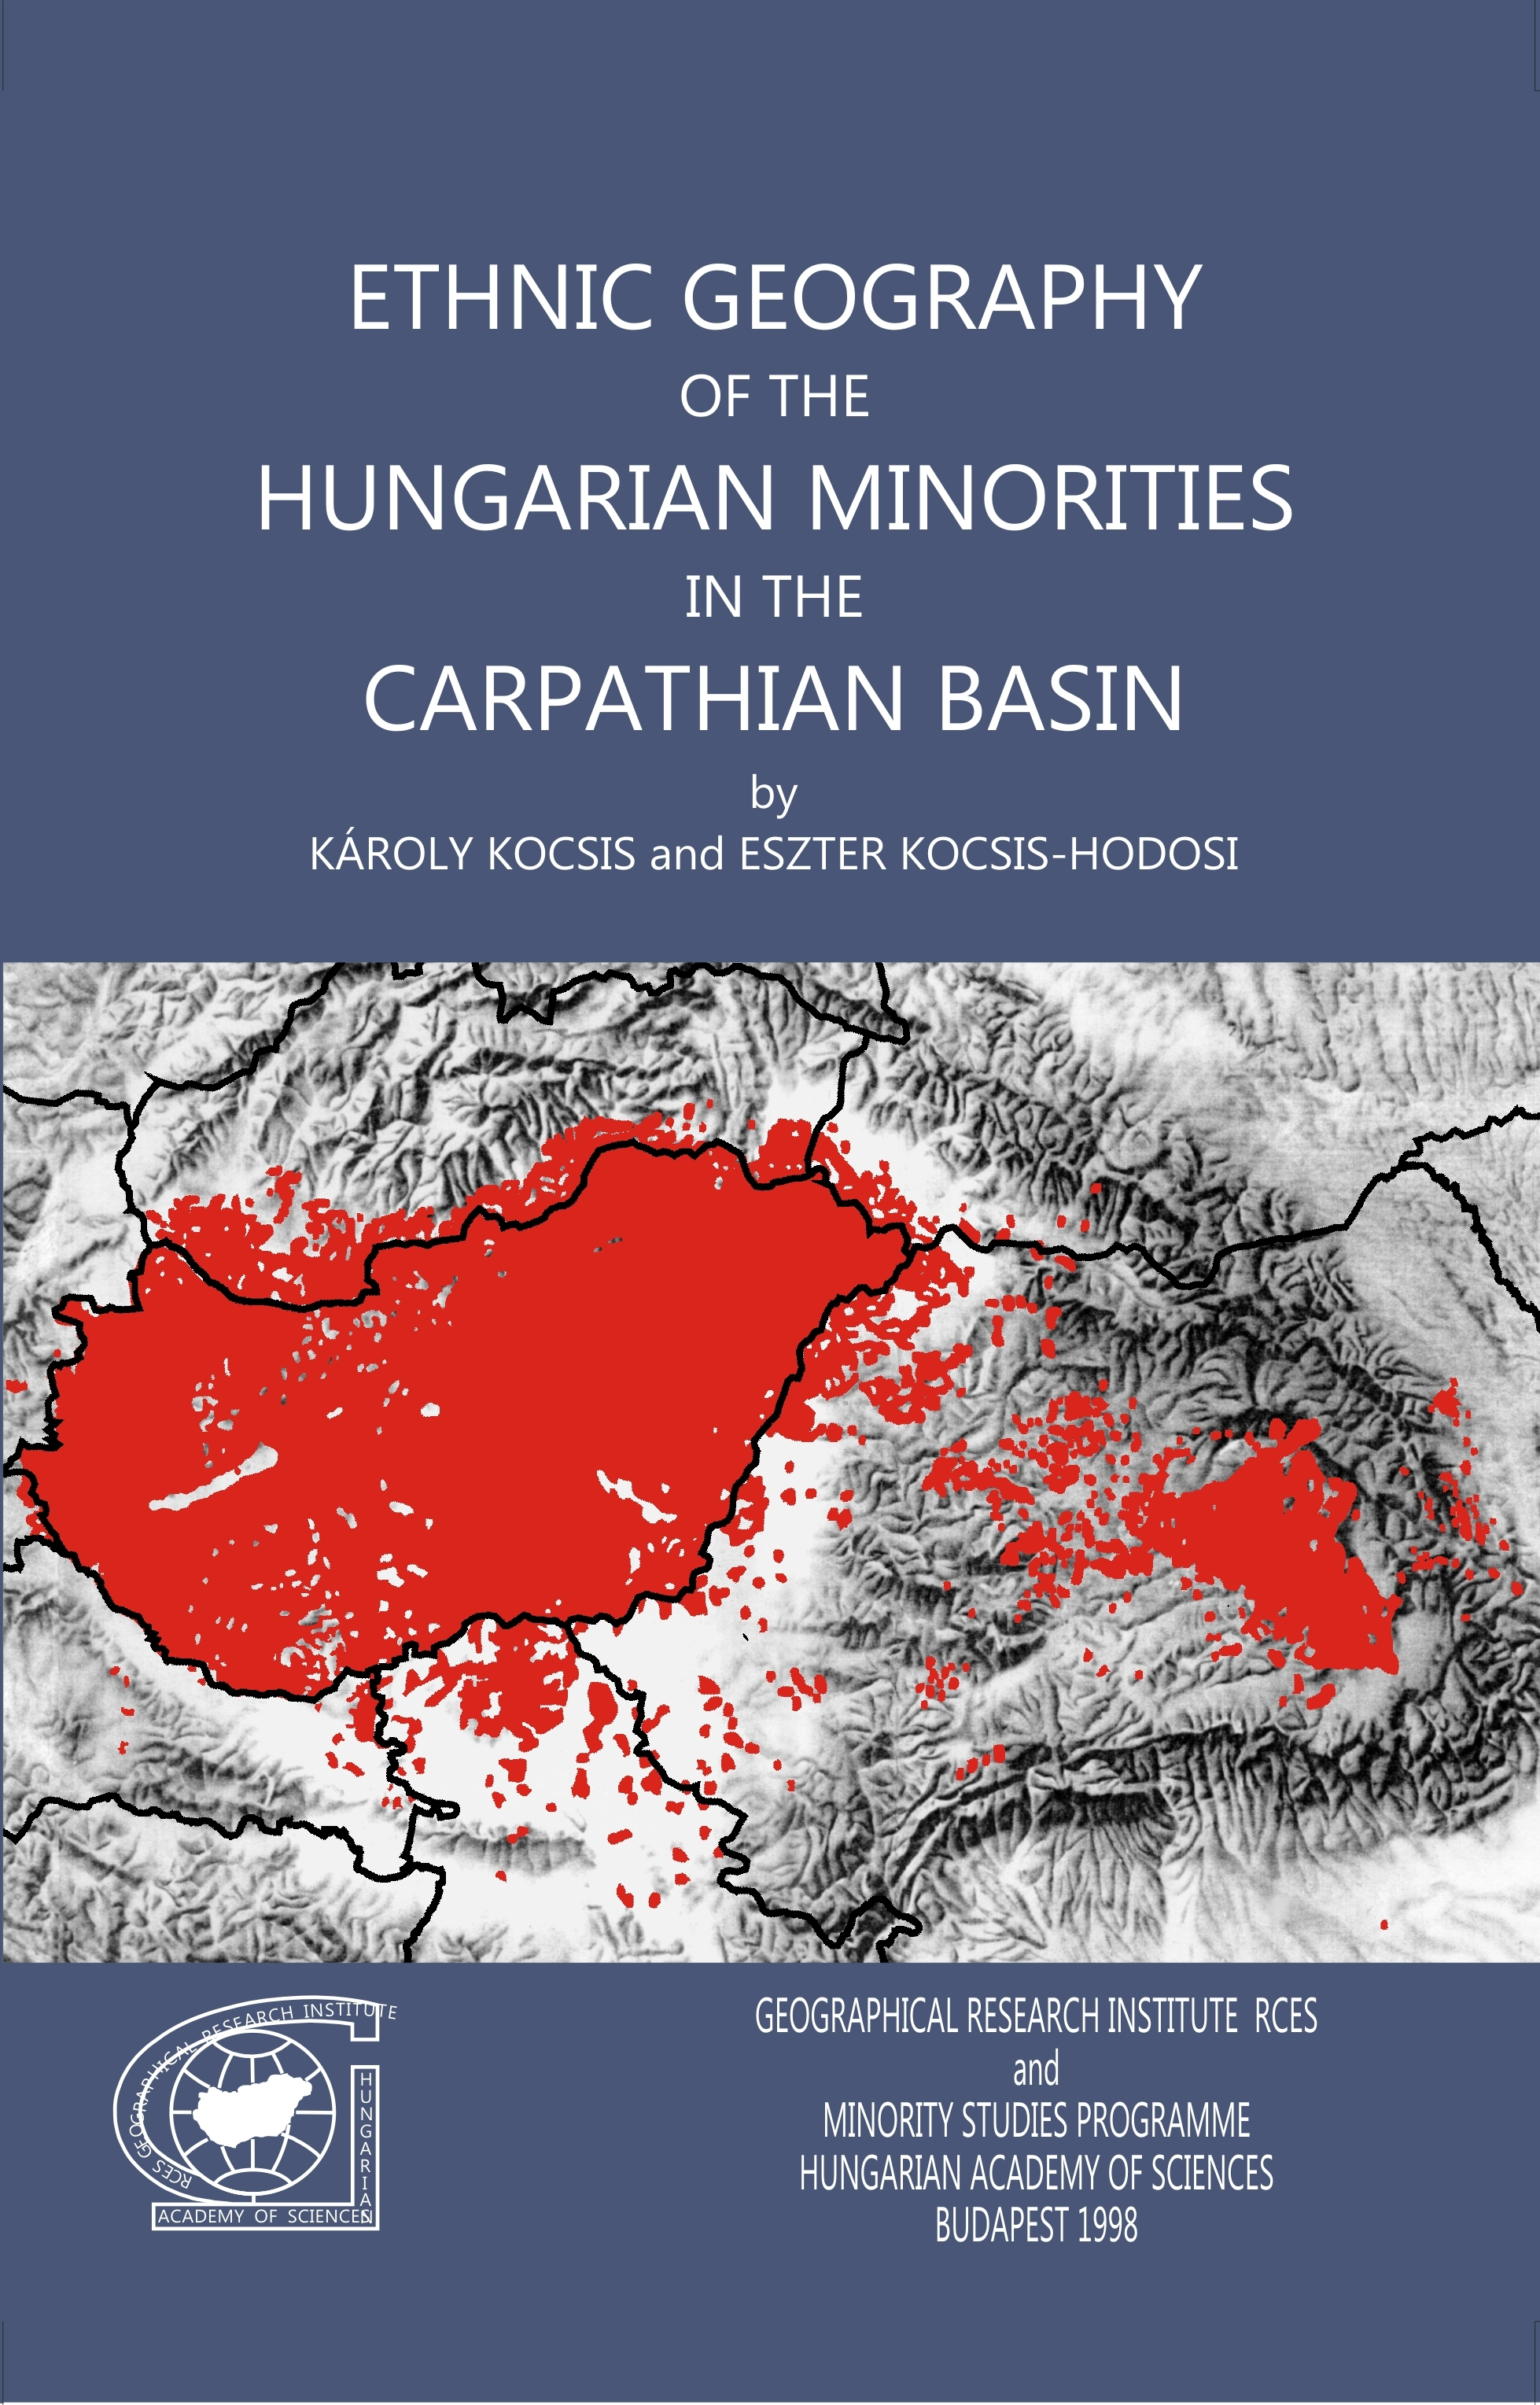
ETHNIC GEOGRAPHY OF THE HUNGARIAN MINORITIES IN THE CARPATHIAN BASIN
|
|
|
- Borbála Szabóné
- 8 évvel ezelőtt
- Látták:
Átírás
1
2 ETHNIC GEOGRAPHY OF THE HUNGARIAN MINORITIES IN THE CARPATHIAN BASIN 1
3 2

4 ETHNIC GEOGRAPHY OF THE HUNGARIAN MINORITIES IN THE CARPATHIAN BASIN by KÁROLY KOCSIS ESZTER KOCSIS-HODOSI GEOGRAPHICAL RESEARCH INSTITUTE RESEARCH CENTRE FOR EARTH SCIENCES and MINORITY STUDIES PROGRAMME HUNGARIAN ACADEMY OF SCIENCES Budapest,
5 Layout: ZOLTÁN KERESZTESI Translation by: LÁSZLÓ BASSA Translation revised by: MARION MERRICK Cartography: LIVIA KAISER, ZSUZSANNA KERESZTESI Technical board: MARGIT CSAPKA-LACZKÓ, ISTVÁN POÓR ISBN Preparation for printing carried out at the Geographical Research Institute Research Centre For Earth Sciences Hungarian Academy of Sciences (Budapest, Hungary) The preparation of the manuscript was sponsored by the Illyés Közalapítvány (Foundation) and by the Hungarian National Research Fund (OTKA, Project T 22831), Budapest Copyright 1998 by Károly Kocsis and Eszter Kocsis-Hodosi. All rights reserved. Reprint or reproduction, even in part, in all forms such as microfilm, xerox copy, microfiche or offset, strictly prohibited. Printed in Hungary by EXEON Bt. 4
6 To our children Ágnes, Levente and Attila 5
7 6
8 CONTENTS List of Figures 9 List of Tables 10 INTRODUCTION 13 Chapter 1 HUNGARIAN MINORITIES IN THE CARPATHIAN BASIN 15 General Outline 15 An outline of the present ethnic geographic, the demographic and the social situation of the Hungarian minorities in the Carpathian Basin 24 Chapter 2 THE HUNGARIANS OF SLOVAKIA 38 The natural environment 38 Ethnic processes during the past five hundred years 40 The present territory of Hungarian settlementin Slovakia 71 Chapter 3 THE HUNGARIANS OF TRANSCARPATHIA 77 The natural environment 77 Ethnic processes during the past five hundred years 79 The present territory of hungarian settlement in Transcarpathia 93 Chapter 4 THE HUNGARIANS OF TRANSYLVANIA 99 The natural environment 99 Ethnic processes during the past five hundred years 101 The present territory of hungarian settlement in Transylvania 125 Hungarian Ethnic Enclaves in Historical Transylvania 132 Hungarians in the Partium Region (Arad, Bihar, Szilágy, Szatmár and Máramaros counties) 134 Hungarian Ethnic Enclaves in the Bánát 135 Chapter 5 THE HUNGARIANS OF VOJVODINA 137 The natural environment 137 Ethnic processes during the past five hundred years 138 The present territory of Hungarian settlement in vojvodina 158 Chapter 6 THE HUNGARIANS OF CROATIA 162 The natural environment 162 Ethnic processes during the past five hundred years 164 The present territory of hungarian settlement in Croatia 182 Chapter 7 THE HUNGARIANS OF THE TRANSMURA REGION 187 The natural environment 187 Ethnic processes during the past five hundred years 187 The present territory of hungarian settlement in the Transmura region 193 Chapter 8 THE HUNGARIANS OF BURGENLAND (ŐRVIDÉK) 194 The natural environment 194 Ethnic processes during the past five hundred years 195 The present territory of Hungarian settlement in Burgenland (Őrvidék) 202 REGISTER 205 7
9 8
10 LIST OF FIGURES 1. Ethnic map of Hungary (late 15 th century) 2. Ethnic map of Hungary (1773) 3. Ethnic map of Hungary (1910) and the Trianon border (1920) 4. Change in the number of ethnic Hungarians in Transylvania, Slovakia, Vojvodina and Transcarpathia according to the census data ( ) 5. Percentage of the Hungarian minorities in the Carpathian Basin (around 1990) 6. The largest Hungarian communities beyond the borders of Hungary (around 1990) 7. Important Hungarian geographical names in South Slovakia 8. Ethnic map of the present-day territory of Slovakia (late 15 th century) 9. Ethnic map of the present-day territory of Slovakia (late 18th century) 10. Change in the population number of the main ethnic groups on the present-day territory of Slovakia ( ) 11. Ethnic map of present-day territory of Slovakia (1910) 12. Change in the ethnic structure of population in selected cities and towns of present-day Slovakia ( ) 13. Bilingual (Hungarian Slovak) population in present-day South Slovakia (1941) 14. Hungarian communities in present-day South Slovakia (1941, 1961 and 1991) 15. Ethnic map of Slovakia (1991) 16. Important Hungarian geographical names in Transcarpathia 17. Ethnic map of the present-day territory of Transcarpathia (late 15 th century) 18. Ethnic map of the present-day territory of Transcarpathia (late 18 th century) 19. Ethnic map of the present-day territory of Transcarpathia (1910) 20. Ethnic map of Transcarpathia (1989) 21. Hungarian communities in Transcarpathia (1989) 22. Important Hungarian geographical names in Transylvania 23. Ethnic map of the present-day territory of Transylvania (late 15 th century) 24. Change in the number of Hungarians, Rumanians and Germans on the historical territory of Transylvania ( ) 25. Change in the ethnic structure of population on the historical territory of Transylvania (16 th 20 th century) 26. Change in the population number of ethnic Hungarians in major areas of Transylvania ( ) 27. Change in the population number of the main ethnic groups on the present-day territory of Transylvania ( ) 28. Ethnic map of the present-day territory of Transylvania (1910) 29. Change in the ethnic structure of population in selected municipalities of Transylvania ( ) 30. Ethnic map of Transylvania (1992) 31. Percentage of ethnic Hungarians in the municipalities, towns and communes of Transylvania (1992) 32. Hungarian communities in Transylvania (1992) 33. Important Hungarian geographical names in Vojvodina 34. Change in the ethnic territory of Hungarians on the present-day territory of Vojvodina (11 th 20 th century) 35. Ethnic map of the present-day territory of Vojvodina (1910) 36. Serbian (Yugoslav) colonization in Vojvodina ( ) 37. Change in the ethnic structure of population in selected cities and towns of the present-day Vojvodina ( ) 38. Hungarian colonization in Bácska ( ) 9
11 39. Serbian and Hungarian losses in Bácska ( ) 40. Ethnic map of Vojvodina (1991) 41. Hungarian communities in Vojvodina (1991) 42. Serbian refugees in Vojvodina (1996) 43. Important Hungarian geographical names in Croatia 44. Change in the number of Hungarians in different parts of Croatia ( ) 45. Ethnic map of the present-day territory of East Croatia (1910) 46. Change in the ethnic structure of the Croatian Baranya ( ) 47. Ethnic map of East Croatia (1991) 48. Hungarians and the War of 1991 in East Croatia 49. Important Hungarian geographical names in the Transmura Region 50. Ethnic map of the present-day Slovenian-Hungarian borderland (1910, 1991) 51. Important Hungarian geographical names in Burgenland 52. Ethnic map of the present-day territory of Burgenland (late 15 th century, 1773, 1910, 1991) 53. Hungarian communities in Burgenland (1923, 1991) LIST OF TABLES 1. Hungarians in different regions of the World (around 1990) 2. National minorities of Europe by population size (around 1990) 3. Percentage of Europe's national minorities compared to the total population of their ethnic groups 4. Change in the number and percentage of the Hungarian minorities in different regions of the Carpathian Basin ( ) 5. Ethnic reciprocity in the countries of the Carpathian Basin (around 1990) 6. The largest Hungarian communities beyond the borders of Hungary in the Carpathian Basin, according to census data (around 1980 and 1990) 7. Ethnic structure of the population of Upper Hungary ( ) 8. Ethnic structure of the population on the present-day territory of Slovakia ( ) 9. Change in the ethnic structure of selected cities and towns of present-day-day Slovakia ( ) 10. The changing ethnic majority of selected settlements in present-day-day South Slovakia ( ) 11. The new regions (kraj) of Slovakia and the Hungarian minority 12. Selected new districts (okres) of Slovakia and the Hungarian minority 13. The largest Hungarian communities in Slovakia (1991) 14. Towns in Slovakia with an absolute Hungarian majority (1991) 15. Ethnic structure of the population of historical Northeast Hungary ( ) 16. Ethnic structure of the population on the present-day territory of Transcarpathia ( ) 17. Change in the ethnic structure of selected settlements of present-day-day Transcarpathia ( ) 18. The largest Hungarian communities in Transcarpathia (1989) 19. Change in the ethnic structure of the population on the historical territory of Transylvania ( ) 20. Ethnic structure of the population on the present-day territory of Transylvania ( ) 21. Change in the number of ethnic Hungarians in major areas of Transylvania ( ) 22. Change in the ethnic structure of selected cities and towns of Transylvania ( ) 23. Change in the ethnic structure of the population of selected counties of Transylvania ( ) 24. Towns in Transylvania with an absolute Hungarian majority (1992) 25. The largest Hungarian communities in Transylvania (1956, 1986 and 1992) 10
12 26. Ethnic structure of the population of the present-day territory of Vojvodina ( ) 27. Change in the ethnic structure of selected cities and towns of Vojvodina ( ) 28. The largest Hungarian communities in Vojvodina (1991) 29. Towns in Vojvodina with an absolute Hungarian majority (1991) 30. Ethnic structure of the population of Croatian Baranya ( ) 31. Ethnic structure of the population on the present-day territory of Croatia ( ) 32. Change in the number of Hungarians in different parts of Croatia ( ) 33. Ethnic structure of the population on the present-day territory of Transmura Region ( ) 34. Ethnic structure of the population of Alsólendva - Lendava ( ) 35. Ethnic structure of the population on the present-day territory of Burgenland ( ) 36. Change in the ethnic structure of selected settlements of Burgenland ( ) 11
13 INTRODUCTION Since the 17th and 18th centuries, the Carpathian Basin 1 has become one of the most diverse and conflict-ridden macroregions of Europe from both an ethnic and religious perspective. During the last century no social or ideological system has succeeded in easing the tensions which have arisen from both the intricate intermingling of different ethnic groups, and the existence of the new, rigid state borders which fail to take into account the ethnic, cultural and historical traditions, economic conditions, and centuries-old production and commercial contacts. Not even communist internationalist ideology (from 1948 to 1989) was able to solve this problem. On the contrary, the ethnic tensions that had been concealed or denied for forty years have since surfaced with an elemental force. As a result, in the years since the collapse of communism, nationalist governments sensitive only to the interests of state forming nations (ethnic groups) gained power. National minorities reacted in self-defence by reorganising and establishing their cultural organisations and political parties. Following the collapse of the former socialist economic system and an upsurge of nationalism and chauvinism, minorities have once again become the source of both interethnic tensions and inter-state conflicts. This is especially true of the Hungarian minorities in the Carpathian Basin. The majority of countries which gained Hungarian territories in 1920 continue to consider them as the main supporters of Hungarian irredentism and revanchism. The need for geographical research on the Hungarian national minorities in the Carpathian Basin can be explained not only by the enormous thirst for information in academic, governmental and general public circles, but also by the political events of the recent past. Geography, since its beginnings, has played and continues to play an important role in the education and formation of national self-consciousness both in Hungary and abroad. Right up to the end of World War I, when the Hungarian Kingdom that had extended throughout the entire Carpathian Basin for almost one thousand years was partitioned, geographical research and the education of the nation corresponded to that of the actual country. After the 1920s, however, the relationship of Hungarian geography to the Hungarian nation and state was divided into two main eras. The first era lasted from 1920 until With one sudden blow, the Peace Treaty of Trianon (1920) forced one third of the Hungarian nation to live as minorities as foreigners. In this era, ethnic, political and economic geography became the main scientific source of revisionist and irredentist demands. As a result, the study of the geography of the lost territories and their Hungarian populations played an exceptionally important role in scientific research and education. 1 The Carpathian Basin is a synonym for the territory of historical Hungary in the everyday language of Hungary. From a geographical point of view it includes at least three great basins: Little Hungarian Plain (Kisalföld), the Great Hungarian Plain (Alföld) and the Transylvanian Basin 13
14 During the four decades following the 1940s, in order to avoid conflict with neighbouring Communist allied countries, and in accordance with the proletarian internationalist ideology of the region, the relationship of geography with the Hungarian national minorities was characterised by totally opposite principles. Study of the nation was equated with a study of the Hungarian state. Fear of accusations of nationalism, chauvinism or irredentism led to a consideration of the Hungarians of the Carpathian Basin living outside the borders of Hungary as being almost non-existent. The centuries-old Hungarian names of regions and settlements inhabited by Hungarians were also omitted, intentionally or by ignorance, both in the press and in school-books. Unfortunately, this fact contributed to increasing national despair in society as well as to a fall in the amount of literature written in Hungarian. From this point of view, the situation has improved considerably since then, but school books still hardly mention the Hungarian minorities of several millions living over the border. For this reason, several generations have grown up in the last decades for whom Hungarian geographical names such as Csallóköz, Gömör, Párkány, Beregszász, Nagykároly, Sepsiszentgyörgy and Zenta sound just as exotic as Buenos Aires, Capetown, Teheran or Peking. During their trips to neighbouring countries people are genuinely surprised by the local population's knowledge of Hungarian and by the presence of the several hundreds of thousands of Hungarians. This has, of course, only increased the thirst for information regarding Hungarians living outside the borders. In recent years, a considerable number of people have voiced the demand that after seven decades of extremist attitudes, the millions of Hungarians living next door should finally be offered a place in Hungarian science and education, as they deserve. The first chapter outlines the position of Hungarians in the Carpathian Basin among European minorities, the relationship between changes in population and political events in the 20 th century, and the present ethnic geographic, demographic and social situation of the Hungarian minorities in the Carpathian Basin. In the remaining chapters the natural environment and changes in the territory of Hungarian settlement is explored further between the 15 th and 20 th centuries. 14
15 Chapter 1 HUNGARIAN MINORITIES IN THE CARPATHIAN BASIN General Outline Out of a total 14,1 million ethnic Hungarians in the world a number corresponding to the population of Australia 92 % live in the Carpathian Basin on the historical territory of Hungary (Tab. 1). There are 3.2 million European Hungarians living outside the borders of present-day Hungary, forming the largest minority in Europe 1, apart from the 15.1 million ethnic Russians, and having the same size as the population of Ireland while outnumbering the population of 87 countries in the world (e.g. Mongolia, Libya) (Tab. 2). If the number of people of minority status is compared to the number of their entire ethnic group, then Hungarians are among the first with a rate of 25.9%. In Europe, only the Albanians and the Irish are above the Hungarians on the list with a proportion of 30-42% of the ethnic group living outside the borders of their country (Tab. 3). During the period following the Hungarian Conquest of the Carpathian Basin (896), its natural environment and capacity to support a large population were the most decisive factors influencing the limits of the area populated by the forefathers of the Hungarians. At this time, Hungarians mainly inhabited the steppes and lightly-forested areas, the strategically important valleys and the hills, which reminded them of the landscape of their previous homeland, while it suited their half-nomadic way of life. Later, with a change in lifestyle to an agricultural way of life, and with a demographic rise, the Hungarian ethnic borders were extended to the verge of the high mountainous regions (Fig. 1). In the times of the Ottoman (Turkish) occupation demographic losses were proportionate to the geopolitical and geographical position of the population. The diminishing Hungarian ethnical area and its shrinking borders were mainly felt in southern parts, that is in the neighbourhood of the Ottoman Empire, and in the flatlands and strategically unfavourable zones like in some valleys or basins (such as the Transylvanian Basin). The present-day Székely 2 ethnic area owes its existence to its favourable geographical position as well as its former autonomous status. 1 Excluding the Turkish and Italian migrant-workers ("Gastarbeiters") of 3 million each. 2 Székelys (Hungarian: Székelyek, German: Szeklers, Rumanian: Secui, Latin: Siculi). Hungarian ethnographical group in the middle of Rumania, in Southeast Transylvania. Their ethnic origin is a controversial question. During the 10th and 11th centuries they lived as border guards and 15
16 Table 1. Hungarians in different regions of the World (around 1990) Country, region Total Carpathian Basin 1. Hungary 10,222,000 10,222, Slovakia 608, , Ukraine 180, , Rumania 1,640,000 1,620, Yugoslavia 6. Croatia 350,000 20, ,000 19, Slovenia 9,000 8, Austria 2 8. total 9. Czech Republic 10. Germany 11. Netherlands 12. Belgium 13. United Kingdom 14. France 15. Switzerland 16. Italy 17. Sweden 18. Russia 19. other European countries 33,000 2,840,000 20, ,000 5,000 10,000 25,000 50,000 20,000 5,000 25,000 20,000 17,000 7,000 2,775, total 3,157,000 2,775, Europe total 13,379,000 12,997, USA 450, Canada 73, Latin American countries 100, South Africa 10, Other African countries 10, Israel 27, Other Asian countries 30, Australia 36, New Zealand and Oceania total 30.World total 5, ,000 14,120,000 Sources: 1 8. Census data (native tongue). 22., 26., 28. Britannica. Book of the year 1992, 9 21., , 27., 29. Estimations of K. Kocsis and of the organizations of the Hungarian minorities (Databank of the World Federation of Hungarians, Budapest). auxiliary troops in disperate groups along the borders of the Hungarian settlement area (e.g. Banat, Syrmia, Southwest Transdanubia (Dunántúl), present-day South Slovakia, Bihar county). In the 12 th and 13 th centuries the majority of them were concentrated in the eastern bordeland of Hungary. This was a very underpopulated, wooded area endangered by Patzinak and Mongol invasions. As a border guard, privileged population they have lived till the 14th century in "clan" organisation, after that in seven districts ("szék") under the leadership of the bailiff (Hungarian: "ispán") of all Székelys, of the local representative of the king of Hungary in power. Since the Middle Ages their increasing, by economical and political reasons motivated emigration from the overpopulated and underdeveloped Székely Region to Moldavia demographical reinforced the Roman Catholic Csángó-Hungarians of Moldavia. 16
17 Table 2. National minorities of Europe by population size (around 1990) National minorities Total number 1. Russians 15,120, Hungarians 3,157, Turks 3,000, Italians 2,600, Germans 2,445, Albanians 2,390, Irish 2,300, Poles 1,669, Ukrainians 1,528, Portugueses 1,030, Serbs 983, Spanish 953, Belarussians 860, French 670, Greeks 564, Rumanians, Moldavians, Vlachs 540,000 Sources: Geografichesky Entsiklopedichesky Slovar. Ponyatia i terminy. (Treshnikov, A.F. /ed./1988, Moscow, pp , Census data: 1989 (USSR), 1992 (Rumania), 1991 (Yugoslavia, Croatia, Slovenia, Macedonia, Czechoslovakia), Britannica. Book of the Year 1991, London, pp Remarks: The national minorities include Gastarbeiters (migrant workers) on the territory of Europe excluding Russia and Turkey. The state borders of are considered. Table 3. Percentage of Europe's national minorities compared to the total population of their ethnic groups (around 1990) National minorities Percentage 1. Albanians Irish Macedonians Hungarians Muslimans Slovenes Serbs Russians Slovaks Croats Belarussians Portugueses Finns Turks Bulgarians 5.0 Sources, remarks: see Table 2. The next stage in the history of ethnic Hungarian territory is characterised in the mass migrations of the 18 th century, following an evening out in number of the popu- 17

18 Figure 1. Ethnic map of Hungary (late 15th century) lation. Masses of people from the ethnic peripheries moved to the great basins located in the Great Hungarian Plain or the Transylvanian Basin which were formerly almost depopulated or sparsely inhabited, but offered great productivity and were rich in different natural resources. The result of this process was the dislocation of the Hungarian-Slovak, Hungarian-Ruthenian, Hungarian-Rumanian ethnic borders at the expense of the ethnic Hungarians (Fig. 2.). The present-day area of Hungarian rural settlement did not change significantly after the 18 th century, only occasionally was it violently modified (e.g. deportations between , genocide in 1944, etc.) or slightly changed by both natural and forced assimilation. We cannot speak of Hungarian minorities in the Carpathian Basin until 1920, the year of the peace treaty of Trianon and the partitioning of the historical territory of Hungary. The detached areas had constituted an organic part of Hungary from the 10 th century up to From then on, Hungarians lived first in five, then from 1991 in eight different countries: Hungary, Slovakia (starting in 1993), Ukraine (Transcarpathia), Rumania (Transylvania), Yugoslavia Serbia (Vojvodina), Croatia, Slovenia (Transmura Region) and Austria (Burgenland). During the past seven decades their "dismembered" situation determined their destiny and their statistical numbers as registered by the Czechoslovak, Rumanian, Yugoslav etc. official censuses. According to the last Hungarian census (1910) in the total territory of historical Hungary, 33% of the total number of Hungarians living in the Carpathian Basin approximately 3.3 million people lived on the territories that are now outside the new 18

19 Figure 2. Ethnic map of Hungary (1773) Hungarian national borders. In the period following the peace treaty of Trianon these people experienced a change of status from that of a majority to one of a minority for the first time in history. Thus, they became the target for anti-hungarian revenge by Slovaks, Rumanians, and Serbs. Their geographical position also changed fundamentally, since the areas they inhabited with the one exception of the Székely regions had all formerly been in the central area of the Hungarian state. After 1920 these areas became heavily militarised frontier zones on the periphery of the neighbouring countries (Fig. 3.). According to the data of the National Office for Refugees (Budapest) about 350,000 Hungarians fled to the new territory of Hungary in the period between The greatest number (197,035) left territories annexed to Rumania, others (106,841) came from areas given to Czechoslovakia, and the rest (44,903) emigrated from their native lands which then belonged to the Kingdom of the Serbs, Croats and Slovenes 3. Ethnic status is a very subjective social structural element. It relies on the personal beliefs of the individual, and is much influenced by the prevailing ideological and political system. For this reason the number of individuals making up the various ethnic groups is determined by many factors: natural increase or decrease of population and migration, fluctuations in the declaration of ethnicity at censuses, demographic proc- 3 Petrichevich-Horváth E Jelentés az Országos Menekültügyi Hivatal négy évi működéséről (Report about the activity of the National Office for Refugees), Budapest 19
 and the Trianon border (1920)")
20 20 Figure 3. Ethnic map of Hungary (1910) and the Trianon border (1920) Source: Dami, A La Hongrie de Demain, Paris
21 esses such as assimilation, and differences in data relating to the mother tongue, the language used at home, ethnic origins, etc. Between the two wars the most striking phenomenon in this respect was that Jews and Gypsies were listed in different categories in Czechoslovakia and Rumania. This diminished the number of those people who considered themselves to be Hungarian primarily in Transcarpathia, Slovakia and Transylvania, as compared to the statistics of 1910 (Tab. 4., Fig.4.). An important factor in the rapid statistical decrease in the number of Hungarians now living in minority groups was the fact that the many bilingual and bicultural groups living along the borders declared themselves to be Slovaks, Ruthenians (now Ukrainians), Rumanians, Serbs or Croats, but not Hungarians. This was the case with the population in the areas around Nyitra, Érsekújvár, Léva, Kassa and Tőketerebes in Slovakia, the western part of the Nagyszőlős district in Transcarpathia, and certain areas in the counties of Szatmár and Szilágy in Rumania. Compared to these places, the decrease in the number of Hungarians living in smaller communities (in Burgenland or Slavonia) was less dramatic. These phenomena led to a fall in the number of Hungarians firstly in Transylvania and Slovakia, and to some extent in Croatia, Burgenland and Transcarpathia. Figure 4. Change in the number of ethnic Hungarians in Transylvania, Slovakia, Vojvodina and Transcarpathia according to the census data ( ) 21
22 Table 4. Change in the number and percentage of the Hungarian minorities in different regions of the Carpathian Basin ( ) Sources: Census data (Slovakia: 1880, 1910, 1930, 1941, 1950, 1961, 1970, 1980, 1991; Transcarpathia:1880, 1910, 1930, 1941, 1959, 1969, 1979, 1989; Transylvania : 1880, 1910, 1930, 1941, 1948, 1956, 1966, 1977, 1992; Vojvodina, Croatia, Transmura Region: 1880, 1910, 1931, 1941, 1948, 1961, 1971, 1981, 1991; Burgenland: 1880, 1910, 1934, 1951, 1961, 1971, 1981, 1991). Remark: Hungarians include the Székelys (Secui) and Csángós (Ceangãi). Abbreviations: M mother (native) tongue, N ethnicity, E ethnic origin, U every-day language ( Umgangssprache ) Transcarpathia (Ukraine) Transylvania (Rumania) Vojvodina (Yugoslavia) Transmura Region (Slovenia) Burgenland (Austria) Year Slovakia Croatia number percent. number percent. number percent. number percent. number percent. number percent. number percent , M 105, M 1,045, M 265, M 1.9 M 13, M 11, M 49, , M 185, M 1,658, M 425, M 119, M 20, M 26, M , N 116, N 1,480, M 376, M 1.7 M 15,050 10, M 66, , M 233, M 1,711, M 456, M 16, M 64, , N 139, N 1,481, M 418, N 1.4 N 10, N 5, U 51, , N 146, N 1,616, M 442, N 1.0 N 9, N 5, U 42, , N 151, N 1,625, M 423, N 0.8 N 9, N 5, U 35, , N 158, N 1,691, N 385, N 0.6 N 8, N 4, U 25, , N 155, N 1,604, N 339, N 0.5 N 7, N 6, U 22,355
23 Between 1938 and 1941 there was a lull in the rapid fall in the number of Hungarians in the Carpathian Basin when areas with a compact Hungarian population were given back to Hungary e.g. present-day Southern Slovakia, Transcarpathia, Northern Transylvania, Bácska, Southeast Baranya, and the Transmura Region. In these territories the number of Hungarians increased considerably, especially in the present-day territories of Transcarpathia, Slovakia and Transylvania. This followed the appearance of Hungarian government officials (civil servants, a police force and army), an influx of Hungarian colonists from Bukovina and the fact that the majority of Jews also belonged to the Hungarian ethnic community. After the Second World War, according to census data from the neighbouring states, the total numbers in the Hungarian minorities shrank from 3.2 million (in 1941) to 2.4 million. Among the main factors contributing to this decrease between were migration (fleeing their homes, expulsions, or deportations). 125,000 Hungarians fled to present-day Hungarian territory, or were deported from Rumania; 120,500 from Czechoslovakia; 45,500 from Yugoslavia; and 25,000 from Transcarpathia (belonging then to the Soviet Union, and now to Ukraine). At the same time the Czechoslovakian government deported 44,000 Hungarians to the Czech regions between , from where Germans had fled or had been deported, in order to press for a gradual Czechoslovak-Hungarian "population exchange". Besides emigration and the casualties during the war, came the annihilation of Jewish Hungarians the numbers of Hungarians in neighbouring countries was mostly diminished by the fact that those groups, whose awareness of nationality was not very strong continually vacillated and now declared themselves to belong to the majority population. In South Slovakia, there was a process of "re-slovakization", while the general anti-hungarian atmosphere also contributed to the diminishing number of Hungarians, especially in Slovakia, Transcarpathia and Transylvania. In areas belonging to former Yugoslavia (Bácska, Bánát), in spite of the vendetta of the Serbs in October-November 1944, which claimed approximately 20,000 civilian casulaties, the number of Hungarians was dropping far slower. This fact is partly explained by the fact that the Germans preferred to declare themselves Hungarian from fear of persecution. During the last 40 years the number of minority Hungarians in statistical reports was greatly influenced by the specific socio-economic system of the different countries, their various policies towards ethnic minorities, and the "maturity" of the majority population in each country. In Serbia (Vojvodina), Croatia and the Transmura Region of Slovenia, the number of Hungarians either increased or remained unchanged up to the 1960s. From then on with the chance of working in the West, or with the appearance of the "Yugoslav" category in the ethnic statistics, the number of Hungarians in the former Yugoslavia started to diminish dramatically. The natural increase of Hungarians in Transylvania was counterbalanced first of all in the important towns and cities by the "nationstate" programme of the Rumanian government and the resulting policy towards minorities, as well as distortions of the statistics. In Slovakia, with the fading of the memory of the shocking events of the late 40s, the number of those who dared to declare themselves Hungarian increased greatly during the 1950s. To this was added a high rate of natural 23
24 increase, but this growth suddenly dropped from the 1970s on. The greatest Hungarian demographic increases in the Carpathian Basin were registered in the following regions during the period from 1970 to 1980: Beregszász district (12.7%), Hargita and Kovászna counties (respectively 11.7% and 10.5%) and Dunaszerdahely district (18.7%). An outline of the present ethnic geographic, the demographic and the social situation of the Hungarian minorities in the Carpathian Basin According to the different censuses from the 1990s, the number of ethnic Hungarians in the Carpathian Basin is 13 million, out of which 2.8 million are living outside the borders of the Republic of Hungary. Minority organisations, however, estimate that the number of Hungarians in the area is 3.2 million. This makes up 24.9% of the total number of Hungarians in the Basin. The majority of Hungarians living in a minority are found in Transylvania (1.6 million people), followed by Slovakia with 567,000 people, and Vojvodina in Serbia (339,000). When speaking about the number of Hungarians living in different neighbouring countries, it is worth touching upon the much used term of "ethnical reciprocity". This is very important because the situation of the respective minority in Hungary has played, and still does play, an immense role in the granting of rights for Hungarians in the neighbouring states. As can be seen from Table 5., one can speak about ethnical reciprocity in the case of Hungary only with Croatia, Slovenia and Austria, for only in these cases are their numbers and their demographic and ethno-geographic situations comparable. At the same time, the latest census shows that the Hungarian minorities in Serbia, Rumania and Slovakia are 189, 151, and 54 times greater respectively than their corresponding minorities in Hungary. Apart from the different historical developments of each minority this great disproportionateness makes a comparison between the situation of Hungarians in Slovakia, Rumania and Serbia with that of the Slovaks, Rumanians and Serbians in Hungary impossible. Moreover, this lack of symmetry in number has further increased the vulnerability of Hungarians in Czechoslovakia, Rumania and Yugoslavia. Their political situation has become similar to that of a political hostage during the past 70 years. Although the number of Ruthenians and Ukrainians is very small in Hungary, the lack of balanced ethnical reciprocity does not in any way influence the good relations between the young Ukrainian state and Hungary. What is more, the Ukrainians have realised that in pursuit of an approach to Western Europe, there is a need for a western bridge (Transcarpathia) without ethnic tensions, and for good political and economic relations with Hungary, which can be achieved with the Hungarian minority inside the Ukrainian borders. According to the censuses of around 1990, on the territory of the Carpathian Basin beyond the borders of Hungary, 2,703,176 persons declared themselves to be ethnically Hungarian and 2,773,944 persons were native Hungarian speakers. The num- Table 5. Ethnic reciprocity in the countries of the Carpathian Basin (around 1990) 24
25 Hungarians in Slovakia Hungarians in Ukraine Hungarians in Rumania Hungarians in Serbia Hungarians in Croatia Hungarians in Slovenia Hungarians in Burgenland 567,296 (653,000) 163,111 (210,000) 1,627,021 (2,000,000) 343,942 (365,000) 22,355 (40,000) 8,499 (12,000) 6,763 (7,000) Slovaks in Hungary Ukrainians in Hungary Rumanians in Hungary Serbs in Hungary Croats in Hungary Slovens in Hungary Germans in West-Hungary 10,459 (80,000) 657 (.. ) 10,740 (15,000) 2,905 (5,000) 13,570 (40,000) 1,930 (5,000) 1,531 (17,000) Source: Census data /Ukraine 1989, Hungary 1990, Slovakia, Serbia, Croatia, Slovenia, Austria 1991, Rumania 1992/ according to the ethnicity (in Austria: every-day language). In parentheses are the estimations according to the language knowledge and ethnic origin of the organizations of the minorities and the calculations of K.Kocsis (1988). Hungarians in Transylvania include the Székelyand Csángó-Hungarians. ber of the latter exceeded that of ethnic Hungarians by 80,500 in Hungary; 40,900 in Slovakia; 15,800 in Transylvania; 11,600 in Transcarpathia, and 5,200 in Vojvodina. The number of native Hungarian speakers surpasses that of ethnic Hungarians almost everywhere, mainly due to the fact that the Gypsy and German populations Magyarized their language but have recently undergone a revival of ethnic awareness in areas with a Hungarian majority. Moreover, along the Hungarian language border (e.g. in towns like Pozsony, Kassa, Ungvár and Munkács and in their environs), and in Szatmár County in Rumania this difference had reached between 12 and 48 %. On the other hand, an accelerated lingual assimilation of Hungarians in Slovak, Ruthenian, Serbian and Croatian majority territories means that the number of native Hungarian speakers remains below those of Hungarian ethnic affiliation (e.g. in the overwhelmingly Ruthenian parts of Bereg and Máramaros counties by %, in Croatia by 12 %, in the Transylvanian counties of Szeben, Hunyad, Krassó-Szörény, Beszterce-Naszód - by 5-10 %). The 1980's, decisive in present population trends, found that the number of ethnic Hungarians had decreased by 4.67 % within the borders of Hungary and by 4.57 % beyond them. In Central Eastern Europe the only areas with a growing number of Hungarians were Burgenland (63.1 % growth due to a significant Hungarian influx following the fall of the "iron curtain"), in the Székely Region, and in Slovakia (as a result of the not unfavourable trends in the birth rate, where there was a 2.1 % and 1.39 % growth, respectively). As a consequence of an increasingly unfavourable birthrate and distorted demographic structure of the Hungarian population, the irreversible assimilation of its diaspora, a national revival among the previously Magyarized Gypsies and persons of German origin in the new political situation, the number of those declaring themselves to be ethnic Hungarians decreased by 7.6 % in Transylvania (without the Székely Re- 25
26 gion), and by % in Vojvodina, Croatia and the Transmura Region. The macroregional ethnic discrepancy at the expense of Hungarians is indicated by the fact that during the same period there was a 3.2 % to 5.2 % population growth in the neighbouring countries (e.g. 5.2 % in Slovakia, 5 % in Yugoslavia 4 ). In the first half of the 1990 s the negative trends in demography of the Hungarian minorities (decreasing birth rates and increasing mortality rates, a negative balance of migration for political and economic reasons) had led to a drop in the number of Hungarians living in the Carpathian Basin beyond the borders of Hungary, below an estimated 2.6 million by the end of At the same time ethnic Hungarians within the present territory of Hungary decreased to "a mere" 10 million. The number of people declaring themselves to be ethnic Hungarians living in the neighbouring states and regions at the end of 1995 might have been as follows (in thousands): Slovakia 572, Transcarpathia 154, Transylvania 1,565, Vojvodina 280, Croatia 15, the Transmura Region 7, and Burgenland 7. The losses were especially severe - mainly due to the flight provoked by the Serbo-Croatian War in among Hungarians who lived in Croatia (approx. 33 %) and Vojvodina (approx. 17 %). According to the censuses of around 1990, 27.3 % of the 2.7 million persons constituting Hungarian minorities in the Carpathian Basin (722,000 people) live in ethnic blocks along the border with Hungary (South Slovakia, Ung-Bereg-Ugocsa Border- Zone in Transcarpathia, Szatmár-North Bihar Zone in Rumania and Tisza Region in Vojvodina); 26.8 % of them ( people) populate the Székely Region in eastern Transylvania (Fig.5.). At the same time, in a chain of towns (an ethnic "contact zone" 5 ) linking Pozsony-Ungvár-Szabadka, where Hungarians have lost their majority during the past fifty years, they now constitute 13 % (350,000), while the remainder (32.9 %) form language islands or are scattered (858,000). In the 1980 s, there was a 2.1 % increase in the number of Hungarians living in the Székely Region, and a 4.7 % growth rate in the towns in the "contact zone". This can be attributed to a 4.3 % decrease within the neighbouring ethnic blocks and a 13.3 % loss due to the diaspora, i.e. due to migration associated with the trends of urbanisation. The loss from ethnic blocks was the most severe (- 8.2 %) in the Tisza Region (Vojvodina) as a consequence of a low birthrate and high emigration, and the most moderate (-1.3 %) in southern Slovakia. In spite of this, the towns in the contact zone experienced the highest gain (+17.8 %) during this period, together with southern Slovakia, as a result of migration fed by the relatively favourable demographic trends in the ethnic blocks. Hungarians who are dispersed and who make 4 A relatively significant increase in population of Yugoslavia between 1981 and 1991 was primarily due to the 27.9 % increase of Albanians and 14.6 % increase of Muslimans (Serbian speakers of Islamic faith) of still high fertility. During the same decade the number of Serbs increased by 4.9 %, and that of Montenegrins dropped by 5.1 %. 5 This ethnic "contact zone" includes the following settlements presently with Hungarian minority populations, neighbouring ethnic blocks along the border: Pozsony, Szenc, Diószeg, Galánta, Vágsellye, Érsekújvár, Nagysalló, Léva, Nagykürtös, Losonc, Osgyán, Rimaszombat, Rozsnyó, Jászó, Nagyida, Kassa, Szlovákújhely, Ungvár, Munkács, Nagyszőlős, Szatmárnémeti, Margitta, Nagyvárad, Szabadka. 26
27 Figure 5. Percentage of the Hungarian minorities in the Carpathian Basin (around 1990) 27
28 up an ageing group of people suffering from the effects of emigration and growing lingual assimilation diminished by 8-9 % in Slovakia, Transcarpathia and Partium 6 and by 16.1 % in Vojvodina. 1.6 million Hungarians (61.5 % of the national minority) are in a favourable position to retain their ethnic identity. This represents an absolute majority (above 50 %), and amounts to 1410 such settlements in the Carpathian Basin. An overwhelming majority of Hungarians in Slovakia, Transcarpathia and the Transmura Region (77.1 %, 71.8 % and 71.9 %, respectively) and slightly more than half of the Hungarians in Transylvania and Vojvodina (56.9 % and 56.1 % resp.) live in such ethnically (for them) favourable environments. However, 54.8 % of Hungarians inhabiting Croatia and 54.2 % of those in Burgenland are trying to preserve their identity in settlements where their proportion does not reach 10 %. The above-mentioned conditions and characteristic features of areas inhabited by Hungarians resulted in the following distribution of settlements with a Hungarian majority in about 1990: Transylvania 786, Slovakia 432, Vojvodina 80, Transcarpathia 78, Transmura Region 23, Croatia 9 and Burgenland 2. From the above it follows that there are considerable differences between conditions in the settlements system in regions of the Carpathian Basin populated by Hungarians. The proportion of those living in settlements with more than 5,000 inhabitants is the highest in Vojvodina (72.9 %), with small and medium-sized towns and large villages, and in Transylvania (57.2 %) which otherwise has extremely diverse conditions. Among Hungarian minorities the proportion of urban dwellers in centres with more than 100,000 inhabitants is also the highest in Transylvania (25.5 %). In Slovakia, Transcarpathia and Vojvodina this proportion reaches %. In settlements of less than 1,000 inhabitants, the population faces serious problems in providing an infrastructure and consequently in offering favourable living conditions, and suffers from increasing emigration. This is characteristic of Hungarians in the Slovenian Transmura Region (73.6 %), Croatia (33.9 %), Burgenland (29 %) and Slovakia (22.8 %). Conditions in settlement system are closely connected to the level of urbanisation of Hungarian minorities. So it is not surprising that the proportion of urban dwellers is the largest in Vojvodina and Transylvania (58.7 % and 56.1 %, resp) exceeding the national average (Yugoslavia 45.7 %, Rumania 54.3 %). Although the number of Hungarians inhabiting towns in the Carpathian Basin is on the increase as a whole, the rate of growth has remained far below that of the state-forming nations which is also due to accelerated assimilation. (E.g. figures show +4.2 % growth for Hungarians and % for Rumanians in Transylvanian towns between 1977 and 1992; the corresponding data was +0.2 % for Hungarians and +24 % for Ukrainians in Transcarpathian towns between 1979 and 1989). As a result there has been a steady decline in the Hungarian population in the overwhelming majority of towns in neighbouring countries. This trend is particularly striking in big towns with the largest communities of Hungarians (Marosvásárhely, Kolozsvár, Nagyvárad, Szatmárnémeti) (Tab. 6., Fig. 6.). 6 Partium: historico-geographical region denoting West Rumanian counties Arad, Bihar, Szatmár, Szilágy, Máramaros. 28
29 Table 6. The largest Hungarian communities beyond the borders of Hungary in the Carpathian Basin, according to census data (around 1980 and 1990, thousand persons) Settlements Marosvásárhely / Târgu Mureş R Kolozsvár / Cluj-Napoca R Nagyvárad / Oradea R Szatmárnémeti / Satu Mare R Sepsiszentgyörgy / Sfântu Gheorghe R Szabadka / Subotica Y Székelyudvarhely / Odorheiu Secuiesc R Csíkszereda / Miercurea Ciuc R Temesvár / Timişoara R Brassó / Braşov R Arad / Arad R Nagybánya / Baia Mare R Komárom / Komárno S Pozsony / Bratislava S Kézdivásárhely / Târgu Secuiesc R Dunaszerdahely / Dunajská Streda S Gyergyószentmiklós / Gheorgheni R Zenta / Senta Y Újvidék / Novi Sad Y Beregszász / Berehove U Nagybecskerek / Zrenjanin Y Nagykároly /Carei R Zilah / Zalău R Óbecse / Bečej Y Érsekújvár / Nové Zámky S Nagyszalonta / Salonta R Bácstopolya / Bačka Topola Y Szászrégen / Reghin R Kassa / Košice S Magyarkanizsa / Kanjiža Y Ada / Ada Y Abbreviations: R = Rumania (1977, 1992), S = Slovakia (1980, 1991), Y = Yugoslavia / Serbia (1981, 1991), U = Ukraine (1979, 1989) Of the 344 towns of the Carpathian Basin located beyond the Hungarian border only 24 showed a modest increase in ethnic Hungarian population during the 1980's. Most of them are small or medium-sized towns (14 in Slovakia and 7 in Transylvania), with a Hungarian-populated hinterland, from where a gradual emigration of the population of nations forming states and a simultaneous immigration of Hungarians modified the ethnic relations favourably for Hungarians 7. Hungarians give preference to villages 7 The proportion of ethnic Hungarians showed an increase in the following towns. In Slovakia ( ): Dunaszerdahely, Nagymegyer, Diószeg, Galánta, Vágsellye, Komárom, Ógyalla, Érsekújvár, Párkány, Ipolyság, Szepsi, Királyhelmec, Nagykapos, Tiszacsernyő; in Transylvania ( ): Székelyudvarhely, Szentegyházas, Gyergyószentmiklós, Tusnádfürdő, Barót, Érmihályfalva, Nagykároly, Segesvár, Erzsébetváros (The two former due to the rapid 29
30 in the Transmura Region (86.1 %), Croatia (64.2 %), Transcarpathia (62.3 %) and Slovakia (60.5%) offering relatively lower living standards, (and for this reason neglected by other ethnic groups and favourable for preserving the original ethnic structure - compared to towns). Besides emigration and immigration due to sudden changes in the political scene (e.g. in Croatia or Austria), the present demographic structure and situation has been determined by other statistics (birthrate, mortality rate, natural increase and decrease). Demographic parameters of Hungarians living beyond the borders - since it ceded its territories - are basically associated with socio-economic factors, and conditions created by the population policy of the given state. At the same time, changing patterns of natural reproduction of certain groups, rooted in history, still survive. Though there are no detailed ethnic demographic statistics for all the eight countries over the past several decades, and to compile such statistics seems to be unfeasible, partial data show that the decline in the birth rate and a growing mortality rate - or at least its stabilisation - has been a general trend for all the ethnic groups of the Carpathian region. Regretfully, the above demographic parameters show the most unfavourable statistics for ethnic Hungarians. As a result, at the beginning of the 1990's, birth rates for the Hungarian minorities exceeded mortality rates only in southern Slovakia and Transcarpathia, securing a natural increase for their communities for a couple of years, which is today a rarity in areas inhabited by Hungarians. Based on the statistics of Hungarians in Slovakia, Transcarpathia, Transylvania and Vojvodina, the average birth rate of Hungarian minorities in the Carpathian Basin in 1991/92 is even lower (10.2 %) than that of Hungary (12.2 %). Hungarians in Transcarpathia stand out with a birthrate of 15.4 %, surpassing the average of all neighbouring countries. Hungarians in Slovakia show a rate close to that of Hungary (15.4 %), but for those in Transylvania and Vojvodina the birthrate has dropped drastically, down to 9 % and 9.9 %, resp.). The mortality rate of Hungarian minorities (14.3 %) is close to that of Hungary (14.1 %) which is very high in comparison with the average of neighbouring countries, and less favourable than for the total population of Slovakia (10.1%), Transcarpathia (9.4 %) and Transylvania (12 %). Death rates were relatively lower for the Slovakian and Transcarpathian Hungarians (11.1 % and 10.9 %, resp.) with relatively younger populations and it was more severe for those of Vojvodina (19,3 %), abandoned by younger elements of the Hungarian population and now in a disastrous demographic position. Thus, a natural decrease in numbers of Hungarians beyond the borders (-4.1 %) exceeds that within the boundaries of Hungary (-1.9 %). The accelerating natural shrinkage of the population is primarily due to the trends affecting Hungarians in Transylvania (-5.8 %) and Vojvodina (-9.4 %) and can not be counterbalanced even by Transcarpathian (+4.5 %) and Slovakian (+1.5 %) Hungarians who retain their former dynamism of population. One of the most serious problems for Hungarians in the Carpathian Basin is an alarming natural decrease in population (-5.8 % in 1992) as a result of a drastic fall outmigration of Germans.); in Burgenland ( ): Felsőőr (As a result of the dissimilation of part of the formerly Germanised Hungarians and of an immigration from Hungary.). 30
31 Figure 6. The largest Hungarian communities beyond the borders of Hungary (around 1990) 31
32 in births and a similar growth in mortality. (In the 1980's natural change was similar to the Slovakian and Transcarpathian-Hungarian trends, approx. +4 %). It should be mentioned however that the Hungarian population of Transylvania is far from uniform as far as demography is concerned. Hungarians of the Székely Region have more positive demographic statistics than both the Hungarians and the whole of Transylvania (natural increase for the Székely Region +3.4 %, for Transylvania +2.7 % in 1990). To compare the above demographic features of Hungarians with other ethnic groups it should be mentioned that by 1992 a natural decrease was typical not only among the Hungarian minorities (-4.1 %) and in Hungary (-1.9 %), but in the Vojvodina province of Serbia (- 1.8 %), Burgenland in Austria (-1.8 %), in Croatia (-1.1 %) and Transylvania (-0.7 %), and a natural increase in Slovenia had dropped to 0.3 %. At the same time, from the regions bordering Hungary there was considerable natural growth in Transcarpathia (+6.6 %) and Slovakia (+4%). In the latter, however, national and Hungarian averages disguise significant regional disparities which emerged in the 19 th century. A traditionally low level of fertility and a severe ageing of population have led to a dominating trend of natural loss in the vicinity of Párkány, Zseliz, Léva, Ipolyság, Nagykürtös and Losonc. Demographic structure according to gender is generally influenced by several factors. As a rule the ageing of a given population, emigration from a region and war casualties diminish the proportion of males, while a higher fertility rate increases it. In the former case this can be attributed to a higher mortality of men, a greater share in the migration process and in war losses, in the latter case, to a surplus of males at birth. According to the 1990 census data the male/female ratio was similar for the Hungarian minorities and for Hungary (93.1 and 92.5 males resp. per 100 females). Apart from the data for Transcarpathia (85.7) still affected by the consequences of World War II, this figure is lower than that for Transylvania (97.1) and for Slovakia (95.3). Of the Hungarian minorities living in the neighbourhood, gender proportions are the most balanced in Slovakia (93.5) and in Transylvania (93.4), while in the case of Hungarian minorities in Croatia (83.4) and the Transmura Region (87.3), particularly affected by the war, they are most distorted. In Transylvania there was a curiosity in Hargita County, where high fertility resulted in a positive male/female ratio in 1992 (100,1 / 100.0). The age distribution of Hungarian minorities, the degree of their ageing - due to both the alarming natural and other demographic and assimilation trends (e.g. low natural reproduction and fertility, accelerating emigration of young people, loss of ethnic self-awareness and lingual assimilation) - is similar to those of the population of the Transmura Region, Vojvodina and Hungary. The proportion of children (up to 14 years old) was between % for Hungarians in Hungary, Transylvania and Slovakia, exceeding the ratio of children in Burgenland, Croatia and the Transmura Region with extremely low fertility rates (9.5 %, 11.1 % and 12.1 % resp.). The percentage of elderly people (60 years and over) showed the opposite: Hungarian minorities, and those elderly people living in Hungary were 19.7% and 18.9% respectively. They were surpassed by the ratio of elderly Hungarians in Burgenland, Croatia, the Transmura Region and Vojvodina (44. 7 %, 29.8 %, 26.3 %, 24.1 %, resp.). From the above it follows that a frequently -used demographic parameter, the index of ageing (elderly/100 children) shows 32
33 balanced average values for the Hungarian minorities as a whole (103.1), the Transmura Region (99.9), Vojvodina (95.1) and Hungary (92.2). The populations of Transcarpathia and Slovakia are quite young (47.9 and 59.6, resp.), while Burgenland s is rather old (496.6!). Comparing the aggregated index of ageing for Hungarians in the Carpathian Basin (94.4), with that of Yugoslavia (68.7), Rumania (72.2), Slovenia (79) and Ukraine (83.3) the latter indicate a much more favourable age distribution. As a consequence of four decades of socialism with its anticlerical and antireligious policies, the minorities' attitude to religion, the Church and religious identity, especially attitudes of the younger generations who grew up under a totally new political system, underwent a profound change. Hungarians beyond the borders, being minorities, adhered to the Church and religion as symbols of ethnic identity, and were less affected by secularisation than the state forming ethnic groups of the Carpathian Basin. This is proven by the fact that the proportion of those declaring themselves to be atheists (nonreligious) or not responding to the question in the censuses of around 1990, only reached 5.2 % for the Hungarian minorities, while the same value was much higher for Slovakia, Slovenia, Hungary and Austria (27.2 %, 23.5 %, 14.9 %, 12.1 % resp.). Nevertheless, these people without any religious affiliation (an average of 5.2 %) showed considerable disparity with regard to the "index of secularisation", from Transylvanian Hungarians (0.3 %) struggling for survival in an Eastern Orthodox Rumanian environment, to Slovakian Hungarians (19.5 %) with a similar religious structure to state forming nation (Slovaks). The distribution by denomination of Hungarians declaring themselves religious during the last census has been modified by objective and subjective circumstances influencing over the past half of a century ethnic relations (natural change and mobility, socio-political conditions, processes of assimilation, etc.). Presently the religious composition of Hungarians in the Carpathian Basin shows the following pattern: 57.6 % (7.4 million) Roman Catholics, 22.8 % (2.9 million) Reformed (Calvinists), 3.6 % (470 thousand) Lutherans, 2.2 % (290 thousand) Greek Catholics and approx. 13 % (1.7 million) without or with unknown religious affiliation. Compared with the above average values, there are relatively more Roman Catholics and Lutherans among the Hungarians of Hungary, while beyond the borders Calvinists and Unitarians have a higher ratio 8. At the beginning of the 1990 s religious denominations of Hungarian minorities were as follows: 51.8 % Roman Catholics, 34.2 % Calvinists, 2.7 % Unitarians and 2.1 % Greek Catholics. Roman Catholics prevail (65 % to 88 %) among the Hungarians of Vojvodina, the Transmura Region, Burgenland, Croatia and Slovakia. A relative majority of Transylvanian and Transcarpathian Hungarians (47.4 % and 46.9 %, resp.) belong to the Calvinist Church. Communities with a Calvinist majority are to be found in southern Slovakia in the environs of towns like Nagymegyer, Komárom and Zseliz; in the Gömör region they are strongly mixed with Roman Catholics, while they constitute a minor 8 Distribution of the population of Hungary by denomination in 1989: 57.8 % Roman Catholics, 2.2 % Greek Catholics, 19.3 % Reformed, 4.1 % Lutherans, 13.1 non-religious, atheists, with no religious affiliation, etc. (Gesztelyi, T. /ed./ 1991, Egyházak és vallások a mai Magyarországon (Churches and Denominations in Hungary), Akadémiai Kiadó, Budapest, 20. p.) 33
34 denomination in the Gömör-Torna (Slovakian) Karst Region. Within the other groups of Hungarians along the border, from Nagykapos in Slovakia through to Beregszász in Transcarpathia, and from Szatmárnémeti, and Érmihályfalva up to Nagyszalonta in Rumania, the Calvinist Church is prominent among local Hungarians (in spite of a high number of Roman Catholics living in the valley of the Ung River, and in Szatm r County and of Greek Catholics in the Bereg and Ugocsa regions). Even more Calvinists live among the Hungarians of Szilágyság, Kalotaszeg, Mezőség and in the southwestern part of the Székely Region. In the latter, most religious Hungarians belong to the Calvinist and Unitarian churches along the western and southern margins of Udvarhelyszék. The main bases of the Roman Catholics in Transylvania are in the northern third of the Udvarhelyszék, Gyergyó, Csík, Kászon and Kézdi regions, and there are scattered communities in Bánát, in the environs of Arad. Among the Hungarians of Serbia, Croatia and Slovenia the population is overwhelmingly Roman Catholic. The Calvinist Church has a majority in only 3-4 villages 9. In spite of the scanty and scarce data available, investigations into the structure of Hungarian families living outside the borders shed light on fertility, natural changes and assimilation phenomena which make it possible to make forecasts for the future. The proportion of incomplete families owing to mortality and divorce is slightly lower in Hungarian families in Transylvania and Slovakia (12.7 % and 13 % resp.) than in those of Hungary (15.5 %). A higher extent of ageing, a lower fertility rate,and the later age of having children has meant the ratio of families without dependent children among the Hungarian minority is higher compared with the national average of not only the neighbouring countries, but of Hungary with its notorious demographic trends: Hungarians in Slovakia (43.6 %), Transylvania (35.6 %), Vojvodina (42.3 %); Slovakia as a whole (39.6 %), Transylvania (32.3 %), Hungary (34.3 %). An overwhelming number of Hungarians in an environment occupied by a majority of the same religious affiliation, similar cultural background and mentality already live in ethnic mixed families. The proportion of these people (married to a person of a different ethnicity and with a different mother tongue) has reached 30.3 % in Slovakia and 42 % in Burgenland. Here, owing to a change to another language of their children, and a loss of their national awareness, there may follow a demographic erosion of the affected ethnic community and put under question its very survival. The social stratification of Hungarian minorities related to their economic activity (work, occupation) shows a correlation with several other factors (e.g. distribution of population by gender, age, educational level - qualifications, skills - physical and social environment of settlements, historical background, and traditions). Nearly half (44-49 %) of all women are active earners due to a steady ageing of the population, a growing proportion of those of productive age and an increased proportion of working wom- 9 The mentioned villages are the following. In Vojvodina (Serbia): Bácsfeketehegy, Bácskossuthfalva (Ómoravica), Pacsér, in Baranya (Croatia): Kopács, Laskó, Várdaróc, in East Slavonia: Haraszti and in Transmura Region (Slovenia): Szécsiszentlászló, Kisszerdahely, Csekefa. In Croatia the East Slavonian Kórógy and Szentlászló used to be communities with Calvinist Hungarian majority until the flight of their population during the Serbo-Croatian War in
35 en, formerly working in the home. However, as a result of an alarming decline in natural reproduction, ageing and emigration, a decrease in the number of people of active age in the present grave economic circumstances might involve a drop in the employment level of women and an increased number of forced retirements to avoid unemployment. As a consequence, a rise in the proportion of the non-working population may occur at the expense of Hungarian active earners, putting an increasing burden on them in the near future. The geographic environment and economic background of Hungarians living beyond the borders are to some extent reflected in their occupations and economic groups. Social grouping is following international trends (albeit delayed), and has led from the primary sector (e.g. agriculture) to secondary sectors (e.g. mining, construction, manufacturing), and from secondary sectors to tertiary ones (e.g. commerce, transport and telecommunications, culture and other non-productive activities). Together with the natural environment, the character of the settlement and the economic and regional development policy of the given state, agriculture still plays a relatively significant role in Hungarian communities. The contribution of this sector is especially high in the case of Hungarian minorities in those regions where 60-86% of the population live in rural settlements: in Croatia (41.8 %), the Transmura Region (32.1 %), South Slovakia (23.8 %) and Vojvodina (26.7 %), the latter being considered the bread box of Yugoslavia. The average number of people actively engaged in agriculture in the Carpathian Basin varies between 14 and 26 %; with a figure for the Hungarians of Transylvania (16.2 %) showing the maximum. This has resulted in a particularly high involvement of active earners in the secondary (i.e. industrial) sectors (52.7 %) well above the Rumanian average (44.7 %). This can be attributed partly to the hastened industrialisation of Transylvania during the past decades, and partly to the geographical environment of the area of Hungarian settlement. Due mainly to the Székely Region, the Hungarian share in certain branches of light industry (timber processing, furniture making, leather and textile industries) and construction is well above average. The building industry has traditionally been important among Hungarian workers living in peripheral regions, with a scarcity of non-agricultural employment and a high ratio of commuting workers (e.g. South Slovakia, Transcarpathia). The proportion in the tertiary sector - used recently for measuring the level of economic development - remains below national average figures (32-59 %) and those of Hungary (46.5 %) for Hungarian minorities everywhere. In certain categories of employment requiring a high level of skill and qualifications, those belonging to the spheres of education, culture, science and administration, the proportion of Hungarians is below average. For example, in Slovakia where the figure for Slovakians is 1.5% in science and education, it is only 0.5% for Hungarians; in Rumania, where the Rumanian average is 2.4%, it is 1.5%. The level of education and qualifications of Hungarian minorities has developed closely alongside the above trends. Hungarians beyond the state borders are seriously handicapped compared with the majority nations as far as education and qualifications are concerned, which basically influences their marketability and job opportunities. The "knowledge industry" (system of education) which produces human capital and resources is being upgraded all over the world, and this causes a grave situation for the 35
36 Hungarian minorities in the Carpathian Basin who have not been provided with a modern education system. In certain neighbouring countries there have been (open or disguised) moves to eliminate education in Hungarian, so in some communities the ratio of persons with higher qualifications within the population of over 24 years only reaches a maximum half of the national average: this figure is 4.7 % for Hungarians in both Slovakia and Transylvania, 5.9 % for those of Vojvodina, 10.1 % for Hungary, 9.8 % in Slovakia, 6.9 % in Rumania, and 10.8 % in Yugoslavia. These unfavourable statistics for Hungarian minorities are due to various factors. In the case of Hungarians in Slovakia historical circumstances are responsible (removal and deportation of the Hungarian intelligentsia between 1945 and 1949, a complete elimination of the school system after 1945 and a postponement of Hungarian education till the 1950's etc.) In the case of minorities in Transcarpathia, Transylvania and Vojvodina alarmingly large-scale emigration of Hungarian "human resources" has taken place over the past ten years. A mediating factor in the generally frustrating picture of the educational level is that Hungarian minorities are underrepresented in the lower sections of the "educational pyramid". The rate of illiteracy among Hungarians in Transylvania and Vojvodina (1 % and 2.4 % resp.) 10 is well below that the of Rumanians and Serbs (3 % and 4.9 %) in the same regions. The fact that regions with a majority Hungarian population are found not further than km from the borders, can be regarded in more ways than one. For the Hungarian minority this is favourable, since ethnic identity and the purity of the mother tongue can be best preserved in close proximity to Hungary through permanent and most of the time exclusive relations (personal, mass communication, etc.). The advantage to the Hungarian minority, as compared to the Ruthenians, Rumanians or Slovaks who live in the same areas together with them, manifested itself during the last few years in the development of a market economy along the borders, especially in Transcarpathia, Transylvania and Slovakia. This results from their permanent relations with the mother country, and their being bilingual. Through their strong political organisations and parties, Hungarians play an important role in the political life of Slovakia, Transcarpathia, Rumania (Transylvania), and Serbia. In the case of Slovakia, Rumania, and Serbia (Yugoslavia) the existence of frontier zones with a majority Hungarian population can be judged in two ways. From the point of view of the (Slovakian, Rumanian, Serbian) nationalist forces, which are aspiring to create a homogeneous national state, these areas are incredibly dangerous and unstable. They regard them as the "fifth column" of Hungarian irredentism and revanchism, and thus as areas inhabited by the inner enemy. The ethnical loosening up and the homogenisation of these geopolitically dangerous areas is a most urgent mission. According to the other view as yet not very widespread these areas will not be the scenes of redrawing the borders or of nationalistic fights in the near future. On the contrary, following the examples of Western Europe, they will be must be a means of international integration (based on their bilingual population), and encourage ever-closer 10 Rate of illiteracy is referred to people over 12 years for Hungarians of Transylvania and over 15 years for those of Vojvodina. 36
37 co-operation between the different national economies. Such tendencies have been observed lately in Slovenia, with its minorities living in Austria and Italy, and even in the Ukraine, along the border with Hungary. In our opinion, the over 3 million European Hungarians who live outside the territory of the Republic of Hungary and are bilingual and bicultural, will play an important role as mediators in political and economic co-operation among the nations in the Carpatho-Pannonian area. Hopefully, this will happen in the not too distant future. 37
38 Chapter 2 THE HUNGARIANS OF SLOVAKIA In the Slovak Republic s most recent census (March 3 rd, 1991) 567,296 people declared themselves to be ethnically Hungarian, while 608,221 said they were Hungarian native speakers. Similar to census data of Hungary and other countries, the abovementioned figure differs from the estimated size of the given ethnic group, or in this case, the number of people claiming and cultivating Hungarian national traditions and culture. In Slovakia, according to ethno-historical, demographic and migration statistics, but not including linguistic assimilation, the estimated number of Hungarian native speakers could well have been 653,000 in 1991in our opinion. This figure corresponds to the population of the Hungarian counties of Győr-Moson-Sopron and Komárom. According to the latest census data, the Hungarian national minority represents 10.7% of Slovakia s population, 4.4% of the total number of Hungarians in the Carpathian basin and 22.3% of Hungarians in the Carpathian Basin living beyond Hungary s borders. THE NATURAL ENVIRONMENT The majority of the Hungarian national minority of Slovakia live on the plains (62%). Their settlements can be found along the Danubian (55%) and East-Slovakian (7%) lowlands. With the exception of the alluvial soil alongside larger rivers, the Hungarian-inhabited plains which are almost exclusively used for agriculture are characterised by meadow soil (southern part of Csallóköz 1, along the river Dudvág and in Bodrogköz 2 ), and chernozem (northern part of Csallóköz, the regions between Vág- Nyitra and Zsitva-Garam). From the viewpoint of the Carpathian Basin, the Danubian Lowland can be considered as a part of the Little Hungarian Plain (Kisalföld). Its most important rivers are the Danube, Little-Danube and Vág, their floodplains are bordered by groves. The Nyitra, Zsitva and Dudvág considered as tributaries of the Vág, are also worth mentioning. Csallóköz and the territory between the Little Danube and Vág are excellent for agricultural production and play a significant role in the republic s foodsupply. (Fig. 7.) 1 Csallóköz (Slovak: Žitný ostrov, German: Große Schütt-Insel). Region almost exclusively by Hungarians inhabited in Southwest Slovakia between the Danube (Hungarian: Duna, Slovak: Dunaj) and Little Danube (Hungarian: Kis-Duna, Slovak: Malý Dunaj) rivers. 2 Bodrogköz (Slovak: Medzibodrožie). Region almost exclusively by Hungarians inhabited in Northeast Hungary and Southeast Slovakia between the Tisza, Bodrog and Latorca rivers. 38
39 Figure 7. Important Hungarian geographical names in South Slovakia 39
40 One third of Hungarians inhabit the hills (along the Garam and Ipoly Rivers) and the Ipoly, Losonc, Rima and Kassa basins. In adapting to the hilly environment, the majority of settlements in these regions (Bars, Hont, Nógrád, Gömör and Abaúj) remained in the small and tiny village category. This creates special difficulties in supplying communities with fundamental institutions. These hilly regions, covered mostly by brown earth and brown forest soil, contain a few important rivers (Garam, Ipoly, Sajó, Hernád) and streams (Szikince, Kürtös, Rima, Balog, etc.). Only one of out of twenty Hungarians in Slovakia inhabit the highlands. The majority of them live among the rendzina soil covered dolomite and limestone cliffs such as Gömör-Torna (Slovakian) Karst, the Rozsnyó basin, and the Karancs-Medves Region with basalt cones (Somoskő Mt., Ragács Mt., the hill of Béna etc.) in the southern corners of Nógrád and Gömör in Slovakia. The most important water sources of the above-mentioned regions are the Gortva, Torna and Bódva streams. ETHNIC PROCESSES DURING THE PAST FIVE HUNDRED YEARS By the end of the Middle Age, at the time of the taxation census of 1495, in the territory of the Upper Hungarian counties 3 there were at least 413,500 people 4, probably 45 % were Slavs 5 (Slovaks and Ruthenians) 38 % of them were Hungarians and 17 % Germans (Tab. 7.). Of the counties investigated an absolute majority was formed by Germans in the counties of Pozsony and Szepes and by Hungarians in Gömör, Abaúj, Torna and Zemplén. All of the ten most populous towns which had 1,500 4,500 people (Pozsony, Kassa, Nagyszombat, Eperjes, Bártfa, Besztercebánya, Selmecbánya, Lőcse, Késmárk és Körmöcbánya) 6 had a German majority, but the Hun garian and Slovak 3 Upper Hungary included the counties of Pozsony, Nyitra, Bars, Hont, Trencsén, Turóc, Árva, Liptó, Zólyom, Gömör, Szepes, Abaúj, Torna, Sáros and Zemplén. 4 Source of national and county data on population at the time of the 1495 census: Kubinyi A A Magyar Királyság népessége a 15. század végén (Population of the Kingdom of Hungary at the end of 15 th century), Történelmi Szemle XXXVIII. 2-3.pp Data on ethnic composition are estimations by the author. 5 According to our estimates the ratio of Hungarians and of Slovaks could be around 38 % each in the area of the counties of Upper Hungary. 6 Population numbers at the turn of the 15 th and 16 th centuries: 4,000-5,000: Pozsony, Kassa, about 3,500: Nagyszombat, Eperjes, Bártfa, 3,000: Besztercebánya, 2,500: Selmecbánya, 2,000: Lőcse, 1,500: Körmöcbánya. Sources: Paulinyi, O A garamvidéki bányavárosok lakosságának lélekszáma a XVI.sz. derekán (Population of the minig towns of Garam Region (Pohronie) in the middle of 16 th century), Történelmi Szemle pp , Gácsová, A Niektoré aspekty počtu majetnosti obyvateľov vychodoslovnských miest v stredoveku (Some aspects of the number of possessions of inhabitants of East Slovakian towns in the Middle Ages) in: Spišské mestá v stredoveku, VV, Košice, Iványi, B ibid., Fügedi, E Kaschau, eine osteuropäische Handelstadt am Ende des 15. Jahrhunderts, Studia Slavica II.1-4.pp , Granasztói Gy.1980 A középkori magyar város (The medieval Hungarian town), Gondolat, Budapest, 157.p., Szabó, I A magyarság életrajza (Biography of the Hungarians), Magyar Történelmi Társulat, Budapest, 40
41 Sources: 1495: Estimation of Kocsis K. based on Fig.9. and Kubinyi A A Magyar Királyság népessége a 15. század végén Történelmi Szemle XXXVIII pp , 1720: Acsády I Magyarország népessége a Pragmatica Sanctio korában Magyar Statisztikai Közlemények XII. /Új folyam/, Budapest 1787: Danyi D. - Dávid Z Az első magyarországi népszámlálás ( ), KSH, Budapest 1840: Fényes E Magyarország statistikája I., Pest 1850: Hornyánsky, V Geographisches Lexikon des Königreiches Ungarn, G. Heckenast, Pest 1857: Fényes Elek 1867 A Magyar Birodalom nemzetiségei és ezek száma vármegyék és járások szerint, Pest 1869: Keleti K Hazánk és népe a közgazdaság és a társadalmi statistika szempontjából, Athenaeum, Pest 1880: A Magyar Korona országaiban az év elején végrehajtott népszámlálás...országos Magyar Királyi Statisztikai Hivatal, Budapest : Jekelfalussy József (szerk.) 1892 A Magyar Korona országainak helységnévtára, Országos M. Kir. Statisztikai Hivatal, Budapest, 1900: A Magyar Korona országainak évi népszámlálása 1. rész A népesség általános leírása községenkint, Magyar Statisztikai Közlemények I., 1910: A Magyar Szent Korona országainak évi népszámlálása 1. rész Magyar Statisztikai Közlemények : Soznam miest na Slovensku podľa popisu ľudu z roku 1919., Ministerstvo s plnou mocou pre spravu Slovenska, Bratislava, 1920, Az 1920.évi népszámlálás I. A népesség főbb demográfiai adatai , Magyar Kir. Központi Statisztikai Hivatal, Budapest Remarks: Upper Hungary = Territory of Pozsony, Nyitra, Bars, Hont, Trencsén, Turóc, Árva, Liptó, Zólyom, Gömör-Kis-Hont, Szepes, Abaúj-Torna, Sáros, Zemplén Counties (1914). Slovaks include Ruthenians in 1495 and in Table 7. Ethnic structure of the population of Upper Hungary ( ) Year Total population Hungarians Slovaks Ruthenians Germans Jews Others number % number % number % number % number % number % number % , , , , ,974, , ,454, , ,459, , , , ,262, , ,401, , , , , ,286, , ,346, , , ,471, , ,474, , , ,458, , ,512, , , , ,571, , ,555, , , , ,777, , ,642, , , , ,904, , ,613, , , , ,917, , ,859, , , ,
42 minorities were numerous. Apart from the above-mentioned towns the German ethnic region extended to the area situated between the German towns of Somorja Szenc Nagyszombat and the Little Carpathians and to the northern and southern foreland of Pozsony (Fig. 8.). The German (Saxon) ethnic area also included most of Szepes County, but they had been increasingly losing ground to both the Goral-Polish ethnic group and Ruthenians in the northern areas (Szepesi Magura, Dunajec), and to Slovaks in the Hernád Valley and in a strip along the Poprád-Lőcse-Szepesvár main road. Beside the Szepes and Pozsony German ethnic blocks there were a number of ethnic pockets of Germans in the counties of Sáros (Eperjes, Bártfa, Kisszeben), Abaúj (Kassa, Abaújszina, Szepsi), North Gömör (Rozsnyó, Dobsina, Csetnek, Alsósajó) and in present-day Central Slovakia (Besztercebánya, Zólyom, Korpona, Selmecbánya, Újbánya, Körmöcbánya, Nyitrapróna and their surroundings). In this period the northern "boundary" of the Hungarian ethnic area (more precisely a Hungarian-Slovak, or in some places a Hungarian-German contact zone) had stabilised along the line stretching between Somorja-Nagyszombat-Galgóc-Nyitra-Léva- Losonc-Rimaszombat-Rozsnyó-Jászó-Kassa-Gálszécs-Nagymihály. It could by no means be considered a rigid ethnic bundary, for sizeable Hungarian and Slovak minorities lived north and south of this line, especially in the central areas of Nyitra, Hont, and Zemplén 7 counties. Similar to the Slovaks, most of the Hungarians of Upper Hungary were rural dwellers at the end of the 15 th century. They formed significant urban blocks only due to their penetration of towns founded by Germans (e.g. Eperjes, Kassa, Korpona, Bélabánya, Nyitra, Galgóc, Nagyszombat, Pozsony). Within the area of Hungarian settlement besides the above-mentioned market towns only the Hungarians in Komárom had a sizeable population. At that time the Slovak ethnic area extended mainly to the inter-mountain basins, river valleys and the southern foreland of the Western Carpathians. The mountain regions of Árva and North Trencsén, the High and Low Tatras and Gömör-Szepes (today Slovak) Ore Mountains were uninhabited dense woodland. Along the northeastern borderland, on the northern periphery of Zemplén and Sáros counties and in the marginal areas of Szepes and Gömör a gradually expanding ethnic area of Ruthenians pursuing a pastoral way of life was being established. The victory of the Ottoman Turks at Mohács (1526) not only signalled the fall of the Hungarian Kingdom considered at that time to be a middle-sized European power, but initiated a profound transformation in the ethnic patterns in the southern and central areas of the country. Military operations and destruction had soon reached territories now belonging to Slovakia (1529, 1543) 8. Even prior to this, a massive flight of Hunga- 7 Bakács, I I Hont vármegye Mohács előtt (Hont County before 1526), Akadémiai Kiadó, Budapest,33.p., Kniezsa I Adalékok a magyar-szlovák nyelvhatár történetéhez (Contributions to the history of the Hungarian-Slovak ethnic boundary), Budapest, pp , Mainly after the Ottoman campaign against Vienna in 1529 and after the fall of Esztergom (1543), the centre of the Hungarian Catholic Church. 42

43 Figure 8. Ethnic map of the present-day territory of Slovakia (late 15 th century) Main sources: Bakács I Hont vármegye Mohács előtt, Akadémiai Kiadó, Budapest, Fekete Nagy A A Szepesség területi és társadalmi kialakulása, Budapest, Fügedi E Nyitra megye betelepülése, Budapest, Ila B. 1976, 1944, 1946, 1968 Gömör megye I-IV., MTA, Budapest, Kniezsa I Adalékok a magyar-szlovák nyelvhatár történetéhez, Athenaeum, Budapest, Marsina, R. - Kušík, M Urbáre feudálnych panstiev na Slovensku I., Vydavateľstvo SAV, Bratislava, Varsik, B. 1964, 1973, 1977 Osídlenie Košickej kotliny I-III., SAV, Bratislava, Varsik, B Nemecká kolonizácia na území bratislavskej stolice v storočí in: Varsik, B Z osídlenia západného Slovenska v stredoveku, Veda, Bratislava, Vlastivedný slovník obcí na Slovensku I-III. Veda, Bratislava,
44 rians and Croats 9 had started. Refugees from Croatian-Slavonian territories occupied by the Turks inhabited nearly 20 villages, primarily around Pozsony and Nagyszombat 10, from where the German population had perished or escaped between 1529 and 1553, due to the destruction and intimidation of the Ottoman and Habsburg troops. These depopulated German villages became repopulated not only by Croats but by Slovaks (in the vicinity of Nagyszombat, Bazin, Modor) and Hungarians (e.g. in Pozsonyivánka, Cseklész, Éberhard, Szenc and Németgurab). In this period, particularly following the surrender of Esztergom (1543) a massive move of Hungarians started to Nagyszombat, to where the seat of the Hungarian Roman Catholic archbishop was transferred. As a result,until the beginning of the 18 th century this town became a settlement with a relative Hungarian majority. Between 1543 and 1575, after the surrender of fortresses and castles which had protected the counties of Komárom, Esztergom, Bars, Hont, Nógrád and Gömör against the Turks 11 large numbers of Hungarians 12 fled the river valleys and hill regions, depopulating these areas. This followed the war losses, the carrying off of some of the population, the heavy burden of taxation, and a lack of both personal security and that of their property. As a consequence, between 1495 and 1598 the population of counties such as Komárom, Hont and Gömör had dropped by one third. The number of existing settlements between the mid-15 th century and 1598 in the present-day Slovakian counties of Komárom and Esztergom decreased from 106 to 55, and between 1427 and 1572 in Gömör County the number fell from 340 to Apart from the destruction caused by warfare, in these borderland areas between the Habsburg Empire and the Ottoman Empire a doubling of taxation (imposed on the population by Habsburg-Hungarians and Ottoman-Turks) also contributed to accelerating depopulation and to the large-scale exodus of predominantly Hungarian and to a lesser extent, Slovak serfs. Owing to Hungarians fleeing northwards and a Hungarian majority prevailing within the outskirts of towns in the second half of the 16 th century, there was an intensifying Magyarization of towns with a German character such as Kassa, Eperjes, Szepsi and Rozsnyó. At the same time, in towns situated far away from the Hungarian ethnic areas the proportion of Hungarians (mainly arriving as refugees) within the local population, which was predominantly Slovak and German, was relative- 9 Refugees from Croatia first appeared in present-day Slovakia in (Ritig-Beljak, N Gradišćanski hrvati Croats of Burgenland - in: Enciklopedije Jugoslavije 4., Zagreb, 485.p. 10 The villages repopulated by Croats: e.g. Horvátjárfalu, Dunacsún, Oroszvár, Lamacs, Pozsonyhidegkút, Dévényújfalu, Mászt, Zohor, Németbél, Horvátgurab, Nagysenkőc, Kárpáthalas, Felsőhosszúfalu, Nahács, Selpőc. 11 e.g. Esztergom (1543), Ság, Drégely, Gyarmat, Szécsény (1552), Salgó, Fülek (1554), Ajnácskő (1566), Divény (1575). 12 Csapodi Cs Bars megye Verebélyi járásának nemzetiségi viszonyai az újkorban (Ethnic structure of the District of Verebély -Vráble of Bars County in the New Age), Magyar Történettudományi Intézet, Budapest, Ila B Gömör megye (Gömör County) I., Akadémiai Kiadó, Budapest 13 Žudel, J Stolice na Slovensku (Counties in Slovakia), Obzor, Bratislava, 70., 107.p., Ila, B ibid. 266.p. 44
45 ly high e.g. 14 Sztropkó 35.7 %, (1569), Garamszentkereszt 26 % (1573), Bát 36 % (1664), Bakabánya 32 % (1664), Nagytapolcsány 21 % (1664). On the other hand, in Hungarian towns situated within the Hungarian-Slovak ethnic contact zone, which was particularly prone to the destruction caused by military operations, the proportion of Hungarians (or at least taxpayers bearing a Hungarian name) dropped considerably during the 16 th and 17 th centuries owing to a massive resettlement of Slovaks from the surroundings: Léva 72 % (1554), Losonc 63 % (1596), Rimaszombat 82 % (1596), Tőketerebes 69 % (1601) and Gálszécs 83 % (1601) 15. In the 16 th and 17 th centuries i.e. at the time of military campaigns 16 especially affecting southern areas of the present-day Slovakia which were inhabited by Hungarians, high intensity colonisation took place in the more protected mountain regions. Slavs pursuing a pastoral lifestyle settled here who had a Vlach right. The number of these settlements reached by the end of the 17 th century. This colonisation by Goral- Poles and Slovaks was especially typical in the counties of Árva, Trencsén, Liptó and Szepes 18. In this colonisation with its Vlach right system Ruthenians only formed a minority in the 17 th century while Slovaks retreated to the mostly uninhabited alpine meadows and mountain woodlands which provided security in time of war 19. Starting in the 16 th century the area of Slovak settlement expanded, not only with the colonisation of Vlach shepherds, but also with the formation of many scattered settlements (for example: in Slovak "kopanice, rale, štále, lazy, samoty") in the mountains - called "kopaničiarska kolonizácia" in Slovakian. These were particularly in the Trencsén (e.g. White Carpathians) and Nyitra counties (e.g. Miava Hills) and along the boundary between Zólyom and Nógrád (e.g. in the vicinity of Gyetva) 20. This latter process resulted in an abundance of scattered mountain settlements colonised by Slovak farmers who had escaped from areas affected by war (mainly by the Turks), who were seeking areas to cultivate. In the western region, a gradual shrinking of the German ethnic area and its Slovakisation was somewhat counterbalanced by the massive settlement of German- 14 Marsina, R. - Kušík, M Urbáre feudálnych panstiev na Slovensku (Urbars of the feudal estates in Slovakia) I-II., SAV, Bratislava 15 After Marsina, R. - Kušík, M ibid. 16 E.g. the 15 and 30 years wars ( , ), a military campaign of the Turks in , a struggle led by Prince I. Thököly (a vassal of the Ottoman Empire) against the Habsburgs ( ). 17 Verešík, J Osídlenie Slovenska (Settlement of Slovakia) - in: Slovensko, Ľud - I. Časť, Obzor, Bratislava, 460.p. 18 A th century expansion of Gorals was especially typical in the northern margin counties of Trencsén, Árva and Szepes. However, in the 16 th century on the estates of the Zápolya and Podmaniczky families (e.g. around Trencsén, Ilava, Kasza, Zsolnalitva, Lednic, Ugróc) most of the Vlachs were considered Slovaks (Ratkoš, P Rozvoj valašského ovčiarstva a jeho prírodné podmienky v storočí (Development of Vlach shepherdship and its natural conditions), Nové obzory 26., 142.p.). 19 Ila B ibid. 320.p. 20 Verešík, J ibid. pp
46 speaking Habans 21 in the mid-16 th century in the vicinity of Szakolca in Nyitra County (e.g. Ószombat, Gázlós, Holics, Sasvár, Szentistvánfalva and Kátó). In the course of the counter-reformation (the re-catholisation of the 17 th century), most of them were expelled, and the rest gradually underwent Slovakisation. Between 1495 and 1598 due to the migration of Slovaks, Hungarians and Gorals mentioned above and relatively low war losses, the population increased for the counties of Árva (+200 %), Sáros ( %), Nyitra and Trencsén (both 110 %) 22. In the period between 1598 and 1640 chiefly during the 15 and 30 year wars when the total population of the Upper Hungarian counties dropped from 644 thousand to 608 thousand (-5.6 %), the above-mentioned colonisation by Slavs continued (Vlachs i.e. Slovaks, Ruthenians, Gorals) in the relatively protected environment of the mountains. As a result, the population increased by 27.7 %, to 249 thousand in the counties of Trencsén, Zólyom, Árva, Szepes and Zemplén with their Slavic ethnic majority, which offered a fairly protected environment. In the second half of the 17 th century, after the surrender of the Érsekújvár fortress (1663), most of the Hungarian ethnic area north of the Danube captured by the Turks became a terrain for military operations until In spite of a massive exodus, and the carrying off and killing of the Hungarian population, by the 1664 Turkish tax census of the Érsekújvár eyalet (province) 23, most people liable to taxation living in the heavily depopulated area between the Danube and the hilly region were Hungarians (roughly up to the Galgóc - Appony - Lédec - Léva - Palást line). The most populous towns with % Hungarians were Nagysalló, Verebély, Szőgyén, Sempte and Komját (with taxpayers) 24. Despite wars and epidemics, the Hungarian ethnic block maintained its previously solid extension of the 15 th and 16 th centuries in the eastern part of Upper Hungary. Moreover, on the basis of the analysis of surnames, of the 676 registered burgers living in the present-day city of Kassa in East Slovakia, which had had a German ethnic majority until the mid-16 th century, 72.5 % may have been 21 Habáns: Anabaptist religious community, the members of which escaped from Switzerland through Austria and Moravia and settled in Upper Hungary after During the counterreformation of the 17 th century the majority fled to Transylvania, then abroad. Among the Habáns there were especially skilled artisans and those who produced faiance ceramics. 22 For the same period the combined population of the West Hungarian counties of Vas and Sopron received many refugees, German and Croatian colonists, increased by a mere 42.9 %. (Kubinyi A ibid. pp , Bakács I A török hódoltság korának népessége (Population of the Hungarian territories under Ottoman-Turkish authority) in: Kovacsics J. (Ed.) Magyarország történeti demográfiája, Budapest, 129.p. 23 Blaskovics J Érsekújvár és vidéke a török hódoltság korában (Érsekújvár and its environs in the time of the Turkish occupation), Állami Gorkij Könyvtár, Budapest, 841p. 24 Nyitra, Léva towns of Hungarian ethnic majority and taken back from the Ottomans in 1664 did not figure in the Turkish tax statistics (defter). At that time Érsekújvár as the most important fortress of the region accommodated mainly moslem garrison troops (Bosnians, Turks). At the same time of 583 heads of household paying tax in Galgóc 48.9 % were Slovaks, 4,1 % Germans and 47 % Hungarians. 46
47 Hungarian, 13.2 % German and 14.3 % Slovak or of uncertain origin (1650) 25. Starting with the second half of the 17 th century, the Turkish campaigns, incursions and wars of independence led by princes I. Thököly ( ) and F. Rákóczi II. ( ) were a serious blow to Hungarian ethnic blocks almost everywhere in Upper Hungary 26. Conditions were created for the spontaneous movement or settlement in places abandoned by Hungarians of the large population of Slovaks from the mountains. This was also instigated by the landowners. Following the failure of the war of independence led by F. Rákóczi II., the territory of the Hungarian Kingdom lay in ruins (and the Carpathian Basin in general). There was a movement to restore a balance between the relatively overpopulated northern and western peripheries and the depopulated central and southern regions. This was controlled by the geographic distribution of fertile land which was to be cultivated and resulted in a massive southward migration of Hungarians and Slovaks. There had been a movement of Slovaks (and some Ruthenians) in increasing numbers from the mountainous regions which had provided shelter during wars and epidemics to the areas where Hungarians had died or emigrated. At the beginning of this enormous migration, tax censuses were taking place in 1715 and During the first 69,704 households paying tax on the territory of present-day Slovakia were registered, and 61,084 such households were recorded in the counties of Upper Hungary. Although I. Acsády (1896) and his colleagues were often mistaken in their population estimations and their ethnic composition 28, in the case of Upper Hungary their calculations seem to have been quite reliable: 67.6 % Slavs, 22.9 % Hungarians, 17 % Germans and 2 % others. In 1720 of the 63 largest towns on the territory of present-day Slovakia with at least 100 taxpaying households 40 had a Slovak majority, 14 a German and 9 a Hungarian majority 29. The greatest number of taxpaying households were registered among Hungarians in Komárom (657), Rimaszombat (228), Kassa (205), Léva (191) and Rozsnyó (180), and of Slovaks in Szakolca (430), Selmecbánya (424), Besztercebánya (211) and Ótura (202), and of Germans in Pozsony (704), Körmöcbánya (584), Selmecbánya (360), Lőcse (338) and Késmárk (268). A picture of the rapidly-changing rural ethnic pattern in the first half of the 18 th century, 25 Kerekes L Polgári társadalmunk a XVII. században (Our civil society in 17 th century - Košice), Kassa, pp The population of Kassa in 1661 according to Evlia Cselebi, the famous Turkish traveller was composed by "...Hungarians, Germans, Upper Hungarians " (Slovaks? comment by the author). See Karácson I. (Ed.) 1904 Evlia Cselebi török világutazó magyarországi utazásai (Travels of the Turkish world traveller, Evlia Chelebi in Hungary) , MTA, Budapest, 102.p. 26 Kniezsa I ibid. 29., 54.p., Csapodi Cs ibid. 21.p. 27 Acsády I Magyarország népessége a Pragmatica Sanctio korában (Population of Hungary in ), Magyar Statisztikai Közlemények XII. Budapest, 288p. 28 Petrov, A Příspěvky k historické demografii Slovenska v XVIII.-XIX. století (Contributions to the historical demography of Slovakia in 18 th - 19 th centuries), Praha, pp , Dávid Z Az évi összeírás (The census of ) - in: Kovacsics J. (Ed.) A történeti statisztika forrásai, Közgazdasági és Jogi Könyvkiadó, Budapest, pp Towns of Hungarian ethnic majority in 1720: Somorja, Komárom, Udvard, Nyitra, Érsekújvár, Léva, Rimaszombat, Rozsnyó, Kassa. 47
48 together with intense migration and mobility as regards the Hungarian-Slovak relationship - was attempted by M. Bél 30. The Slovak-Hungarian ethnic boundary had, from the second half of the 17 th century, extended to the mountain foreland. As a result of the accelerated southward migration of Slovaks deep into the flatland, in the first half of the 18 th century the border had stabilised along the line of towns with a Hungarian ethnic majority: Pozsonypüspöki-Cseklész-Szenc-Szered-Nyitra-Léva-Losonc-Rimaszombat- Sajógömör-Pelsőc-Rozsnyó-Jászó-Szepsi-Nagyida-Zemplén-Nagykapos. 31 In an unpopulated area between Érsekújvár-Nyitra-Léva, including the estate at Surány, a large Slovakian ethnic pocket had formed by the second half of the 17 th century. This came as a result of resettlement encouraged by landowners 32. Along the periphery (mainly in the environs of Verebély, Léva, Nagysalló), due to the mixture of Hungarians and Slovaks (mixed marriages, everyday communication) the local population became bilingual and with two cultural identities. War losses, the southward migration and linguistic assimilation of Hungarians to Slovaks, caused the destruction of the Hungarian "ethnic corridor" along the Hernád and Tarca valleys. Mainly due to this the earlier Hungarian ethnic block near Eperjes had shrunk by the early 18 th century to three main ethnic pockets (Eperjes-Nagysáros- Pécsújfalu Nagyszilva - Kapi; Somos - Radács; Girált Cselfalva - Magyarraszlavica- Margonya). It had disappeared virtually without any trace by the middle of the same century. After the Hungarians who were scattered in the counties of Sáros, Abaúj, Zemplén and Ung had been Slovakized, the Hungarian-Slovak ethnic border retreated to the Jászó Nagyida Abaújszina Hernádtihany Magyarbőd Szilvásújfalu Hardicsa Deregnyő Pálóc - Ungvár line. In this vicinity especially in Kassa and to the east, between Gálszécs, Tőketerebes and Sátoraljaújhely an extremely mixed, Hungarian-Slovak bilingual population with an uncertain ethnic identity had come into being, similar to the situation in the above-mentioned Érsekújvár Nyitra Verebély - Léva area. By the end of the 18 th century regions formerly underpopulated, and thus presenting economically attractive areas had reduced in number through repopulation and the mobility of the population had been curbed, thus the ethnic stability had grown. At about the time of the first population census in Hungary ( ) the ethnic pattern 30 Bel, M. Notitia Hungariae novae historico geographica. See Petrov, A ibid., Žudel, J Národnostná štruktúra obyvateľstva na južnom Slovensku v 1. polovici 18. storočia (Ethnic structure of the population in South Slovakia in the first half of 18 th century), Geografický Časopis pp Žudel, J ibid. 32 Kniezsa I ibid. pp To the Surány estate being a property of the counts Kaunitz between 1701 and 1730 a great number of peasants from Moravia were settled as well (e.g. Tótmegyer, Nagysurány, Bánkeszi, Zsitvafödémes, Özdöge, Malomszeg). Károlyi L A gróf Károlyi-család összes jószágainak birtoklási története (History of the whole properties of Count Károlyi Family), Budapest, 323 p. 48
49 in the present-day territory of Slovakia based upon contemporary sources 33 can be outlined as follows (Fig. 9.). Compared with the first half of the 18 th century the position of the Hungarian-Slovak ethnic border had not much changed, apart from the dissolution and Slovakization of the Hungarian ethnic block at Eperjes. Comparing the data of M. Bél, the Lexicon.., J.M. Korabinszky and A. Vályi it can be stated that the Slovakization of Hungarian villages 34 along the Hungarian-Slovak ethnic contact zone and the appearance of additional pockets of Slovaks 35 and Ruthenians 36 were ethnic processes worth mentioning during the 18 th century. The Ruthenians progressively penetrating from Polish and Ukrainian areas beyond the Carpathians since the 13 th century, had created a settlement area of considerable size by the 18 th century. This was primarily in the Lower Beskids, Lőcse Mountains and Pieniny under the aegis of the so-called colonisation of Vlach rights. Besides these areas, they lived in great numbers in the Eperjes (Szalánci-) Mountains and on the plains of Zemplén and Ung counties. Those living in the latter two later merged with the surrounding Slovaks and Hungarians 37 in the following centuries. Their lingual assimilation with Slovaks and Hungarians was fostered by the fact that the Ruthenians moving in were cotters and had been eager to be accepted by the Hungarian and Slovak majority, i.e. by people of a higher social status 38. According to a census conducted in 1773 the number of small villages with a Ruthenian majority dotted about in present-day Eastern Slovakia had reached By the same time (second half of the 18 th century) Ruthenians of Vlach rights who lived in Central Slovakia, e.g. in North Gömör, had turned into Slovaks; this process was accelerated by the conversion of Ruthenians to being Catholics of the Byzantine rite i.e. Greek Catholics 40 (Union of Ungvár, 1646). Their mutual (Roman Catholic) religion, and aspirations to belong to a society of a higher level also accelerated the assimilation of the Goral-Polish population of Vlach rights in northern parts of Szepes and Trencsén counties. Owing to their economic inferiority and the 33 Lexicon locorum Regni Hungariae populosorum anno 1773 officiose confectum, Magyar Békeküldöttség, Budapest, 1920, 335p., Korabinszky, J. M Atlas Regni Hungariae portatilis, Wien, 60p., Vályi A Magyar országnak leírása I - III., Buda, 702p., 736p., 688p. 34 E.g. Pozsonyivánka, Pusztafödémes, Cifer, Vágmagyarád, Nagysúr, Hódi, Vágpatta, Nyitraújlak, Assakürt, Óbars, Alsózellő, Osgyán, Kőhegy, Meleghegy, Pólyi, Szaláncújváros (Kniezsa I ibid. 29., 55.p.). 35 E.g. Deménd, Százd, Dobóca, Gömörhosszúszó, 36 E.g. Kisdobra, Bodrogmező-Polyán, Bodrogszerdahely. 37 Petrov, A Kdy vznikly ruské osady na uherské Dolní zemí a vůbec za Karpaty? (When were the Ruthenian settlements in the Great Hungarian Plain and in the Carpathians founded?), Český Časopis historický XXIX Udvari I XVIII. századi történeti-demográfiai adatok Északkelet-Magyarország görögkatolikus népességéről (Historic-demographic data about the Greek Catholics of Northeast- Hungary in the 18 th century) - in: Udvari I. (Ed.) A munkácsi görögkatolikus püspökség lelkészségeinek évi összeírása, Vasvári Pál Társaság Füzetei 3., Nyíregyháza, 8.p. 39 Petrov, A Národopisná mapa Uher podle úředního lexikonu osad z roku 1773 (Ethnic map of Hungary based on the lexicon of settlements of 1773), ČAVU, Praha, pp Podhradszky Gy A tótoklakta Felföld politikai és kultúrgeográfiája (Political and cultural geography of Upper Hungary inhabited by Slovaks), Studium, Budapest, 27.p. 49

50 50 Figure 9. Ethnic map of the present-day territory of Slovakia (late 18 th century) Sources: Korabinszky, J. M Atlas Regni Hungariae portatilis, Wien, 60p., Lexicon locorum Regni Hungariae populosorum anno 1773 officiose confectum, Magyar Békeküldöttség, Budapest, 1920, Vályi A Magyar országnak leírása I - III., Buda
51 strong pressure of the Slovakian church and of the Slovakian language they had hardly any Polish identity 41, but they were still registered as being of Polish ethnicity in the northwestern part of Árva County in As a result of a peaceful Slovak expansion dating back to the medieval period, many areas with a German ethnic majority in the early 18 th century had turned into those with a Slovak majority e.g. in towns (Bazin, Modor, Szentgyörgy and Újbánya), and in the Szepesség-Zips region (Hernád valley). In the towns of the region where rapid Slovakization was taking place between the Vág valley (Liptó County) and the Hernád- Tarca valley (Abaúj and Sáros counties), i.e. in Lőcse, Igló and Szepesváralja, the descendants of the medieval Saxon settlers became a minority by the turn of the 18 th and 19 th centuries. In the environs of Pozsony and Nagyszombat most of the Croats who settled there in the mid-16 th century had become Slovaks by the end of the 18 th century, 42 owing to a lack of ethnic replacement, a diaspora, the fact that their language was closely related to Slovakian and their common (Roman Catholic) religion. The Jewish population, following discriminative measures taken at the end of the Middle Ages and the destruction of war in the 16 th and 17 th centuries, had begun to settle in Upper Hungary starting at the end of the 17 th century. Parallel with the persecution of the Jews in Bohemia and Moravia in the first half of the 18 th century, they moved increasingly into the western counties (Pozsony, Nyitra and Trencsén), though there had been a sizeable resettlement from the territory of Polish Galicia to the eastern counties (Zemplén, Abaúj, Sáros) 43. The number of Jews in the counties of Upper Hungary according to the 1787 census had risen to 34, 086; 61,3 % of them lived in the western counties, while 34,2 % were resident in the eastern counties already mentioned. At the time of the 1787 census 44 ethnic-religious affiliation was asked only of the Jews, so that the linguistic-ethnic composition of the 1,974,483 people living in Upper Hungary is not known exactly. However, on the basis of the distribution of serfs' declarations (fassios) by language in the course of regulating the tenements held by 41 Podhradszky Gy ibid. 25.p. 42 Settlements with Croatian majority around 1796: Horvátjárfalu, Dunacsún, Dévényújfalu, Lamacs, Horvátgurab and Nahács. 43 Beluszky P A zsidó lakosság területi elterjedésének néhány jellemzője a két világháború közötti Magyarországon (Some characteristic of spatial distribution of Jews in Hungary in the interwar period) - in: Dövényi Z. (Ed.) Tér, gazdaság, társadalom, MTA Földrajztudományi Kutató Intézet, 319.p. 44 Danyi D. - Dávid Z Az első magyarországi népszámlálás (The first Hungarian census) ( ), KSH, Budapest 51
52 socage 45 between 1767 and 1771, the ratio of Hungarians in Upper Hungary is assumed to have been 22.9 % 46. The first ethnic data of the whole nation by county was published by E. Fényes in According to this survey the total population of the counties in Upper Hungary exceeded 2.4 million, with the following ethnic distribution: 59.5 % Slovaks, 22 % Hungarians, 8.3 % Ruthenians, 6.7 % Germans and 3.6 % Jews. Ethnic proportions apart from a slow homogeneization of the Slovak and Hungarian settlement area at the expense of the foreign diaspora did not show any fundamental change as compared to the end of the 18 th century with the exception of a sizeable influx of Jews from Galicia (Tab. 7. ). According to the Austrian census of in the combined area of the counties concerned the proportion of Slovaks had grown from % to % between 1840 and 1850 at the expense of Ruthenians (in Zemplén and Sáros), of Germans (in Szepes) and of Hungarians (in Abaúj, Gömör, Hont and Nyitra). In the period between the Austro-Hungarian Compromise of 1867 which signalled the political emancipation of Hungarians, and the 1880 census, no significant change occurred in the ethnic spatial pattern. In 1880 in Upper Hungary and in the present-day territory of Slovakia 49 the distribution of the 2.4 million population by native language was the following: 61.5 % (61.1 %) Slovaks, 24.5 % (22.2 %) Hungarians, 9.8 % (9.3 %) Germans and 3.3 % (3.2 %) Ruthenians (Tables 7., 8.). By this period a trend towards southward migration which had led to a spatially balanced population had virtually ended, affected by the territorial distribution of population and the means of production (chiefly of the fertile land) together with the southward retreat of the Slovakian- Hungarian language boundary. At that time the Hungarian-Slovakian ethnic border stretched along the Pozsony-Galánta-Érsekújvár-Nyitra-Léva-Losonc-Rozsnyó-Jászó- Sátoraljaújhely-Ungvár line. According to available data, the Slovakization of Greek Catholic Ruthenians had accelerated between 1840 and 1880; their number had dropped from 203 thousand to 80 thousand, i.e. from 8.3 % down to 3.3 %. People declaring themselves to be Ruthenian gradually became typical of the woodland areas in the Carpathians. Slovakian cultural expansion within the Roman Catholic church exerted pressure on the Polish Gorals who uniformly declared themselves to be Slovaks in Urbarial regulation: Regulation of the size of the tenement held by socage and of serf's services on the basis of the urbarial decree (1767) of empress Maria Theresia. See Felhő I Data gathered in the course of the Theresian urbarial regulation - in: Kovacsics J. (Ed.) A történeti statisztika forrásai, Közgazdasági és Jogi Kiadó, Budapest, pp Udvari I A Mária Terézia korabeli úrbérrendezés szlovák nyelvű kéziratos forrásai (Manuscript sources of the urbarial regulation in Slovakian in the time of empress Maria Theresia), Vasvári Pál Társaság Füzetei 15., Nyíregyháza, 16.p. 47 Fényes E Magyarország statistikája (Statistics of Hungary) I., Pest 48 Hornyánsky, V Geographisches Lexikon des Königreiches Ungarn, G. Heckenast, Pest 49 Žudel, J Národnostná štruktúra obyvateľstva Slovenska roku 1880 (Ethnic structure of the population of Slovakia in 1880), Geografický Časopis pp
53 The area of German settlement had remained basically unchanged: Pozsony and its surroundings, marginal areas of the Privigye district, Körmöcbánya and the Szepesség (Poprád valley and the southern part of the Igló district). In most of their medieval towns, they had however become a minority by In the Slovakian and Ruthenian territories of West and East Slovakia there lived a sizeable population of German native-speakers (5-24 %), most of whom consisted of Jews who had migrated from Bohemia, Moravia or Galicia, predominantly German native speakers. To summarize the ethnic processes which took place between 1796 and 1880, it could be characterized primarily by Slovak ethnic expansion, starting in the second half of the 17 th century 50. In the course of this 106 Ruthenian, 63 Hungarian, 14 German, 12 Polish (Goral) and 2 Croatian settlements had a Slovakian ethnic majority by Accordingly, the Slovaks gained 145 settlements ( ), the Ruthenians lost 100 ( ), the Hungarians 19 (+44-63), Germans 12 (+4-16), Poles 12 and Croats 2. Along the Hungarian-Slovak ethnic boundary 62 Hungarian settlements 51 changed to having a Slovak majority, 14 Slovakian villages gained a Hungarian majority (mainly in Gömör County 52 ), which resulted in a further southward expansion of the ethnic border, especially in Nyitra, Abaúj and Zemplén counties. At the same time, and as a consequence of the pressure of assimilation put on the national minorities, south of the Hungarian-Slovakian ethnic boundary 23 Slovakian and 4 Ruthenian villages became Hungarian, while north of it 106 Ruthenian, 14 German 53 and 2 Croatian settlements turned into those with a Slovakian majority. As a result of the ethnic processes outlined above, which was extremely favourable for the Slovaks, and following the Austro-Hungarian Compromise (1867), capitalist industrial development and demographic transition 54 started in Upper Hungary. People from certain regions (predominantly Slovaks and Ruthenians) in relatively overpopulated areas where agriculture could no longer support a larger population, migrated both overseas (chiefly from Zemplén, Sáros, Szepes, Abaúj-Torna counties), and to the capital Budapest (mainly from the counties of present-day Central Slovakia). 50 See Kőrösy J A Felvidék eltótosodása (Slovakization of Upper Hungary), K. Grill, Budapest, 56 p. 51 Of the mentioned 62 Slovakized Hungarian settlements 14 were found in Nyitra, 22 in Abaúj, and 17 in Zemplén and Ung counties (e.g. Sempte, Szered, Vágsellye, Mocsonok, Ürmény, Nyitra, Nagyemőke, Újlót, Szántó, Gyügy, Ebeck, Losoncapátfalu, Pány, Abaújnádasd, Abaszéplak, Kassaújfalu, Hernádtihany, Kisszalánc, Nagyazar, Magyarizsép, Magyarsas, Nagytoronya, Pálóc, Tasolya, Ungpinkóc). 52 Felsőfalu, Kisvisnyó, Lice, Mikolcsány, Gömörnánás, Kisperlász, Jolsvatapolca, Süvete. (See Keményfi R A történeti Gömör és Kis-Hont vármegye etnikai rajza (Ethnic structure of the historic Gömör and Kis-Hont County), KLTE Néprajzi Tanszék, Debrecen, 296p. 53 Towns with a German ethnic majority in the second half of the 18 th century, which turned Slovakian by 1880 e.g. Igló, Lőcse, Szepesváralja, Korompa, Selmecbánya, Bélabánya. 54 The improvement in living conditions, hygiene standards and a gradual decrease in mortality in the beginning with high birth rates resulted in a natural increase, in some places in considerable overpopulation. 53
54 Great numbers of non-hungarian citizens in the Hungarian state which was celebrating its millennium, threw their lot with the Hungarians. This was especially true of those living in towns (including Jews, Germans and Slovaks) in the atmosphere of Hungarian economic prosperity. A similar voluntary process of re-magyarization which curbed Slovakization, could be observed within the Hungarian-Slovak bilingual population of uncertain ethnic identity who were Catholic and living in the counties of Nyitra, Bars, Hont, Abaúj and Zemplén. Aside from the process of natural assimilation which took place between the censuses of 1880 and 1910 it is worth mentioning the various Magyarization measures taken by contemporary Hungarian governments to accelerate this process, which had a negative political effect. For example, the establishment and hasty development of a network of Hungarian institutions (kindergartens, primary and secondary schools, cultural and educational societies) in regions inhabited by predominantly non-hungarians and the nationalist excesses of local administration. The above outlined ethnic processes which were favourable for the Hungarians are still evaluated differently by Hungarian and Slovak experts. On the Slovakian side, 55 a dynamic increase in the number of Hungarians in the period at the turn of the century is considered to be forceful Magyarization, and the result of tampering with statistical data. Meanwhile, Hungarians 56 claim it was a voluntary process of natural assimilation 57. Slovakization in the 18 th and 19 th centuries, and statistical data of the 1880 Hungarian and of the 1921 and 1930 Czechoslovakian censuses were treated in a similar manner by Slovak experts. During the period between 1880 and 1910 which could be considered favourable for Hungarians and Ruthenians and unfavourable for the Slovaks from the ethnic point of view, the change of the number of settlements with the given ethnic majority showed the following picture: Hungarian settlements +64 (+76-12), Ruthenians Pl. Varsik, B Die slowakisch-magyarische ethnische Grenze in den letzten zwei Jahrhunderten, Universum, Bratislava, Svetoň, J Vývoj obyvateľstva na Slovensku (Change in the population number of Slovakia), Bratislava, Mazúr, E Národnostné zloženie (Ethnic structure) in: Slovensko, Ľud - I. Časť, Obzor, Bratislava, pp , Žudel, J. - Očovský, Š Die Entwicklung und der Nationalitätenstruktur in der Südslowakei, Österreichische Osthefte Jg pp , Mésároš, J Deformácie vo využívaní údajov sčítania ľudu v novodobých maďarskoslovenských sporoch (Differences in the study of census data, Historický Zborník 6 (Matica Slovenska, Martin), pp E.g. Kovács A A magyar-tót nyelvhatár változásai az utolsó két évszázadban (Change in the Hungarian-Slovakian ethnic boundary during the last two hundred years), Századok, pp , Kniezsa I A magyarság és a nemzetiségek (Hungarians and the minorities) in: Az ezeréves Magyarország, Budapest, pp , Révay, S Die im Belvedere gezogene ungarischslowakische Grenze, Veröffentlichungen der Ungarischen Statistischen Gesellschaft Nr. 14., Budapest, 57 Experts studying ethnic processes from a nationalistic viewpoint both in the past and in the present have always considered ethnicity almost exclusively as determined by ethnic affiliation, although "belonging to a certain national community is not a genetic endowment but a result of a social acculturization. The consciousness, behaviour, mentality of people are heavily influenced by the cultural norms, values, models and symbols, prevailing in the society, first of all by a politically governed cultivation of the national idea" (See. Joó R Az etnikai folyamatok és a politikai folyamatok néhány összefüggése Some connections between ethnical and political processes), Társadalomkutatás pp ). 54
55 Figure 10. Change in the population number of the main ethnic groups on the present-day territory of Slovakia ( ) (+62-17), Poles +2, Slovaks -99 ( ). In the last case, 90 villages out of 137, reversing their former Slovakization, returned to the original ethnic majority: 62 Ruthenian, 25 Hungarian, 2 Polish and 1 German. However, the Slovakization of German settlements in the Szepesség area even in this period could not be stopped, and 7 settlements which were still German in had a Slovakian majority by As a consequence of German, Jewish and Slovak assimilants declaring themselves to be Hungarians, with a higher natural increase, and relatively lower emigration, the number of Hungarians in the territory of present- day Slovakia grew by 335,000 (+61.8 %) between (Tab. 8., Fig. 10.). The increase in Hungarians was % north of the Hungarian-Slovak ethnic border, comprising areas of predominantly Slovak ethnicity, and it was +36,6 % in the Hungarian ethnic area 59. There was a particularly high number of urban dwellers of Jewish, German and Slovakian origin who declared themselves to belong to the state-forming (Hungarian) nation. Due to Hungarians moving in, and to the language change of the local German and Slovak officials, and the strengthening of the bourgeois, towns like Zólyom, Aranyosmarót, Nyitra, Nagyrőce, 58 Szepesbéla, Alsólehnic, Ómajor, Felka, Strázsa, Szepesszombat, Leibic. 59 The population increase calculated for the territory of the present-day Slovakia was 18.6 % between 1880 and
56 Table 8. Ethnic structure of the population on the present territory of Slovakia ( ) Sources: 1880, 1910: Hungarian census data (mother/native/ tongue), 1919, 1921,1930, 1947, 1950, 1961, 1970, 1980, 1991: Czechoslovakian census data (ethnicity), 1991*: Czechoslovakian census data (mother/native/ tongue), 1941: combined Hungarian and Slovakian census data. The data for the present territory of Slovakia were calculated by J. Žudel (Národnostná štruktúra obyvateľstva Slovenska roku 1880, Geografický Časopis pp.3-17.), by the Hungarian Central Statistical Office (A felvidéki települések nemzetiségi (anyanyelvi) megoszlása ( ), KSH, Budapest, 52.p.) and between 1919 and 1941 by K.Kocsis. Year Total population Slovaks Czechs Hungarians Germans Ruthenians, Ukrainians number % number % number % number % number % number % number % ,460, ,502, , , , ,916, ,687, , , , ,935, ,960, , , , , ,958, ,952, , , , , ,254, ,224, , , , , ,536, ,385, , , , , ,399, ,888, , , , , , ,442, ,982, , , , , , ,174, ,560, , , , , , ,537, ,878, , , , , , ,987, ,321, , , , , , ,274, ,519, , , , , , * 5,274, ,445, , , , , , Others
57 Jolsva, Korompa, Eperjes, Varannó, Homonna, Nagymihály suddenly attained an absolute or relative Hungarian ethnic majority (Fig. 11.). The increase in the number of persons declaring themselves to be Hungarian for the above-mentioned reasons was especially spectacular in Pozsony and Kassa (Tab. 9.). In the neighbourhood of the Hungarian-Slovakian ethnic border 54 settlements turned into those with a Hungarian ethnic majority and in 11 settlements Slovaks prevailed, i.e. in 25 cases there was some re-magyarization, 60 while in 5 cases there was re-slovakization, 61 taking into account previous ethnic data. For a better understanding of the abrupt changes in statistical data it might be useful to analyse the ratio of the bilingual population. In Upper Hungary their proportion was 18 % among Slovaks, 33 % among Hungarians and 65 % among Germans (!), living mostly in scattered language pockets. It is notable that 21 % of Germans especially those living in Pozsony and Szepes County spoke German, Hungarian and Slovakian. Among the settlements with an urban status there was a particularly high proportion of bilingual (Hungarian-Slovak) people, difficult to label by one native language, as in Jolsva, Vágsellye (approx %), Kassa, Ógyalla, Verebély (30-40 %). Within the rural areas the proportion of these people was % in the environs of Kassa, Tőketerebes, and Nyitra-Érsekújvár-Léva. At the later censuses they declared themselves to belong to the current nation forming a state, in this way causing significant statistical discrepancies. Although most inhabitants of the 62 Slovakized villages returned to being Ruthenian, owing to intense emigration (mainly overseas) the latter increased their share of the total population of Upper Hungary by a "mere" 23.8 %. At the end of World War I, following the declaration of Czechoslovakia (October 28, 1918) and the formation of the Slovakian National Committee (October 30, 1918), the Czech army supported by the Entente powers occupied almost the entire area of Upper Hungary, i.e. a territory of 61,.592 km This was to be annexed to Czechoslovakia with a population of 3.5 million, 48.1 % of whom were Slovakian native speakers, while 30.3 % were Hungarian, 12.3 % Ruthenian and 7.5 % German native speakers (1910). After excluding the option of a plebiscite which would have provided an opportunity for the local population to express their opinion about the future affiliation with a state of their choice, the Entente powers in their dictate of the Trianon Peace Treaty (June 4, 1920) insisted on the detachment of the Slovak ethnic area together with the Ruthenian, northern Hungarian settlement area and the German (Saxon) blocks of Upper Hungary with a reference to the ethnic, economic and military interests of an ar- 60 Re-Magyarization: e.g. Cseklész, Vágsellye, Nyitra, Gyügy, Szántó, Ebeck, Losoncapátfalva, Pelsőcardó, Pány, Hernádcsány, Kisszalánc, Csörgő, Garany, Magyarsas, Nagytoronya. 61 Re-Slovakizattion: Kural, Jolsvatapolca, Kisperlász, Süvete, Lasztóc. 62 The combined territory of Slovakia and Podkarpatska Rus (c. present-day Transcarpathia) as provinces of Czechoslovakia was 61,592 km 2 in 1921 and km 2 in 1930 (Československá statistika, Svazek x.p.). As a result of the border adjustments between 1922 and 1924 Susa (1922), Somoskőújfalu, Somoskő (1924) were returned from Slovakia to Hungary, Javorina (1923), Hladovka and Szuchahora (1924) were annexed from Poland to Czechoslovakia, receiving Nižná Lipnica (1924) in exchange. See: Houdek, F Vznik hraníc Slovenska (Formation of the borders of Slovakia), Prúdov, Bratislava, 412.p. 57
58 Table 9. Change in the ethnic structure of selected Year Total population Slovaks Hungarians Germans Others number % number % number % number % number % Pozsony - Bratislava , , , , , , , , , , , , , , , , , , , , , , , , , , , , , , , , , , , , , , , , , , , Kassa - Košice , , , , , , , , , , , , , , , , , , , , , , , , , , , , , , , , , , , , , Galánta - Galanta , , , , , , , , , , , , , , , , , , , , , , , , Komárom - Komárno , , , , , , , , , , , , , , , , , , , , , , , Érsekújvár - Nové Zámky , , , , , , , , , , , , , , , , , , , , , , , , , , 'Sources: 1880, 1900, 1910, 1941 : Hungarian census data (mother/native tongue) (except for Pozsony/ Remark: All data are calculated for the present administrative territory of the cities and towns.
59 cities and towns of the present-day Slovakia ( ) Year Total population Slovaks Hungarians Germans Others number % number % number % number % number % Párkány - Štúrovo , , , , , , , , , , , , , , , , , , , , Léva - Levice , , , , , , , , , , , , , , , , , , , , , , , , , , , Losonc Lučenec , , , , , , , , , , , , , , , , , , , , , , , , , , , , Rimaszombat Rimavská Sobota , , , , , , , , , , , , , , , , , , , , , , , , , Rozsnyó Rožňava , , , , , , , , , , , , , , , , , , , , , , , Bratislava City in 1940), 1921, 1930, 1961, 1970, 1980, 1991: Czechoslovakian census data /ethnicity/.

60 60 Figure 11. Ethnic map of present-day territory of Slovakia (1910) Source: Census 1910
61 tificial state formation of Czechoslovakia having twice undergone disintegration since then. From the very beginning of its existence Czechoslovak state administration similar to that of Rumania and Yugoslavia put a strong emphasis upon reducing the number of Hungarians in the annexed territories labelling them as enemies, and on the ethnic homogeneization and stabilization ("Czechoslovakization") of their towns and border zones. Between 1918 and 1924 following the change in the state authorities, 106,841 ethnic Hungarians (administrative and military personnel, landowners, etc.) were expelled or fled from Czechoslovakia to the new Hungarian state territory (from Slovakia approximately 88,000). 63 At the same time, approximately 70,000 Czech military personnel, civil servants and investors moved to the territory of Slovakia between 1918 and Some of the Hungarians who stayed in Slovakia (1921: 13,414, 1930: persons 64 ) were not granted Czechoslovakian citizenship, and in this way they were considered to be foreign citizens or displaced persons. The authrorities were especially eager to Slovakize the bilingual (Hungarian-Slovak) population with their dual identity as well as the previously Magyarized urban Slovaks, Jews and Gypsies. These two latter ethnic groups, against their own will, were classed as independent ethnic categories of Jews and Gypsies or labelled as "Czechoslovaks" at the censuses. Apart from some spectacular enforced Slovakization in education and culture, the social temptation, political pressure and statistical manipulation (e.g. the registration of military personnel not at their place of residence but at military bases) and serious abuses of authority greatly contributed to a drastic drop in the number of those recorded as Hungarians 65. Between the censuses of 1910 and 1930 the number of Hungarians dropped from 881,000 to 585,000, that is from 30.2 % to 17.6 % on the territory of present-day Slovakia (Tab. 8.). During this period 117 settlements with a formerly Hungarian ethnic majority changed to having a Slovak majority, of these 33 were in the vicinity of Nyitra- Komárom-Léva, 25 around Kassa, and 22 in the environs of Tőketerebes, i.e. in regions characterized mainly by a population with dual (Hungarian-Slovak) identity. The Hungarian ethnic area near Nyitra became an enclave. The Hungarian ethnic territory along the Ipoly river was severed between Balassagyarmat and Nagykürtös, and the Hungarian ethnic enclaves situated east of Kassa and southwest of Tőketerebes almost completely disappeared in the Czechoslovakian statistics. At the same time as part of the Czech nationalist land reform, 69 colonies 66 (with 14,000 Czech and Slovak inhabitants) were 63 Petrichevich-Horváth E Jelentés az Országos Menekültügyi Hivatal négy évi működéséről (Report about the activity of the National Office for Refugees), Budapest 64 Československá statistika, Svazek p., Sv p. 65 See: Gyönyör J Terhes örökség. A magyarság lélekszámának és sorsának alakulása Csehszlovákiában (Burdensome inheritance. Change in population number and destiny of Hungarians in Czechoslovakia), Madách-Posonium, Pozsony / Bratislava, , 58.p., Popély Gy Népfogyatkozás. A csehszlovákiai magyarság a népszámlálások tükrében (Decrease of population. Hungarians in Czechoslovakia in census data) , Írók Szakszervezet Széphalom Könyvműhely - Regio, Budapest, 112. p. 66 The most important Czechoslovakian colonies (and their Hungarian counterparts) were: Gessayov-Zálesie (Éberhard), Miloslavov, Hviezdoslavov (Csallóközcsütörtök-Béke), Bellova Ves 61
62 established in the Hungarian ethnic area between In the southern areas the majority of people living in colonies which were established to break up the homogeneous Hungarian ethnic pattern were peasants, or tenants, officials or soldiers (legionaires) who had settled there from the northern, less fertile regions of Slovakia and Moravia 67. Apart from breaking up the Hungarian rural ethnic block along the state border, which posed a danger of irredentism, another trend was the (actual or statistic) Slovakization of traditionally Hungarian towns which flanked the ethnic border. Staff in public administration were changed (Hungarians for "Czechoslovaks") by dismissing or expelling people in Hungarian Israelites were grouped into a separate category of ethnic Jews, while assimilation connected with economic considerations (statistical Slovakization) and in some cases changing of effective force of garnisons into foreign ones (e.g. those composed of Sudethan Germans) 68 together with their registration in censuses, led to a situation whereby in the towns along the Hungarian-Slovak ethnic boundary "Czechoslovaks" gained a majority 69 or equilibrium 70 was reached. There was an especially radical drop in the number of Hungarians in Kassa between 1910 and 1930 (Fig. 12.). At the same time, in the territory of Pozsony, the 23,000 Slovaks of 1910 increased to 87,000 with the Czechs by As a result of accelerated assimilation (Slovakization) the proportion of Germans and Ruthenians also decreased significantly. During this period Germans lost their majority in 10 settlements, including their traditional centres like e.g. Pozsony, Körmöcbánya, Poprád and Késmárk. Ruthenians were forced into a minority position in 44 villages owing to the dissolution of their ethnic blocks during this period. As a result of Slovakization, which accelerated during the 18 th and 19 th centuries, was curbed after 1867, but recurred as a state supported and enforced process following 1918, the number of Slovaks exceeded 2.2 million, that is, over 68 % in At the same time, with (Tonkháza), Blahová (Nagylég-Előpatony), Vrbina (Csilizradvány), Hodžovo-Lipové (Tany), Okanikovo (Nemesócsa), Štúrová (Ekel), Violin (Megyercs), Hadovce (Örsújfalu), Nový Svet (Szenc), Hurbanová Ves (Egyházfa), Štefánikov (Taksonyfalva), Hajmaš-Nové Osady (Nagyfödémes), Trnovec- Nový dvor (Tornóc), Zelený Háj (Ógyalla), Mudroňovo (Madar), Šrobárová (Marcelháza), Mikulášov Sad (Bátorkeszi), Gbelce (Köbölkút), Bíňa-Kolónia (Bény), Čata-Kolónia (Csata), Jesenské, Kulantov (Barsbese), Bozita (Perse), Romháň-Lipovany (Fülekpilis), Šiatorská Bukovinka (Ragyolc), Rátka (Csákányháza), Čierný Potok (Várgede), Bottovo (Dobóca), Slávikovo-Orávka (Rimaszécs). 67 As to the Czech colonization see: Karvaš, A. I Hospodárska štatistika Slovenska (Economic statistics of Slovakia), Bratislava, Faltuš, J. - Prcha, V Prehľad hospodárského rozvoja na Slovensku v rokoch (Overview about the economic development in Slovakia in the years ), Bratislava 68 The ratio of military personnel within the active population in 1930: e.g. Komárom 23,7 %, Léva 6,5 %, Losonc 24,8 %, Kassa 16,8 %. The ethnic division of soldiers stationed in the Hungarian border zone in 1930: Komárom 71 % Czechoslovak, 27,4 % German, Érsekújvár: 86 % Czechoslovak, 14 % German, Kassa: 66 % Czechoslovak, 26,4 % German. See: Bene L. - Kopcsányi R A magyar nyelvterület városai (Towns of the Hungarian ethnic territory in Slovakia) in: A szlovákiai magyar nyelvterület városai, Budapest Székesfőváros Irodalmi és Mûvészeti Intézete, Budapest, pp E.g. Pozsony, Nyitra, Léva, Losonc, Kassa. 70 E.g. Érsekújvár, Rimaszombat, Rozsnyó. 62

63 Figure 12. Change in the ethnic structure of population in selected cities and towns of present-day Slovakia ( ) 63
64 the appearance of Czechs especially as civil servants and soldiers, their number rose to over 120,000. The process of Czech and Slovak ethnic expansion and the rapid shrinking of national minorities, especially of Hungarians, was stopped by the political events following 1938 and the territorial revisions. Based on the first Vienna Award (Vienna, Palais Belvedere, February 02, 1938), and under German and Italian pressure, Czechoslovakia returned km 2 of land from Slovakia and Transcarpathia (Ruthenia - Podkarpatska Rus) to Hungary with its population of 1,041,401 (December 15, 1938), of whom 84.4 % declared themselves to be Hungarian native speakers, while 11.9 % were Slovaks 71. In the part of present-day Slovakia reannexed to Hungary on November 2, 1938, 857,529 people were registered at the 1941 population census. 85 % (728,904 persons) declared themselves to be Hungarian native speakers, and 13.2 % (113,619 persons) were Slovakian native speakers. Of the population of this "South-Slovakia of Belvedere" 91.4 % could speak Hungarian, 25 % Slovakian, and 16.4 % of them spoke both languages. In the returned territories there were 51 settlements which became those with a Hungarian majority but had been Slovakian in 1930, particularly in the regions of Léva-Érsekújvár, Kassa and Tőketerebes, and these were inhabited mostly by bilingual people with a dual identity (Tab. 10., Fig. 13.). The Hungarian-Slovakian state border basically ran along the ethnic boundary, and some Slovakian ethnic pockets were in the environs of Kassa, north of Sátoraljaújhely and in the area between Érsekújvár and Verebély. Within the almost homogeneous northern Hungarian ethnic area there were not only some older Slovakian ethnic pockets (e.g. Kural, Újgyalla), but Slovaks colonised some settlements in Nógrád and Gömör 72 between the two world wars. The "independent" Slovakian state declared on March 14, 1939 had a territory of 37,352.9 km Of the 2,655,053 inhabitants 86.2% were Slovaks, 5 % Germans, 2.9 % Jews, 2.4 % Ruthenians, 1.8 % Hungarians, and 1.4 % Gypsies 74. On the territory of the Republic of Slovakia the number of Czech residents dropped from 120,926 to 3, between 1930 and 1940 as a result of being expelled 71 Magyar Statisztikai Szemle szám, 456., 477.p. 72 It should be mentioned that from the territory ceded to Hungary the overwhelming majority of Czech and Slovak civil servants who resettled during Czech rule (81,000 persons) withdrew voluntarily, using Czechoslovakian support in October (Zprávy štátného plánovacieho a štatistického úradu, Bratislava, , 90.p.). Though some hundreds of Slovaks were expelled from the returned territories, but there was no collective responsibility established for the disbanding of the "common homeland of one thousand years" (Hungary) in Their Hungarian citizenship was returned and they were not deported to their home country, Slovakia. 73 Hromádka, J ibid. 102.p. 74 According to the 1940 Slovakian census, the ethnic division of Slovakian citizens (2,566,984) was the following: 2,.213,761 Slovaks, 129,689 Germans, 74,441 Jews, 61,762 Ruthenians, 46,790 Hungarians, 37,100 Gypsies, 3,024 Czechs. See: Hromádka, J ibid. 114.p. 75 The number of Czechs living in Slovakia was 161,000 in 1937, 50,000 in 1950 /Demografická Priručka 1966, Praha, 1967, 46.p./. Their number in Pozsony dropped from 20,764 down to 4,971 between December 31, 1938 and December 15, /Fogarassy L. Pozsony város nemzetiségi összetétele (Ethnic structure of Pozsony-Bratislava City) in: Alföld pp /. 64
65 Table 10. Changing ethnic majority of selected settlements in present-day South Slovakia ( ) Settlement Nyitra H H H S H S S S Nemespann H H H H H S H S Verebély H H H H H S S S Lüle H S H S S H S Ény H H H H S S H S Barsbaracska H H H H H S H S Alsópél H H S S H S H S Fajkürt H S H H S H S Kolta H H S S H S H S Szántó H H H S H S S S Kassa G H S S H S H S Pány H H H S H S H S Saca H H S S H S H S Enyicke H H S S H S H S Abaújszina G H H H H S H S Hernádzsadány H H H H H S H S Eszkáros H H H H H S H S Beszter H H H S H S H S Magyarbőd H H H H H S S S Györke H H H H H S H S Nagyszalánc H H H H H S S S Hardicsa H H H H H S S S Kazsó H H H S H S S S Garany H H H S H S H S Magyarsas H H H S H S S S Nagytoronya H H H S H S H S Csörgő H H H S H S H S Alsómihályi H H H H H S H S Biste H H H H H S H S Remark: Absolute or relative majority of the population: H = Hungarians, S = Slovaks, G = Germans by the Hlinka Guard 76 and on the orders of the minister of the interior. The period between 1939 and 1945 was disastrous for Jews living in the area of present-day Slovakia, owing to discrimination against them and their extermination in the death camps. Between 1930 and 1950 the Holocaust reduced their numbers from 135,975 to 7, The most populous Jewish communities lived (in areas under Hungarian administration) in Kassa, Losonc, Komárom, Érsekújvár, Dunaszerdahely, Galánta and Léva, in J. Tiso's Slovakia in Pozsony, Nyitra, Nagyszombat, Nagytapolcsány, Zsolna, Eperjes, Bártfa, Nagymihály and Homonna in Daxner, I Ľudáctva pred Národným súdom (Ludak Party before the National s Tribunal) , Bratislava, 73.p. 77 Deportation and liquidation of the majority of Jews took place in Slovakia in , and in Hungary after March See: Gyönyör J ibid p. 65
66 The above-outlined ethnic spatial structure of the "South-Slovakia of Belvedere" remained until the coming of the military front (October 29, April 04, 1945.). There was no massive escape of Hungarians. At the same time, 120,000 out of the 140,000 Germans in Slovakia were evacuated or fled between December 1944 and April In the areas along the southern border Germans stayed only in Pozsony 79 (approx. 9,000) and in Mecenzéf (Lower Zips-Szepesség, 1,600-1,800) until the appearance of the Soviet Army and the Czechoslovakian authorities. After the change of power in 1945, within the framework of the establishment of the Czechoslovak state, ethnic cleansing, which was carefully planned and prepared, totally deprived Germans and Hungarians of their civil rights, and removed their economic foundation. They were made scapegoats for the disintegration of the state and for the war (no citizenship was granted to them, Hungarian civil servants were dismissed, their property confiscated, etc.). This was reflected in the Czechoslovak government program worked out by Gottwald in Moscow and announced in Kassa on 5 April Declaring the expulsion of all Germans and Hungarians as their essential aim, the Czechoslovakian authorities expelled 31,780 Hungarians out of those in "South- Slovakia of Belvedere" 81. At the same time the remaining German and Hungarian residents of Pozsony were transferred to two detention camps in the vicinity of the town as a first step in the urgent Slovakization of the capital. Based on estimates using census data 82 approximately 50,000 Germans and Hungarians disappeared from Pozsony between 1944 and 1950 as a result of evacuation, internment, deportation or expulsion etc. During this time about 70,000 Slovaks moved in. Population gain was also supported by a territorial annexation in 1946 so that the number rose from 138,536 in 1940 to 160,360 in At the Potsdam Conference, on 2 August 1945, the request of the Czechoslovakian government for a unilateral resettlement of Hungarians from the country was refused (mainly thanks to the USA). As a compromise, at the behest of Czechoslovakia and with Soviet support, the Hungarian government was informed through Allied Control Commission about the possible expatriation of about 400, ,000 Germans. This was "unavoidable" in order to create space for Hungarians to be expelled from Czechoslovakia. Parallel with Czechoslovakian diplomatic efforts, within the framework of the land reform of and under the direction of the Slovakian Office of Settle- 78 Dokumentation der Vertreibung der Deutschen aus Ost-Mitteleuropa Bd. IV/1. Die Vertreibung der deutschen Bevölkerung aus der Tschechoslowakei, 1957, 171.p. 79 Dokumentation... ibid. 171,p, 80 Dokumentation... ibid. pp , Janics K A kassai kormányprogram és a magyarság "kollektív bûnössége" (Czechoslovak Government Programme of Kassa-Košice and the collective guiltiness of Hungarians), Pannónia Könyvkiadó, Bratislava, 50p. 81 Jablonický, J Slovensko na prelome (Slovakia in break-through), Bratislava, p After Fogarassy L ibid. 83 The nationalist land reform was ensured by immediately confiscating land and property formerly belonging to Hungarians and Germans by decrees 27/1945 and 104/1945 issued by the Slovakian National Council (Vadkerty K A reszlovakizáció The Re-Slovakization, Kalligram, Bratislava-Pozsony, p
67 ment a massive settlement of Slovaks started in the "southern zone of settlement" (the areas reannexed to Hungary between 1938 and 1945), with the support of the police. Some more successful Czechoslovakian diplomacy was considered to be the signing of the agreement on population transfer (based on parity) by Czechoslovakia and Hungary (February 27, 1946), under pressure from the Allied Control Commission. According to this agreement the same number of Hungarians living in Slovakia could be forcefully expatriated as those Hungarian citizens living in Hungary who, declaring themselves to be Slovak, were tempted to resettle in Czechoslovakia by various social promises. For the Hungarian government the expulsion of Hungarians living in their ancient settlement area - even in the form of population transfer - was unacceptable. This is why it strove to delay and postpone its implementation. In an anti-hungarian, chauvinist atmosphere created by a planned and sophisticated manipulation, the Czechoslovakian authorities deported 43,546 Hungarians (5,422 were only six years of age) from 393 settlements in Slovakia to Czech parts of the country 84 between October 19, and February 26, 1947, where they lived in inhuman circumstances. This enforced action, deportation was labelled by a presidential decree of 88/1945. on public work as "recruitment", "involvement in public work", "labour service" or "relocation of the population". In fact it differed from the voluntary employment of Slovaks in the Czech lands by an enforced transfer of Hungarians and an immediate expropriation of their possessions and property which were distributed among Slovak colonists. As a matter of fact, this action was eventually stopped following Hungarian, American and West-European protest and was a warning to the Hungarian government about one of the possible alternatives to the Czechoslovakian solution of the Hungarian issue: either the Hungarian state was willing to receive the Hungarians from Slovakia, or the latter would be distributed more or less evenly over Czech parts of the country. This dispersion still was under way when the Allied States signed the peace treaty with Hungary (Paris, February 10, 1947.), restoring the state borders of January 1, 1938 though they ceded a further three villages (Oroszvár, Dunacsún, Horvátjárfalu) from Hungary to Czechoslovakia. The victorious powers did not agree on a territorial solution to the ethnic tensions which left national minorities in Central Europe without the protection of their collective rights, thus preserving ethnic problems for a long time. At the same time, again on the insistence of the USA, no unilateral expulsion of Hungarians from Slovakia was allowed. Anticipating the dispersion of Hungarians in the Czech lands the government of Hungary was forced to start with the population transfer (April 12, 1947.) 85. On this day the expulsion of Hungarians from Slovakia started (from the Galánta and Léva districts) 86. Owing to disagreements around the property rights and the missing principle of parity, it was a 84 Vadkerty K A deportálások. A szlovákiai magyarok csehországi kényszerközmunkája között (The deportations. The forced labour of Hungarians of Slovakia in Czech Lands between 1945 and 1948), Kalligram, Bratislava-Pozsony, pp , Kaplan, K Csehszlovákia igazi arca (The true face of Czechoslovakia) , Kalligram, Bratislava- Pozsony, p ibid Čas,
68 slow process which lasted from April 12, 1947 to June 12, 1948 and from December 20, 1948 to September 01, With this population transfer 68,407 Hungarians were forced to leave Slovakia for Hungary and about 6,000 "of their own free will". 73,273 people from Hungary declaring themselves to be Slovak, although usually without any such identity and hardly speaking the language 88, but simply eager to expropriate property that had formerly belonged to Hungarians, were resettled in South Slovakia, as this territory was called 89. Apart from the Slovaks of Hungary and colonists from the inner mountain regions, the Czechoslovakian government had managed (with economic promises) to persuade several thousand Slovaks to repatriate from Rumania, Bulgaria, from the Soviet Union (primarily from Transcarpathia) and Yugoslavia 90. According to our investigations, in the borderland districts 236,000 Slovaks moved between 1945 and 1950, who had previously lived in the country or abroad 91. Within the Hungarian ethnic area the centre of Slovak colonisation (and at the same time of the expulsion of Hungarians) were towns situated along the language border (Kassa, Rozsnyó, Rimaszombat, Losonc, Léva, Érsekújvár, Vágsellye, Galánta, Szenc), the main transport zones (main roads and railways) and the most fertile rural regions (e.g. along the Pozsony-Galánta- Érsekújvár-Komárom-Párkány axis, in Garam region, and in the area between Losonc and Rimaszombat, Szepsi and Nagyida). The ethnic composition and statistics of the population of South Slovakia were heavily influenced not only by the migrations already mentioned, but by another form of ethnic expansion, so-called re-slovakization 92. More than half of the Hungarians frightened and deprived of their rights (381,995 up to January ), especially those living in towns, in ethnically-mixed villages or who were scattered, applied to call themselves Slovaks. This meant being granted citizenship and staying in their homeland. Only 282,594 of these applications were accepted by the Commission on Reslovakization 93, obviously due to a lack of command of the language and due to "racial deficiencies". Of these, owing to the slow consolidation of the political situation, 60,000 Hungarians turned back to their original national status by 1950 and a further 80,000 by 87 Szabó K. - É.Szőke I Adalékok a magyar-csehszlovák lakosságcsere történetéhez (Contributions to the history of the Hungarian-Czechoslovak population exchange) in: Valóság p Obzory, Zvara, J A magyar nemzetiségi kérdés megoldása Szlovákiában (The solution of the Hungarian ethnic question in Slovakia), Politikai Kiadó, Bratislava, p Of these only the number of repatriants from Rumania was sizeable (estimated at c. 16,000) ,000 of the 236,000 resettled Slovaks colonised the southern territories disannexed from Hungary. 80,000 moved to Pozsony and Pozsonyligetfalu, 14,000 of them settled down in villages formerly predominantly inhabited by Germans. 92 In decree 20000/I-IV/ of the Office of Home Affairs ( ) it was made possible for Hungarians rejecting their original ethnicity to officially declare themselves Slovaks, so getting rid of the inhuman anti-hungarian discrimination /Vadkerty K A reszlovakizáció, Kalligram, Bratislava-Pozsony/ 93 ibid. p
69 1961, while the re-slovakization of 140,000 of them (predominantly town-dwellers) became permanent. Following these events, the ethnic composition of the "South Slovakia of Belvedere" (the so-called "resettlement area") underwent a profound change between the censuses of 1941 and The number of Hungarian native speakers (729,000 in 1941) is estimated to have fallen to 451, by 1950 (from 85 % in 1941 to 52,6 % in 1950). This was as a result of the deportation and emigration of Jews (38,000), the expulsion of Hungarians in 1945 (31,000), the resettlement of 74,000 people to Hungary, a decline following deportations to the Czech lands (20,000), and the loss through re- Slovakization. Together with the Hungarians who suddenly "turned into Slovaks" and 142,000 colonists, the number of Slovaks rose here to 370,000, that is from 13.3 % to 43.2 % ( ). The organizers of ethnic cleansing managed to target towns located along the ethnic boundary with a Hungarian majority until 1945 turning them into settlements of Slovak majority 95. There was a dramatic southward movement of the Hungarian-Slovak ethnic boundary in rural areas in the vicinity of Léva, Kassa and Tőketerebes, where the greatest Hungarian ethnic loss could be observed (Fig. 14.). To sum up: the Czechoslovakian state, in spite of the anti-hungarian measures taken and deportations implemented between 1945 and 1948, did not manage to achieve its primary goal, the elimination of the majority of Hungarians in the south of the state. The previously uniform Hungarian character of the border region was, however, broken by Slovak colonization making it more or less mixed ethnically. The intimidation and humiliation of the Hungarian population and the nationalistic and social measures involving the resettlement of nearly 150,000 Slovaks among the Hungarians, further aggravated and conserved internal political and inter-state tensions for a long period, thus hindering the normalization of the Hungarian-Slovak coexistence. As the shocking events of the 1940 s faded, an increasing number of formerly scared and "re-slovakized" Hungarians reassumed their Hungarian ethnicity in the census statistics. In 1970, there was already a record of 552,006 people claiming Hungarian ethnicity and 600,249 declaring Hungarian as their mother tongue. At best, the latter figure corresponds to the number recorded 80 years ago and falls far behind the 761,434 people whose native language was Hungarian in In the past decade, the mobility of the Hungarians was increasingly determined by living conditions and the growing disparity between labour supply and demand. The contrast between the urban centre and its periphery became more marked, increasing the mobility of the increasingly open Hungarian rural society along the border. This was primarily manifested in the resettlement of young Hungarians to towns along the lan- 94 In our survey, ethnic data of the Czechoslovak census of 1950 similar to that of the 1949 Hungarian census has not been taken into account, due to the distortions stemming from the intimidation of national minorities. In 1950 a mere 354,.532 people declared themselves to be Hungarian in the whole of Slovakia. With a slow dissolution of this fear, 518,782 persons did so in The ethnic composition of certain towns had undergone a profound change between 1941 and 1950 due to a drastic drop in the share of the Hungarians: Kassa (from 83,5 % down to 3,9), Rozsnyó (92,7 %-34 %), Rimaszombat (92,7 %-43 %), Losonc (84,5 %-16,4 %), Léva (89,4 %-17,8 %), Érsekújvár (91,3 %-31 %), Komárom (96,1 %-54 %), Galánta (87,5 %-l 4,5 %). 69
70 guage border which have a majority Slovak population, mostly in Pozsony and Kassa. As a result, the percentage of Hungarians in settlements where Hungarians comprised a minority between 1970 and 1991 increased from 17% to 22.4 %, while the percentage of Hungarians living in a predominant majority (75 % < ) decreased from 63% to 52 %. Natural assimilation, due to intermarriage between ethnic groups in territories with a Slovak majority (in 1982, 27.1% of Hungarian men and 24.7% of Hungarian women chose Slovak partners) was made even more probable by a large amount of migration. For decades, even centuries there has been significant territorial disparity in emigration and birth control. The average age of the Hungarian population is quite high in the territories between Párkány Zseliz Ipolyság, in the region near Ajnácskő and Pelsőc, and along the Bodrog-Latorca rivers. On the other hand, the Hungarians of Csallóköz and in part those in Pozsony and the Galánta district demonstrate the most favourable demographic indicators. Their birthrate of 6 per mille in 1983 by far exceeded not only that of the neighbouring Hungarian counties of Győr-Moson-Sopron and Komárom ( per mille), but also that of the demographically most fertile Hungarian county, Szabolcs-Szatmár-Bereg County (2 per mille). Alongside a relatively modest increase and then a stagnation in the number of Hungarians, came an increasingly identity-conscious Gypsy population and the establishment of an independent Roma category at the 1991 census. Due to a high natural increase in the population of those qualifying as Gypsies, their number has risen dynamically for the past one hundred years (1893: 36,000, 1947: 84,438, 1966: 165,000, 1989: 253,943, 1996: c. 300,000) 96. According to a survey conducted during the 1980 census 78.7 % of Gypsies declared themselves to be Slovak (slovačike roma), while 20 % of them considered themselves to be Hungarian (ungarike roma) 97. In the 1991 census they were not described but ethnicity could be declared. 75,802 people, 28 % of the Gypsy population, declared themselves to be of Roma ethnicity, and represented the ethnic majority in 9 settlements. Gypsies live predominantly east of the Poprád-Losonc line, especially on the territory of the historical counties of Gömör, Szepes, Sáros és Abaúj, while their largest community is in Kassa City. Within the Hungarian ethnic area they live in Gömör 98 (Rimaszombat, Tornalja, Pelsőc, Rozsnyó, Krasznahorkaváralja and environs) and in Nógrád (Losonc, Fülek and environs), but sizeable communities are also to be found in western Hungarian settlement areas (e.g. Dunaszerdahely, Jóka, Komárom, Ógyalla and Sáró) and in eastern ones (e.g. Nagyida, Deregnyő, Királyhelmec and Tiszacsernyő). 96 Jurová, A Cigányok-romák Szlovákiában 1945 után (Gipsies-Romanies in Slovakia after 1945), Regio pp Gyönyör J Államalkotó nemzetiségek (State-forming nations), Madách, Bratislava, 141.p. 98 On certain Hungarian villages in Gömör becoming Gypsy in character and changing ethnic behaviour of the Gypsies see: Keményfi R ibid. 296p. 70
71 THE PRESENT TERRITORY OF HUNGARIAN SETTLEMENT IN SLOVAKIA At the time of the 1991 Slovakian census, of the 5.3 million population of the country, the ratio of the members of state-forming ethnic groups were 85.7 % (Slovaks), and 1 % (Czechs). In 1910 there was a 10.4 % combined number of Germans, Ruthenians 99 and Poles (Gorals), though it dropped to 0.7 % by 1991, owing to natural assimilation and expulsion. Though the number of Hungarians (567,.296) had risen considerably compared with 1961 (518,782), their proportion, owing to a dynamic growth of Slovaks, had fallen to 10.7 %. The number of native Hungarian speakers at the 1991 population census was (11.5 %). From the administrative perspective, 67.7 % of ethnic Hungarians in Slovakia live in the western regions (Kraj of Pozsony, Nagyszombat and Nyitra) (Tab. 11.). Dunaszerdahely (87.2%) and Komárom (74.2%) can be considered the most Hungarian of all the districts. In the districts 100 of Vágsellye, Galánta, Érsekújvár and Rimaszombat Hungarians are balanced by the Slovaks, % (Tab. 12.). Of the Hungarians in Slovakia a considerable number (at least 100 persons) and percentage (at least 10 %) inhabit 550 settlements. They comprise an absolute majority (50 % <) in 432 settlements and almost exclusive majority (90%<) in 164 settlements. Due to their geographic and historical preferences, Hungarians mostly inhabit large and medium-sized villages (1,000 5,000 inhabitants), but 16.7 % of them also live in small towns with 10,000-30,000 inhabitants. Table 11. The new administrative regions (kraj) of Slovakia and the Hungarian minority region (kraj) total population ethnic Hungarians number (1991) per cent (1991) Pozsony-Bratislava 608, ,871 30, Nagyszombat-Trnava 562, , , Nyitra-Nitra 708, , , Trencsén-Trenčín 604, ,990 1, Zsolna-Žilina 670, , Besztercebánya-Banská Bystrica 661, ,072 85, Kassa-Košice 748, ,849 96, Eperjes-Prešov 746, , Sources: 1991 = Oriskó N Coexistence-Spolužitie-Együttélés Political Movement, Bratislava, 1994 = Administratívna mapa Slovenskej Republiky (1:400,000), Vojenský kartografický ústav, š.p., Harmanec, As a result of the ethnic expansion of Slovaks and pressure to assimilate, the number of Ruthenians decreased from 203,000 to 30,000 between 1840 and 1991 and their proportion of the population of Greek Catholics fell from 94.7 % to 14,3 %. The eventual disappearance of Ruthenians in Slovakia (similar to that of the Polish Gorals) has also been reflected by the diminishing number of villages with a Ruthenian ethnic majority from 300 to 29 on the territory of present-day Slovakia between 1773 and Data refers to the territory of districts after
72 Table 12. Selected new districts (okres) of Slovakia and the Hungarian minority district (okres) total population ethnic Hungarians 1991 number (1991) per cent (1991) Szenc-Senec 49,868 11, Dunaszerdahely-Dunajská Streda 109,345 95, Galánta-Galanta 92,645 38, Vágsellye-Šaľa 54,159 21, Érsekújvár-Nové Zámky 153,466 63, Komárom-Komárno 109,279 78, Léva-Levice 120,703 38, Nagykürtös-Veľký Krtiš 46,813 14, Losonc-Lučenec 72,946 22, Rimaszombat-Rimavská Sobota 82,112 36, Nagyrőce-Revúca 41,765 10, Rozsnyó-Rožňava 59,059 21, Kassa-Košice-okolie (environs) 99,292 16, Tőketerebes-Trebišov 100,520 33, Nagymihály-Michalovce 104,003 13, Source: Our calculation based on the publication: Národnost a náboženské vyznanie obyvateľstva SR (definitivne výsledky ščítania ľudu, domov a bytov 1991), Štatistický Úrad SR, Bratislava, 1993 According to the ethnic data of the 1991 Czechoslovak census, the largest Hungarian communities are concentrated in Komárom, Pozsony, Dunaszerdahely, Érsekújvár, Kassa, Rimaszombat, Párkány, Gúta, Somorja and Nagymegyer (Tab. 13.). Our estimates for 1980 differ to a certain extent: Pozsony (43,000), Kassa (35,000), Komárom (22,900), Érsekújvár (17,000), Dunaszerdahely (15,500), Léva (12,800). According to the official 1991 census data, the percentage of ethnic Hungarians exceeds that of the Slovaks only in 13 towns. Of these, the most Hungarian are Nagymegyer, Dunaszerdahely, Gúta and Királyhelmec (Tab. 14.). The inhabitants of the capital (Pozsony - Bratislava) and the Szenc district are the western-most representatives of Hungarians in Slovakia (Figs.14., 15.). The most important settlements of the Hungarians of this region (Szenc, Magyarbél, Fél, Éberhárd), belong to the Pozsony - Bratislava agglomeration. Due to the favourable geographical location of these settlements, the immigration of Slovaks continues to increase, causing the decrease in the population percentage of Hungarians. In the Dunaszerdahely district with its strong Hungarian character, significant numbers of Slovaks inhabit only the towns of Dunaszerdahely, Somorja and Nagymegyer. The most important villages in the district all predominantly Hungarian include Nagymagyar, Illésháza, Nagylég, Bős, Várkony, Ekecs, Nyárasd, Vásárút and Diósförgepatony. The centre of the Galánta district, with 41-52% Hungarian inhabitants, is located at an important railway junction. A majority of the Hungarians living in the Galánta and Vágsellye districts work at the Duslo chemical works in Vágsellye and the machine-tool and food industry in Galánta and Diószeg. Most of the Hungarian villages in this region (called "Mátyusföld" - Land of Matthew of Csák, th cent.) 72
73 Table 13. The largest Hungarian communities in Slovakia (1991) Settlements Population 1. Komárom / Komárno 23, Pozsony / Bratislava 20, Dunaszerdahely / Dunajská Streda 19, Érsekújvár / Nové Zámky 13, Kassa / Košice 10, Rimaszombat / Rimavská Sobota 9, Párkány / Štúrovo 9, Gúta / Kolárovo 9, Somorja / Šamorín 8, Nagymegyer / Veľký Meder 8, Fülek / Fiľakovo 7, Galánta / Galanta 6, Királyhelmec / Kráľovský Chlmec 6, Nagykapos / Veľké Kapušany 6, Rozsnyó / Rožňava 5, Ipolyság / Šahy 5, Tornalja / Tornaľa 5, Vágsellye / Šaľá 5, Léva / Levice 5,165 Source: Final data of the Czechoslovakian census of 1991 (ethnicity). are located between the Little Danube and the Pozsony Érsekújvár railway line, such as Jóka, Nagyfödémes, Felsőszeli and Alsószeli. In the Komárom district, the other area in Slovakia with a Hungarian majority, most Hungarians live in the towns of Komárom, Gúta and Ógyalla. Other centres in the network of settlements in this district are Naszvad, Marcelháza, Perbete, Bátorkeszi, Nemesócsa and Csallóközaranyos. The Komárom shipyard and the Ógyalla brewery are the two main industrial employers of the region. Table 14. Towns in Slovakia with absolute Hungarian majority (1991) Settlements Percentage of the Hungarians 1. Nagymegyer / Veľký Meder Dunaszerdahely / Dunajská Streda Gúta / Kolárovo Királyhelmec / Kráľovský Chlmec Párkány / Štúrovo Somorja / Šamorín Tornalja / Tornaľa Fülek / Fiľakovo Ipolyság / Šahy Nagykapos / Veľké Kapušany Komárom / Komárno Ógyalla / Hurbanovo Zseliz / Želiezovce 53.5 Source: Final data of the Czechoslovakian census of 1991 (ethnicity). 73
74 74 Figure 15. Ethnic map of Slovakia (1991)
75 The majority of the Hungarian population of the Érsekújvár district, which lies between the Vág and the Danube Rivers and extends along the Pozsony-Budapest international railway line, live in the proximity of the famous cellulose and paper-producing town of Párkány. Most Hungarians living in the vicinity of the half-slovak and half- Hungarian Érsekújvár, an important railway junction and the centre of the electrotechnical refrigerating machine industry, inhabit Tardoskedd, Udvard, Szimő and Zsitvabesenyő. Nyitranagykér, located in the northern part of the Érsekújvár district, together with Nagycétény and Nyitracsehi close to the territory of the Nyitra district, form an important Hungarian enclave. The percentage of Hungarians in the population of Hungarian villages on the southern slopes of the Tribecs mountain range in Nyitragerencsér, Alsócsitár, Barslédec, Ghymes, Zsére, Kolon, Pográny, Alsóbodok is gradually decreasing because of development in the vicinity of Nyitra, Slovak immigration, and linguistic assimilation. The Hungarian language border in the Léva district, enlarged since the incorporation of the Ipolyság and Zseliz districts, was driven back in the direction of the Ipoly as a consequence of evacuations preceding battles along the Garam river in 1945 and the ruthless post-war deportation of local Hungarians. In the district seat of Léva, known mostly for its textile industry, the percentage of Hungarians is 15.2% according to 1991 Czechoslovak census data. (In 1941 it was 87.2 %). In the immediate proximity of Léva, Hungarians inhabit only a few small villages (Zsemlér, Alsószecse, Felsőszecse, Várad, Vámosladány etc.). The Calvinist Hungarian population of Mohi was resettled elsewhere in the early 1980s due to the new nuclear power-plant (Mochovce) being constructed there. In the strongly mixed ethnic surroundings of Zseliz, the greatest number of Hungarians live in Nagyölved, Farnad, Nagysalló and Oroszka the location of one of Slovakia s most important sugar factories. In the environs of Ipolyság, most Hungarians inhabit Palást and Ipolyvisk. The shrinking and disconnected ethnic Hungarian territory on the right bank of the Ipoly river is part of the Nagykürtös district. In addition to the largest Hungarian community of Ipolynyék, we must also mention Lukanénye, Csáb, Ipolybalog, Bussó and Ipolyhídvég. In the Losonc district, the northern part of the former Nógrád county, the most important Hungarian communities live mainly in the villages of Ragyolc, Gömörsid, Fülekpüspöki, Béna, Sőreg, Csákányháza etc. in an ethnic territory also containing Slovakian colonies. This is in the vicinity of the towns of Losonc and Fülek, known for its enamelled pots and furniture. In Southern and Central Gömör, the districts of Rimaszombat and Nagyrőce were enlarged with the addition of the formerly almost entirely Hungarian, and later dismembered districts of Feled and Tornalja. The most important Hungarian settlements here are Rimaszombat, Tornalja towns and Rimaszécs, Feled, Ajnácskő, Várgede, Vámosbalog, Sajógömör. Upstream along the Sajó, in the district of Rozsnyó we reach the northernmost area of the Carpathian Basin s ethnic Hungarian territory (at Krasznahorkaváralja). In the Sajó valley settlements of the Hungarian-inhabited borderland, especially in 75
76 Rozsnyó and Pelsőc, the percentage of Hungarians is diminishing due to a large immigration of Slovaks. In contrast, the percentage of Hungarians is increasing in the villages of the Gömör-Torna (Slovak) Karst of peripheral location (Szilice, Szádalmás, Hárskút, Várhosszúrét etc). In the vicinity of Kassa City, Hungarian communities can be found only in the territory of the former Szepsi district, not more than kilometres from the Hungarian border (Torna, Szepsi, Szádudvarnok, Tornaújfalu, Debrőd, Jászó, Buzita, Jánok etc.). The Hungarians in this region who work in industry, make their living in the plants of Kassa the East-Slovakian metropolis with over 235,000 inhabitants and at the centre of the historical Abaúj-Torna county, and in Szepsi and Nagyida, as well as at the cement works of Torna. The scattered Hungarian (partly Calvinist) population east of Kassa (between Magyarbőd and Eszkáros) declared themselves to be Slovaks at the time of the postwar censuses. After crossing the Szalánci mountains (the northern, Slovakian side of the Tokaj-Eperjes Mountains), we reach the districts of Tőketerebes and Nagymihály, which include the former ethnic Hungarian districts of Nagykapos and Királyhelmec. The Hungarians in this area live in a relatively compact ethnic block, between the Ung- Bodrog rivers and the Ukrainian and Hungarian border. The unity of the almost thousand-year-old Hungarian ethnic area is disrupted only by the newly-settled Slovak population in the modest industrial centres of Nagykapos (34.5%), Királyhelmec (16.3%), Bodrogszerdahely (32.3%), Vaján (15.4%) the location of one of Slovakia s largest thermal power plants, and Tiszacsernyő (30.8%) the very important international railway border crossing. Most of the Hungarian rural population in parts of the historical counties of Zemplén and Ung (which are located in Slovakia) live in Lelesz, Bodrogszerdahely, Szomotor, Kisgéres, Nagytárkány, Battyán and Bély. 76
77 Chapter 3 THE HUNGARIANS OF TRANSCARPATHIA Transcarpathia 1 is the name given to the present West-Ukrainian region in the North-east of the Carpathian Basin, bordered by Slovakia, Hungary and Rumania. The administrative name of Subcarpathia - Transcarpathia, refers to an area of 12,800 square kilometres, which gradually became commonly known after the Peace Treaty of Trianon (1920). On this territory belonging to the Ukraine, the 1989 census recorded 155,711 inhabitants of Hungarian ethnicity and 166,700 Hungarian native speakers. According to our calculations this number differs from the probable number of Hungarian speakers of 220, The Hungarians of this region far fewer in number than the Hungarians of Transylvania and Slovakia represent 6.1% of Hungarian national minorities inhabiting the Carpathian Basin. THE NATURAL ENVIRONMENT Ninety-one percent of Transcarpathian Hungarians live on the north-eastern periphery of the Great Hungarian Plain (Alföld), the official name of which is the Transcarpathian Lowland. Apart from the peat of the drained Szernye marsh and the alluvial soil along the rivers, the plain is covered by meadow soil. Several young volcanic cones and elevations can be found near Beregszász, Mezőkaszony, Salánk and Nagyszőlős (Fig.16. ). The overwhelmingly Hungarian-populated plain, characterised mainly by brown forest soil and beech groves and interspersed here and there with oak woods, plays a decisive part in the food supply of Transcarpathia. It is flanked by meter high volcanic mountains called Pojána-Szinyák, Borló-Gyil, the Nagyszőlős and Avas mountain ranges. The rest of the region s Hungarian population (9 %) lives in the highlands not far from the Tisza River between Huszt and Körösmező. 1 Transcarpathia (Ukr. Zakarpatye, Hung. Kárpátalja) or Transcarpathian Region of Ukraine between the 9th century and 1918 formed continously a part of Hungary, on the territory of Ung, Bereg, Ugocsa and Máramaros counties. Following the World War I., according to the Treaty of Trianon (June 4, 1920) this northeast Hungarian, historic region was annexed to the new created Czechoslovakia under the name: Subcarpathian Rus' (Podkarpatská Rus) or Ruthenia (Rusinsko). Transcarpathia returned to Hungary between 1938/39 and 1944 as Subcarpathia (Kárpátalja). Following the Soviet supremacy ( ) this area became an administrative region (called "Zakarpatska oblast") of the independent Ukraine. 2 Including the Greek Catholics and Gipsies of Hungarian native tongue. 77
78 78 Figure 16. Important Hungarian geographical names in Transcarpathia
79 The most important river in the territory is the Tisza, made up of two branches, the Black Tisza and the White Tisza originating in the Máramaros Mountains and flowing 223 kilometres on Ukrainian territory. The still relatively rapid Tisza breaks through the volcanic mountain range at the Huszt-Gate and then slows down and builds up an alluvial deposit in the Ugocsa region. Its most important tributaries in the Máramaros region are the Tarac, Talabor and Nagyág. ETHNIC PROCESSES DURING THE PAST FIVE HUNDRED YEARS According to the taxation census of 1495, carried out on the territory of Ung, Bereg, Ugocsa and Máramaros counties (almost constituting present-day Transcarpathia), 75,685 people 3 are assumed to have lived in 21 towns and 592 villages 4, out of which 19 towns and 347 villages may have had a Hungarian ethnic majority 5. If we postulate that in this area there was almost a tenfold difference between the population in towns and in villages 6, 69 % of the population were Hungarians, 16.8 % of them were Ruthenians, 8.4 % Slovaks and 7.5 % Rumanians (Tab. 15.). The proportion of Hungarians reached 65 % in Ung County, 81 % in Bereg County and 92 % in Ugocsa. Hungarians represented a relative majority (37.6 %) in Máramaros as opposed to Rumanians (32.6 %) and Ruthenians (29.8 %). By the end of the 15 th century, on the present-day territory of Transcarpathia, the area of ethnic Hungarian settlement extended up to the foothills of the mountains along the former defence strip (Hung. "gyepű") which was abandoned in the 13 th century (Fig. 17.). This Hungarian ethnic boundary linked Ungvár-Szered-Munkács-Beregszentmiklós-Nagyszőlős between the Ung and Tisza rivers. The Hungarian ethnic area was also extensive in the eastern part of Ugocsa and in Máramaros (almost uninhabited until the flourishing of salt mining), thus the Tisza section of the defence zone included the most important Hungarian settlements: the towns of Huszt, Visk, Técső and (now a part of Rumania) Hosszúmező and Máramarossziget. Most of the descendants of German and Flemish miners, artisans and viniculturists settled during the 13 th and 14 th centuries and assimilated with the Hungarians by the end of the 15 th century 7. A sizeable population with German names could be found only in Visk, Szászfalu and Beregszász. 3 Kubinyi A. ibid. pp Csánki D. ibid. pp , The Drugeth - Estate (1437) SSUArchive of the Convent of Lelesz Df (after Engel P. ) 5 The assumed distribution of the villages by ethnic majority could be the following: Hungarian 347, Ruthenian 137, Slovak 47, Rumanian Szabó I Ugocsa megye, MTA, Budapest, Bélay V Máramaros megye társadalma és nemzetiségei (Society and Ethnic Groups of Máramaros County), Település és Népiségtörténeti értekezések 7., Budapest. 7 Szabó I ibid. 24., 25.p., Bélay V ibid. 27.p. 79
80 Remarks: Historical Northeast Hungary = Territory of Ung, Bereg, Ugocsa and Máramaros Counties (1914). 1720: Ruthenians with Slovaks. Sources: 1495: Estimation of Kocsis K. based on Csánki D Magyarország történelmi földrajza a Hunyadiak korában, MTA Budapest and Kubinyi A A Magyar Királyság népessége a 15. század végén Történelmi Szemle XXXVIII pp , 1720: Acsády I Magyarország népessége a Pragmatica Sanctio korában Magyar Statisztikai Közlemények XII. /Új folyam/, Budapest 1787: Danyi D. - Dávid Z Az első magyarországi népszámlálás ( ), KSH, Budapest 1840: Fényes E Magyarország statistikája I., Pest 1850: Hornyánsky, V Geographisches Lexikon des Königreiches Ungarn, G. Heckenast, Pest 1857: Fényes Elek 1867 A Magyar Birodalom nemzetiségei és ezek száma vármegyék és járások szerint, Pest 1869: Keleti K Hazánk és népe a közgazdaság és a társadalmi statistika szempontjából, Athenaeum, Pest 1880: A Magyar Korona országaiban az év elején végrehajtott népszámlálás...országos Magyar Királyi Statisztikai Hivatal, Budapest : Jekelfalussy József (szerk.) 1892 A Magyar Korona országainak helységnévtára, Országos M. Kir. Statisztikai Hivatal, Budapest, 1900: A Magyar Korona országainak évi népszámlálása 1. rész A népesség általános leírása községenkint, Magyar Statisztikai Közlemények I., 1910: A Magyar Szent Korona országainak évi népszámlálása 1. rész Magyar Statisztikai Közlemények 42. Table 15. Ethnic structure of the population of historical Northeast Hungary ( ) Year Total population Hungarians Ruthenians Slovaks Germans Rumanians Jews Others number % number % number % number % number % number % number % number % , , , , , , , , , , , , , , , , , , , , , , , , , , , , , , , , , , , , , , , , , , , , , , , , , , , , , , , , , , , , , , ,
81 Figure 17. Ethnic map of the present-day territory of Transcarpathia (late 15 th century) Source: Bélay V Máramaros megye társadalma és nemzetiségei, Budapest, Csánki D Magyarország történelmi földrajza a Hunyadiak korában, Budapest, Szabó I Ugocsa megye, Budapest 81
82 Nearly 13,000 Ruthenians, who cannot be regarded as autochtonous 8 in Transcarpathia, formed the majority population in 137 villages at the end of the 15 th century. The overwhelming number of these villages were to be found in the neighbourhood of the Hungarian ethnic area, i.e. on the southwestern slopes of the mountains and in the upper, mountainous reaches of the rivers Ung, Latorca, Borzsava, Nagyág, Talabor and Tarac. This was an uninhabited borderland area until the 13 th century, when Ruthenians pursuing a pastoral way of life, began to penetrate this zone from Galicia, Volhynia and Podolia, led by their "magistrates" (Hung. kenézes) 9. They gradually populated higher areas in the borderland zone. At the end of the 15 th century, however, most of the mountainous regions of Máramaros, Bereg and Ung counties were still uninhabited woodland and alpine pastures. Although the area in question had never fallen under Ottoman (Turkish) rule, being situated between the Transylvanian Principality (which symbolized Hungarian independence) and the rest of Hungary under Habsburg administration 10, it was often destroyed, being an area of military operations during the 16 th and 17 th centuries. Of these disasters the gravest were those caused by the Tartar invasions of 1565, 1594, 1661 and 1717, the Polish incursion of 1657, the campaign of the imperial Habsburg troops between 1684 and 1688 (the siege to the Munkács fortress) and the ravages of the Transylvanian and Habsburg armies crossing the region. These wars and the epidemics accompanying them struck almost exclusively at the Hungarian ethnic territory, i.e. the surroundings of the castles, fortresses and towns, the zones along transport routes and the valley of the Tisza River. As a result, there was a decline in the predominantly Hungarian population which dropped from 102 thousand to 73 thousand between 1598 and In Ugocsa County located at the opening to the Tisza Valley (still with a 95 % Hungarian population in the mid-16 th century 12 ), most seriously hit by warfare, the number of the portas 13 paying tax was 1,775 in 1565/74, 829 in 1638, and 491 in 8 Sobolevskij 1894 Kak davno Russkie živut v Karpatah i za Karpatami (How long Russians live in the Carpathians and beyond), Živaja Starina, pp , Petrov, A Materiali k istorii Ugorskoj Rusi (Materials to the history of Ruthenia in Hungary) VI., St.Petersburg, p Kenéz ("Cnesius", contactor, magistrate): organizers of settlements, who instigated a massive move of Ruthenian serfs from the areas east of the Carpathians (then part of the Kingdom of Poland) to the previously uninhabited areas of royal estates, on behalf of the new landlords. See Bonkalo, A Die ungarländischen Ruthenen, Ungarische Jahrbücher, Bd. I., Berlin - Leipzig, 226.p. 10 In the 16th and 17th centuries Máramaros County was part of Transylvania, while Ung County belonged to the territory of Hungary under Habsburg rule. Bereg and Ugocsa counties were most frequently occupied by the troops of the Habsburg Empire, but between and they were part of the Transylvanian Principality. 11 Bakács I A török hódoltság korának népessége (The Population of Hungary during the Ottoman Period) in: Kovacsics J. (Ed.) Magyarország történeti demográfiája (Historic Demography of Hungary), Budapest, 129.p., Bélay V ibid. 112.p. 12 Of those figuring in the 1567/74 tithe register of Ugocsa 1371 persons held Hungarian surnames, 61 Slavic, 24 German, 5 Rumanian, 6 Turkish family names and 308 names were ethnically ambiguous (Szabó I ibid. 74.p.) 13 Porta: royal tax-unit which in these years corresponded to a whole serf's tenement. 82
83 Parallel to the decline in the Hungarian population there was massive immigration and resettlement of the Ruthenians 15 from beyond the Carpathians, from the Regions of Galicia which then belonged to then to the Kingdom of Poland. They settled in predominantly mountainous areas in the counties of Máramaros, Bereg and Ung which had remained unaffected by the wars. In the 17 th century Ruthenians appeared not only in wooded mountainous areas but in ever -increasing numbers in the devastated villages on the fringes of the Hungarian settlement area, and even in some towns (Ungvár, Munkács, Huszt 16 ). Following the failure of the war of independence ( ) led by Prince F. Rákóczi II, the census of 1715 found 6,402 taxpayers (heads of households) on the present territory of Transcarpathia, 41.4 % of whom had Hungarian, and 52.8 % Slavic (Ruthenian) names 17. At this time, the Hungarian ethnic border stretched northwest and northeast of Munkács, and along the foothills of the Polyána and Borló mountains. The area inhabited by Hungarians included the western third of the present Ilosva district, the whole of Ugocsa County and the Tisza valley up to Técső. The most populous communities of Transcarpathia and the Hungarian ethnic area in 1715 were Beregszász and Visk. However, Hungarian serfs from these areas of mountain foreland (primarily from the Tisza valley and the vicinity of Nagyszőlős and Munkács) who had survived the ravages of war, began to move in increasing numbers to the central regions of the Great Plain. This area had extremely rich soil, and had become depopulated during the Ottoman-Turkish rule and the wars of liberation (e.g , ). At the same time, in the villages of Ugocsa 18, West Máramaros and Central Bereg counties which were abandoned by the Hungarians, Ruthenians moved down from the mountain areas and started to appear while colonisation was also organised by landlords. The immigration of Ruthenians from Galicia and Bukovina to the uninhabited area of Máramaros began to accelerate as salt mining and timber felling in the Upper Tisza region developed (e.g. Rahó, Tiszabogdány and Körösmező). A new Ruthenian ethnographic group had also emerged here between the 17 th and 19 th centuries: the Hutzuls 19. By the mid-18 th century, as a result of large-scale migration, the Hungarian- Ruthenian ethnic boundary had retreated an average of km to the Great Plain. Villages of Ugocsa located at the Tisza gate (where the river enters the plain from the Ruthenian Máramaros) became Hungarian-Ruthenian in ethnic composition. Nevertheless, the more important settlements of the Transcarpathian region (Ungvár, Munkács, 14 Szabó I ibid. 74., 92.p. 15 The Ruthenians were mostly settled by the Hungarian noble families of Bilkei, Dolhai, Lipcsei, Homonnay, Rákóczi (See Bélay V ibid. 91.p.). 16 In 1614 there were 105 Hungarian households and 16 Ruthenian recorded in Huszt (Bélay V ibid. 111.p.). 17 Acsády I ibid. pp , , The ethnic distribution of the taxpayers of Ung, Bereg, Ugocsa and Máramaros counties (8,651 households) was the following: 49.7 % Slavs (Ruthenians and Slovaks), 38 % Hungarians, 1.6 % Rumanians (1715). 18 Szabó I ibid. pp Bonkalo, A ibid. 226.p. 83
84 Beregszász, Nagyszőlős, Huszt, Visk and Técső) still preserved a majority Hungarian population in (Fig.18.). In the 18 th century Ruthenians moved into the uninhabited or destroyed Hungarian areas, and also German colonists: peasants, vine growers and artisans. After the unsuccessful War of Independence ( ) led by Hungarian Prince F. Rákóczi II, some of his vast estates were granted to L.F. Schönborn (archbishop of Mainz, Germany), who encouraged the massive immigration of Germans from the vicinity of Bamberg and Würzburg. As a result of this colonisation several German villages appeared in the environs of Munkács (e.g. Felsőschönborn, Munkácsújfalu, Pósaháza, Németkucsova and Leányfalva) between 1732 and In the 1770s and 1780s the Imperial Treasury (Vienna) initiated the resettlement of Austrian lumbermen from Salzkammergut to Máramaros, who founded the settlements of Királymező and Németmokra. As far as the rate of Hungarians and Ruthenians is concerned, the ethnic structure thus brought about had not changed significantly by the 1880 population census (the only exception now that the Huszts became overwhelmingly Ruthenian). During this period the ethnic-religious structure of the present territory of Transcarpathia was primarily modified by the ever growing influx of Jews (persons of Israelite religious affiliation and of mostly Yiddish native tongue) from the Russian Empire 21 and Galicia 22. The proportion of the Israelite population was 4.5 % in 1840 and increased to 13 % by In the changed situation following the Austro-Hungarian Compromise (1867), the assimilation of Jews in the Hungarian forming state accelerated. As a consequence, 25.7 % of the total population (i.e. 105 thousand people) declared themselves to be native Hungarian speakers and this number increased to 30.8 % (184 thousand) by 1910 (Tab.16.). Such a considerable growth of Hungarians was due to the 30 thousand Jews who declared themselves to be Hungarian native speakers, and to the prevalence of Hungarian sympathy among Greek Catholics with ambiguous ethnic identity, i.e. a bilingual population (speaking both Ruthenian and Hungarian) living mainly in Ugocsa (e.g. Nagyszőlős, Királyháza, Tekeháza, Szőlősvégardó, Mátyfalva, Karácsfalva and Batár) as well as town dwellers of the region (Fig.19.).In the two biggest towns of contemporary Transcarpathia (Ungvár and Munkács) with a % Jewish population, the share of those declaring themselves to be Hungarian was close to 74 % in Ungvár and 60 % in Munkács, while in the present-day urban settlements of Beregszász, Nagyszőlős, Csap 20 Lexicon locorum Regni Hungariae populosorum anno 1773 officiose confectum, Magyar Békeküldöttség, Budapest, The majority of the Russian Jews arrived from the heartland of the Ashkenazic Jews, called "Pale of Settlement" (e.g Russian provinces Volhynia, Podolia, Minsk, Kiev). The migration of Jews was motivated by economic and politic reasons (e.g. anti-semitic pogroms). See Magocsi, P.R Historical Atlas of East Central Europe, University of Washington Press, Seattle - London, 107.p. 22 Between 1772 and 1918 a province of the Habsburg (Austrian) Empire or Austro- Hungarian Monarchy, which was between the 14th and 18th centuries the southern part of the Polish Kingdom around Lwów-Lviv-Lemberg,. In the medieval Poland was called Halicz Rus or Red Ruthenia. 23 The number of the Jews of Ung, Bereg, Ugocsa and Máramaros counties increased from 1,887 persons (1787) to 40,695 by 1850 and to 78,424 by
85 Figure 18. Ethnic map of the present-day territory of Transcarpathia (late 18 th century) Sources: Korabinszky, J. M Atlas Regni Hungariae portatilis, Wien, 60p., Lexicon locorum Regni Hungariae populosorum anno 1773 officiose confectum, Magyar Békeküldöttség, Budapest, 1920, Vályi A Magyar országnak leírása I - III., Buda 85
86 Sources: 1880, 1910, 1941: Hungarian census data (mother/native tongue), 1921, 1930: Czechoslovakian census data (ethnicity), 1959, 1979, 1989: Soviet census data (ethnicity), 1979*, 1989*: Soviet census data (mother/native tongue). Remarks: The data between 1880 and 1941 for the present territory of Transcarpathia were calculated by K.Kocsis. Slovaks include the Czechs in 1921, Table 16. Ethnic structure of the population on the present territory of Transcarpathia ( ) Ruthenians, Total population Year Ukrainians Russians Hungarians Germans Ethnic Jews Rumanians Slovaks Gipsies Others number % number % number % number % number % number % number % number % number % number % , , , , , , , , , , , , , , , , , , , , , , , , , , , , , , , , , , , , , , , , , , , , , , ,056, , , , , , , , , ,155, , , , , , , , , , * 1,155, , , , , , , , , ,245, , , , , , , , , , * 1,245, , , , , , , , ,
87 and Técső it exceeded 75 % (Tab.17.). For these reasons the proportion of Hungarians within the urban population had reached 68.7 % by The Trianon Peace Treaty at the close of World War I (1920) annexed the territory of present-day Transcarpathia to the Republic of Czechoslovakia (together with the Hungarian ethnic area along the Csap-Beregszász-Királyháza-Nevetlenfalu-Halmi railway line, which provided transport links between Czechoslovakia and Rumania, and in the lowlands where it provided cereals for the mountain regions). Owing to this separation and the fact that the Hungarians became an oppressed national minority, the number of those registered as Hungarians fell from 184 thousand (1910) to 111 thousand (1921) and then to 115 thousand (1930). The reasons for this considerable drop (apart from approx. 18,600 Hungarians who escaped between 1918 and ) was the fact that the Czechoslovakian authorities did not allow those who had voluntarily become Magyarized, Jews and Greek Catholics, to declare themselves to be Hungarian. They were instead registered as Jews (sometimes "Czechoslovaks") and Ruthenians. At the same time during the 1930 census 15,839 (2.2 %), predominantly Hungarian persons (who had not been granted Czechoslovakian citizenship) were recorded as "foreigners" so they did not figure in the ethnic statistics. Owing to this, 11-21% of people in several Hungarian villages (e.g. Csonkapapi, Mezőkaszony, Tiszacsoma, Nevetlenfalu and Akli) did not have Czechoslovakian citizenship (!), while this figure did not reach 1 % in Ruthenian villages. Naturally, the fall in the number of Hungarians can be attributed to their identification with the polyglot, mainly urban population mentioned above and people of the Ugocsa region of uncertain ethnic identity, with their descendants the Ruthenians, and (to a lesser extent) with the "Czechoslovaks". As a result the official proportion of ethnic Hungarians dropped between 1910 and 1930 in the territory of Transcarpathia from 30.8 % to 15.9 % (the corresponding change was % for Ungvár, % for Munkács and % for Beregszász). Over the same period the number of settlements with a Hungarian majority population, according to present-day administrative divisions, diminished from 128 to 89. The shrinking Hungarian ethnic area lost the towns along the ethnic border (Ungvár, Munkács and Nagyszőlős), and by 1930 only Visk and Aknaszlatina retained their Hungarian majority. A uniform ethnic Hungarian belt of km width along the border posed an irredentist danger, so Czechoslovakian land reform made an attempt to break it by means of Czech, Slovak and Ruthenian colonisation - mainly along the Csap-Királyháza railway which was strategically important, and where new colonies of settlements were founded in the neighbourhood of Hungarian villages (Tiszasalamon, Eszeny, Bátyú, Bótrágy, Beregsom, etc.). The most prominent group of settlements established for Czech colonists consisted of Nagybakos (Sloboda), Kisbakos (Slobodka) and Újbátyú (Dvorce), established on the former administrative areas of Nagylónya and Kislónya, which had remained in Hungary after annexation. 24 Petrichevich-Horváth E Jelentés az Országos Menekültügyi Hivatal négy évi működéséről (Report about the activity of the National Office for Refugees), Budapest 87
88 The statistical decline of Hungarians in Transcarpathia was halted by the reannexation of the ethnic Hungarian area (together with the towns of Ungvár and 88
89 Table 17. Change in the ethnic structure of selected Year Total population Ruth., Ukrain. Hungarians Germans Others number % number % number % number % number % Ungvár Užhorod , , , , , , , , , , , , , , , , , , , , , , , , , , , , , , , , , , * 116, , , , Munkács Mukačeve , , , , , , , , , , , , , , , , , , , , , , , , , , , , , , , , , , , * 83, , , , Beregszász Berehove , , , , , , , , , , , , , , , , , , , , , , , , * 29, , , , Csap Čop , , , , , , , , , , , , , , , , , , , , , * 9, , , , Tiszaújlak - Vilok , , , , , , , , , , , , , , , , , , * 3, , 'Sources: 1880, 1900, 1910, 1941: Hungarian census data (mother/native tongue), 1921, 1930: Czechoslovakian census data /ethnicity/, 1979, 1989: Soviet census data /ethnicity/.
90 settlements of present day Transcarpathia ( ) Year Total population Ruth., Ukrain. Hungarians Germans Others number % number % number % number % number % Nagyszõlõs - Vinohradiv , , , , , , , , , , , , , , , , , , , , , , , , , , , , , * 25, , , , Visk - Viškove , , , , , , , , , , , , , , , , , , , , , , , , , , * 7, , , Huszt - Hust , , , , , , , , , , , , , , , , , , , , , , , , , , , , , , * 30, , , , Técső - Ťačiv , , , , , , , , , , , , , , , , , , , , , , * 10, , , Aknaszlatina - Solotvina , , , , , , , , , , , , , , , , , , , , , , , , , , , * 9, , , , Remark: All data are calculated for the present administrative territory of settlements of present-day Transcarpathia ( ).
91 Figure 19. Ethnic map of the present-day territory of Transcarpathia (1910) Source: Census
92 Munkács) 25 following the first Vienna Accord (November 2, 1938), and the occupation of the rest of the region by Hungary, following the disintegration of Czechoslovakia and the proclamation of an independent Slovakia (March 15-18, 1939). At the 1941 census after the change of regime and with Hungarians in Transcarpathia becoming a stateforming nation again, from a total population of 851, % (i.e. 233 thousand persons) declared themselves to be native Hungarian speakers 26. This doubling of the number and proportion of Hungarians can be attributed to the immigration of civil servants and military personnel from the "Trianon territory" of Hungary, and also to 34 % of Jews and 9 % of Greek Catholics identifying with Hungarians along with the majority of the Hungarian-Ruthenian population who were of uncertain ethnic affiliation. For the above reasons and due to the moving out of Czech colonists and civil servants, 103 settlements had regained their Hungarian majority by Of the towns "sensitive" to the change in power the proportion of Hungarian native speakers "suddenly" increased and was as follows: Ungvár: 76.6 %, Munkács: 63.5 %, Beregszász: 91.4 %, Nagyszőlős: 58.7 % and Técső: 56.9 %. As a consequence of the immigration of civil servants and military personnel and the presence of local Jews, a considerable number (20-40 %) of the population in the centres of the Ruthenian ethnic area (Szolyva, Perecseny, Nagyberezna, Huszt, Rahó and Kőrösmező) declared Hungarian to be their native language. This favourable ethnic-demographic situation for the Hungarians lasted till the occupation of the country by the German Nazi army (March 19, 1944). To meet German demands, the Hungarian internal affairs administration soon started to organize the gathering of the Jewish population - in 1941 in Subcarpathia 115,908 persons of Jewish religious affiliation were deported to Germany. This meant a serious (16 %) loss for the population of native Hungarian speakers, since 37 thousand Jews were Hungarian - language speakers with a Hungarian identity. The most severe ethnic loss and demographic decline were suffered (based on 1941 census data) in Tiszaújlak (25.5 %), Beregszász (24.8 %), Munkács (20.6 5), Ungvár (20.2 %), Nagyszőlős (18.6), Mezőkaszony (17.2 %) and Csap (9.9 %). At the same time this created the conditions for the settlement of Russians and Ukrainians following the passage of the front. Following the Soviet occupation of the territory of Transcarpathia in October 1944 Hungarian and German males liable to military service (aged between 18 and 50 years) were gathered in a concentration camp (Szolyva) and then deported to forced labour camps in the Ukraine and Russia. By December 17, ,990 Hungarians were deported, but according to a survey carried out on those liable to military service 25 Rónai A Új felvidéki határunk (Our new border in Upper Hungary), Földrajzi Közlemények LXVII. (1939). 3. pp The Ruthenians were represented by 501,516 (58.9 %), the Yiddish-Hebrew native speakers by 78,655 (9.2 %), the Rumanians by 15,568 (1.8 %) and the Germans by 13,224 (1.6 %) persons
93 between July 1-7, 1945 about 30 thousand men were in unknown locations 27. This source estimates that 4,953 Hungarians died in the forced labour camps. In parallel with the vengeance taken upon Hungarians who were regarded as enemies, Transcarpathia became a part of the Soviet Union in accordance with an agreement between Czechoslovakia and the Soviet Union of June 29, Prior to the change of power, along with the retreating Hungarian and German troops, a massive escape of Hungarians began into the territory of Trianon Hungary. According to the documents prepared for the Paris peace talks (1946) the number of these refugees amounted to 5,104. Russians and Ukranians almost immediately occupied those places previously inhabited by the deported Jews and the Hungarians and Germans who had escaped or been deported, especially the strategically important towns of Ungvár and Munkács. Within the framework of land reform Ruthenians moved from the mountains to settlements among the villages of the Hungarian ethnic block between The first Soviet census after World War II (1959) found that 146,247 people, 15.9 % out of the total Transcarpathian population of 920,000, were ethnic Hungarians 28. The reason for a drop of nearly 100 thousand compared with 1941 (besides the above mentioned causes) was that the Hungarian Greek Catholics were regarded by the authorities as ethnic Ukrainians and of Orthodox religious affiliation 29. Meanwhile, some Hungarians (about 10 thousand), intimidated by the wave of vengeance, declared themselves to be Slovaks 30 and "became" Ukrainians in the Hungarian- Ruthenian population of ambiguous ethnic roots. It should be mentioned, that among Hungarians there was some natural assimilation, especially in urban settlements due to ethnically mixed marriages and the feelings of remorse and an inferiority complex 31 which were created by the authorities. The Soviet authorities laid stress on liquidation of the Greek Catholic Church and on wasting of the Reformed (Calvinist) and Roman Catholic Churches which were the main supporters of local Hungarian ethnic identity. At the same time, owing to income disparity and ethnic discrimination regarding employment, there was massive emigration of skilled Hungarians from the relatively back- 27 Dupka Gy Egyetlen bűnük magyarságuk volt. Emlékkönyv a sztálinizmus kárpátaljai áldozatairól (Their only crime was to be Hungarian. White book on the victims of the Stalinism in Transcarpathia, ), Patent - Intermix, Ungvár - Budapest, 286., 288.p. 28 The number of Ukrainians were 686,464 (74.6 %), Russians 29,599 (3.2 %) and Jews 12,169 (1.3 %) in The Greek Catholic (Uniate) Church of Transcarpathia was supressed in 1949 and its (Ruthenian, Hungarian, Rumanian) congregations were forced into the Orthodox Church. See: Botlik J Hármas kereszt alatt. Görög katolikusok Kárpátalján az ungvári uniótól napjainkig (Under triple cross. Greek Catholics in Subcarpathia from the Union of Ungvár /Užhorod till today, ), Hatodik Síp Alapítvány - Új mandátum Könyvkiadó, Budapest, 335p. 30 Since October 1944 thousands of terrified Hungarians (first of all Hungarians who could also speak Slovakian in Ungvár-Užhorod and in its environment) declared themselves to be ethnic Slovaks. 31 Following 1944 the Soviet propaganda in Transcarpathia laid stress on the formation of an image of the "small, defeated" Hungarian nation in contrast with the image of the big, victorious Russian, Ukrainian nations. 93
94 ward border zone to Lviv (Lemberg), Kiev and the industrial Donets Basin. The number of Hungarians leaving Transcarpathia and settling within the borders of the Ukraine rose from 2,982 to 7,400 between 1959 and 1989, while the number of those scattered in the USSR outside the Ukraine increased from 5,509 to 8,309. Besides the natural assimilation already mentioned, and the internal Ukrainian-Soviet migration, accelerating emigration to Hungary, which had begun during the Soviet period, also contributed to a reduced growth rate in the number of Hungarians (1959: 146,247; 1989: ) in spite of an 11.8 annual average birthrate ( a total of 51,800) 32. THE PRESENT TERRITORY OF HUNGARIAN SETTLEMENT IN TRANSCARPATHIA According to the last Soviet census (1989), the number those declaring themselves to be native Hungarian speakers exceeded the number of ethnic Hungarians by 10,989, reaching 166, 700. This is due to the fact that, for various reasons, out of the Hungarian native speakers 7,973 persons declared themselves to be Gypsies (66 % of all Transcarpathian Gypsies) and 1,890 people as ethnic Slovaks. At present, among the 598 settlements of Transcarpathia, there are officially only 78 with an ethnic Hungarian majority (in 1941 there were 103). This is due to the fact that both Greek Catholic, and many Roman Catholic Hungarian villages (e.g. Rafajnaújfalu, Nagybégány, Kisbégány and Kétgút) were registered as settlements with a Ukrainian majority in These Hungarian settlements can be found mostly in the Hungarian-Ukrainian border zone of 20 km width (the only exception is Visk between the Avas Mountains and the Tisza river) (Fig. 20.). This ethnic block, where 61.3 % of the Hungarian population were living in 1989, primarily included the districts of Beregszász, Ungvár and Munkács (36.6 %, 16.4 % and 8.3 %, respectively). A further 28.1 % of Hungarians were urban-dwellers in an ethnically very mixed area along the ethnic border (Ungvár, Munkács, Nagyszőlős) and lived in the historical region of Ugocsa, while 10.6 % were scattered in mountain areas. As a consequence of socialist urbanisation which took place in the past few decades there was a massive influx of Ruthenians, Ukrainians and Russians into Ungvár and Munkács, which have doubled their populations, while the proportion of Hungarians has dropped to % (ethnicity) and % (native tongue). Among towns and "urban type settlements" 33 this was the period when Nagyszőlős, Técső and Aknaszlatina lost their Hungarian majority. As a re- 32 See the data on the natural increase of the ethnic Hungarian district Beregszász-Berehove: Szabó L Kárpátaljai demográfiai adatok (Demographic data of Subcarpathia), Intermix Kiadó, Ungvár-Budapest, pp "Settlement of urban type" (Ukr. "selishch miskogo tipu", "smt.") is a special type of settlement in the post-soviet republics and represents a transition between the towns and villages. In Transcarpathia can be found 8 urban, 562 rural settlements and 28 "smt". 94
95 Figure 20. Ethnic map of Transcarpathia (1989) Source: Census
96 sult of this massive internal migration between villages and towns, which affected several hundred thousand Ruthenians and Ukrainians, the number of Hungarians in present-day towns dropped from 55.2 % (1941) to 11.6 % (1989), while that of Ruthenians and Ukrainians rose from 23.2 % to 74 %. The local Hungarian population is more "rural" (62.3 % of them live in villages), than the Ukrainians (61.6 %), the Russians (12.8 %), or the Gypsies (37.8 %). Accordingly, those registered as Hungarians live in settlements with 1,000-2,000 inhabitants (24 %) and 2,000-5,000 (23 %). The corresponding figures inside Hungary (1990) were 9 % in the former category and 13.7 % in the latter. At the same time, only one quarter of Hungarians lived in settlements with more than 10 thousand inhabitants and 5.6 % in towns over 100 thousand. This adherence of the Hungarians to the rural environment, as reflected in the statistics, might be partly attributed to their restricted migration into towns, or partly to a gradual assimilation of the people having moved there. As a result, in % of Hungarians lived in settlements where they formed an absolute majority. To maintain their ethnic awareness this may be positive, similar to the situation of Hungarians in Slovakia, where 46.8 % of them live in settlements where they constitute over 75 % of the population and only 16.1 % of them live in places where the Hungarian population makes up less than 25 %. As a consequence of history and the process of urbanisation, during the past decades the most populous ethnic Hungarian communities have become the towns of Beregszász (15,125), Ungvár (9,179) and Munkács (6,713) and the largest, "most Hungarian" village of Nagydobrony (5,250) 34 (Tab.18., Fig.21.). In the Ungvár district, where a majority of the Hungarians live in the town of Ungvár the capital of the Transcarpathian Region the ethnic border has not changed much in the last few centuries. The Hungarian area of settlement continues to be located south of the Ungvár-Korláthelmec line. Nevertheless, in the town of Csap, along the Csap-Ungvár railway line, and in the villages of the Ungvár agglomeration, the percentage of the Hungarian population is falling rapidly due to increasing Ukrainian immigration. The largest Hungarian rural communities live in Nagydobrony, Eszeny, Kisdobrony, Tiszasalamon, Rát and Szürte. One third of the Hungarians of the Beregszász district the district with the longest border with Hungary live in the district seat of Beregszász. The ethnic Hungarian unity of the district is disrupted only by some older (Kovászó, Nyárasgorond, Csikósgorond) and more recently founded (Badiv, Danilivka, Kaštanove, Zatišne, Velika-Bakta) Ruthenian enclaves. In addition to Beregszász, the largest number of Hungarians live in Vári situated on the right bank of the Tisza, in a former district seat of Mezőkaszony, next to the drained Szernye marsh in Gát, Makkosjánosi, Nagybereg, and Beregújfalu, in Nagymuzsaly and Beregdéda situated next to Beregszász and at the railway junction of Bátyú. More than half of the Hungarians living in the neighbouring Munkács district, are residents of Munkács. The others live in the vicinity of Beregszász district s Hungarian villages (Dercen, Fornos, Izsnyéte, Csongor, Szernye, Barkaszó etc.). One single 34 According to the native tongue the number of Hungarians were in Beregszász 16,310, in Ungvár 11,784, in Munkács 9,280 in
97 Table 18. The largest Hungarian communities in Transcarpathia (1989) Settlements Estimated data Census data 1. Beregszász / Berehove 23,000 15, Ungvár / Užhorod 16,000 9, Munkács / Mukačeve 15,000 6, Nagyszőlős / Vinohradiv 7,600 3, Nagydobrony / Velika Dobroň 5, Visk / Viškove 4,000 3, Aknaszlatina / Solotvina 3,800 2, Csap / Čop 3,750 3, Tiszaújlak / Vilok 3,200 2, Técső / Ťačiv 3,000 2, Vári / Vary 2, Gát / Hat' 2, Dercen / Drisina 2, Salánk / Šalanki 2, Mezőkaszony / Kosini 2, Bátyú / Batove 2,350 1, Makkosjánosi / Ivanivka 2, Nagybereg / Berehi 2, Csongor / Čomanin 2, Huszt / Hust 2,029 1, Barkaszó / Barkasove 2, Nagymuzsaly / Mužijeve 2,000 Source: Soviet census data 1989, Botlik J. - Dupka Gy. 1993, estimations by K.Kocsis. village west of Munkács called Beregrákos in Ruthenian surroundings has been defying assimilation for centuries. For hundreds of years, it has been the guardian of the medieval Hungarian ethnic border. In the Nagyszőlős district, in historical Ugocsa county where the Tisza River meets the plain, Hungarians have lived mostly mixed with the Ruthenian population for three centuries. Due to the century-old coexistence and, in many cases, the shared Greek Catholic or Uniate religion, the most significant deviation in the ethnic census statistics can be observed in the villages of this region. Today, most Hungarians can be found in the towns of Nagyszőlős, Tiszaújlak, Salánk, Nagypalád, Tiszapéterfalva, Csepe and Feketeardó. Proceeding upstream along the Tisza, we reach the district of Huszt, situated in the former county of Máramaros. Here the majority of Hungarian town dwellers, dating back to the Middle Ages, are represented by the Hungarians of Visk. The Hungarian minority population of 2,092 in Huszt is also important. A Hungarian community of 3,000 persons inhabits the seat of the neighbouring district, Técső. The famous salt-mining settlement of Aknaszlatina is located on the right bank of the Tisza, facing the town of Máramarossziget in Rumania. Its population includes approximately 3,800 Hungarians. A considerable Hungarian population lives in Bustyaháza, Kerekhegy, Taracköz and Királymező as well. 97
98 98 Figure 21. Hungarian communities in Transcarpathia (1989) Source: Census 1989, Botlik, J. Dupka, Gy. (1993), estimation of Kocsis K.
99 In the Rahó district, called the Ruthenian (or Hutzul) Switzerland, which is situated among the Carpathians near the sources of the Tisza, there are about 4000 to 5000 people of Hungarian ethnicity. The majority of them live in Rahó, Körösmező, Nagybocskó and Gyertyánliget. 99
100 Chapter 4 THE HUNGARIANS OF TRANSYLVANIA The greatest number of Hungarians living outside the present-day borders of Hungary are to be found in Transylvania west of the Carpathians in Rumania. Here many ethnic groups of Central and South-eastern Europe (Hungarians, Rumanians, Gypsies, Germans, Ukrainians, Slovaks, Serbs, Czechs, Bulgarians etc.) also live in significant numbers. At the time of the last Rumanian census in 1992, the registered number of Hungarians in Rumania was 1,624,959 /ethnicity/ or 1,639,135 /mother tongue/. According to our estimates, however, the number of those people who claim Hungarian to be their native language was 2 million in The latter data indicates that close to 60 percent of Hungarians living outside the borders of Hungary in the Carpathian Basin and 13.3 percent of Hungarians in the world, are in Transylvania. THE NATURAL ENVIRONMENT According to our calculations, 51% of Hungarians in Transylvania live in hilly or submountainous areas, 28% inhabit lowlands and 21% live in the mountains. The lowlanders living adjacent to the Hungarian border dwell in the eastern part of the Great Hungarian Plain, called the Western or Tisza Plain in Rumania. The highlanders primarily include the inhabitants of the Székely Region, the Barcaság Basin, Hunyad, and Máramaros counties (Fig. 22.). A majority of the Hungarian highlanders live in the Eastern Carpathians and the basins encircled by the mountain chains. The most important mountain ranges of the Carpathians also inhabited by Hungarians include the following: The sandstone range comprising the Nemere Mts. (Mt. Nemere 1649 m, Mt. Nagy Sándor 1640 m), the Háromszék Mts. (Mt. Lakóca 1777 m), the Brassó Mts. (Mt. Nagykő 1843 m, Mt. Csukás 1954 m), the Persány Mts. (Mt. Várhegy 1104 m), the Barót Mts. (Mt. Görgő 1017 m), the Bodok Mts. (Mt. Kömöge 1241 m), and the Csík Mts. (Mt. Tarhavas 1664 m, Mt. Sajhavasa 1553 m); also the limestone peaks of the Székely Region (Nagy-Hagymás 1792 m, Egyeskő 1608 m, Öcsémtető 1707 m, Nagy- Cohárd 1506 m, etc.), the mainly crystalline schist belt of the Máramaros, Radna, and Gyergyó Mts. (Mt. Siposkő 1567 m), the inner volcanic ring of the Avas, Kőhát, Gutin (famous for its non-ferrous metal mining), Lápos, and Cibles Mts., Kelemen Mts. and Görgény Mts. (Fancsaltető 1684 m, Mezőhavas 1776 m), and the Hargita (Madarasi- Hargita 1800 m, Mt. Kakukk 1558 m, Nagy-Csomád 1301 m). The most important basins inhabited also by Hungarians include the Máramaros, Gyergyó, Csík, Kászon, Háromszék and Barcaság basins. 99
101 Figure 22. Important Hungarian geographical names in Transylvania The most noteworthy rivers of the Eastern Carpathians as far as Hungarians are concerned include the Tisza, Maros, Olt, Békás, Tatros, Feketeügy and Vargyas. Important lakes e.g. the Gyilkos-tó ("Lake Killer"), Szent Anna-tó ("Lake St. Ann's"), and Medve-tó ("Lake Bear") in Szováta can also be found in this region. Outside the Eastern Carpathians, a considerable number of Hungarian highlanders inhabit the Torockó Mts. (Székelykő - Székelystone 1128 m, Torda and Túr Gorges), the northern base of the Bél Mts., the Belényes Basin and the Petrozsény Basin which is bordered by the Retyezát Mts., Vulkán Mts. and Páreng Mts. A majority of Hungarians occupying the lowlands live on the Western Tisza Plain which is covered mostly with chernozem, meadow and alluvial soils. The richest agricultural land in Transylvania can be found in the Bánát region and the County of Arad. The most important subregions of the Western Plain are the Szatmár, Érmellék, Körösmenti, Arad and Temes lowlands. The most important rivers of the region as far as Hungarian settlements are concerned include, from north to south, the Szamos, Kraszna, Ér, Berettyó, Sebes - Rapid-Körös, Fekete - Black-Körös, Fehér - White-Körös, Maros, Béga and the Temes. 100
102 Outside the region of historical Transylvania, west of the limestone range, the Hungarian national minority inhabit the hilly regions and live mainly in the Szilágy hills whose streams include the tributaries of the Berettyó and Kraszna rivers. A majority, however, live in settlements located in the hills along the Szamos River between the Gyalu Mts. and the Gutin Mts., the chernozem covered southwestern part of the Mezőség (Plain of Transylvania), the hills along the Küküllő rivers, and the sub-mountainous slopes of the Székely Region. The following larger rivers (and their tributaries) extend throughout the hilly regions: Szamos (Little and Big Szamos, Almás, Kapus, Nádas, Borsa, Füzes, Sajó), Maros (Kapus, Ludas, Aranyos, Nyárád, Görgény, Little Küküllő, Big Küküllő), and Olt (Big Homoród, Little Homoród, Hortobágy). The hilly regions of the Transylvanian Basin, shaped by mud flows and landslides and characterised by a mostly marly clay surface, are extremely rich in natural gas (Medgyes, Kiskapus, Nagysármás, Mezőzáh, Nyárádszereda, etc.), and salt deposits (Parajd, Marosújvár). ETHNIC PROCESSES DURING THE PAST FIVE HUNDRED YEARS During the 1495 assessment of taxes of the 2.9 million population of the Hungarian Kingdom, 454,000 people may have lived in the Transylvanian Voivodeship and 830,000 people in present-day Transylvania 1. Of these, 101,000 lived in the autonomous Saxon Regions and 76,000 in the Székely Region. Of the population of the contemporary Transylvanian Voivodeship the number of Rumanians and Germans (Saxons) might be estimated at 100,000 each (22-22%) while Hungarians and Szeklers have already been reduced to about a quarter of million, i.e. 55% (Tab. 19.). Among the 5,321 present-day settlements ethnic majorities were distributed as follows: 1869 Hungarian, 1785 Rumanian, 359 German (Saxon), 167 Slavic, while 1,141 present-day settlements were uninhabited. Hungarians constituted the majority population in almost every town of the Banat, Körös-vidék and Máramaros regions, and in half of the major towns with more than 1000 inhabitants (e.g. in Kolozsvár, Gyulafehérvár, Torda, Dés). The largest towns, among wnich was Brassó the most populous one of Hungary, were still predominantly occupied by Saxons. Yet urban social structure was characterised at that time by a growing ethnic diversity, due to the migration from the villages to the towns which were epidemic ridden, and to the movement of Rumanians and Serbs into the southern areas which have been devastated by the plundering Ottoman (Turkish) army 2. The previous ethnic homogeneity of the Hungarian and Saxon villages in the 1 Kubinyi A. A Magyar Királyság népessége a 15. század végén (Population of the Kingdom of Hungary at the end of 15th century) Történelmi Szemle XXXVIII p Binder P Közös múltunk. Románok, magyarok, németek és délszlávok feudalizmus kori falusi és városi együttéléséről (Our common past. About the rural and urban coexistence of Rumanians, Hungarians, Germans and Southern Slavs during the time of the feudalism), Bukarest, 11., 30.p. 101
103 Table 19. Change in the ethnic structure of the population on the historical territory of Transylvania* ( ) Total population Hungarians Rumanians Germans Others Year number % number % number % number % number % , , , , , , , , , , , , , , , ,293, , , , , ,859, , ,113, , , ,861, , ,084, , , ,152, , ,242, , , ,084, , ,186, , , ,067, , ,132, , , ,476, , ,397, , , ,678, , ,472, , , Remark: The territory of Historical Transylvania this case: the medieval Voivodship of Transylvania. Sources: : Estimations of K. Kocsis based on Acsády I Magyarország népessége a Pragmatica Sanctio korában Magyar Statisztikai Közlemények XII. /Új folyam/, Budapest, 58.p., Barta G Az Erdélyi Fejedelemség első korszaka in: Makkai L. - Mócsy A. (szerk.) Erdély története I. A kezdetektől 1606-ig, Akadémiai Kiadó, Budapest, 510.p., Barta G Az Erdélyi Fejedelemség in: Erdély rövid története, Akadémiai Kiadó, Budapest, 238.p., Bieltz, E. A Handbuch der Landeskunde Siebenbürgens. Eine physikalisch-statistisch-topographische Beschreibung dieses Landes, Hermannstadt, 148.p., Jakó Zs Adatok a dézsma fejedelemségkori adminisztrációjához, Kolozsvár, Kubinyi A A Magyar Királyság népessége a 15. század végén, Történelmi Szemle XXXVIII p.159., Mályusz E. A magyarság és a nemzetiségek Mohács előtt - in: Magyar művelődéstörténet II. Budapest, p.123.p., Wagner, E Historisch-statistisches Ortsnamenbuch für Siebenbürgen, Böhlau Verlag, Köln - Wien, 45.p : Hungarian census data (mother tongue). south had dissappeared for similar reasons. At this time Hungarians still dominated the lowlands and hills extending to the foothills in the western areas, in the Szilágy and Székely Regions and the Transylvanian Basin (Fig. 23.). Earlier ethnic uniformity in the Mezőség Region and the Maros valley which were inhabited by Hungarians, was however disturbed by the appearance of large numbers of pastoral Rumanians moving from the overpopulated mountains. At the end of the 15th century there was an ethnic expansion of Rumanians. This was not only as a result of the establishment of twin villages 3 but also as a result of Rumanians settling in former Hungarian (Catholic) villages which had become poor deserted following epidemics and feudal exploitation causing the orig- 3 On the outskirts of the following Hungarian rural settlements Rumanian twin villages were founded: e.g Bós-Boju, Bányabükk-Vâlcele, Detrehem-Tritenii, Zsuk-Jucu, Pata, Kara-Cara, Dezmér- Dezmir, Kályán-Căianu, Rőd-Rediu, Palatka-Pălatca, Méhes-Miheşu, (Makkai L. 1943a Erdély népei a középkorban (Peoples of Transylvania in the Middle Ages) Deér J. - Gáldi L. (Eds.) 1943 Magyarok és románok (Hungarians and Rumanians) I., Budapest, p.). 102
104 inal population to escape or migrate to urban settlements 4. Parallel to a slow decline in Hungarians as opposed to Rumanians (and Serbs in the Banat) there was a Hungarian expansion in Saxon mining towns 5 while the Hungarian majority in Kolozsvár which was lost following the Tartar invasion (1242) and Saxon immigration, was presumably re-established at the turn of the 15 th and 16 th centuries 6. A mere 61% of Saxons in Transylvania, a total number of about 100,000, lived in areas with regional autonomy (King s Land-Königsboden, Barcaság-Bârsa- Burzenland, District of Beszterce). The rest of them inhabited 150 villages in the Hungarian counties (e.g. Lower and Upper Fehér, Küküllő, Torda, Kolozs, Doboka) and in some towns Saxons were mixed with Hungarians (Kolozsvár, Abrudbánya, Zalatna, Kőrösbánya, Torockó, Nagybánya, Felsőbánya etc.). At the same time the King's Land, belonging to the privileged territories directed by Universitas Saxorum, gradually lost its former Saxonian ethnic character, which can be attributed to the depopulation following Turkish incursions (e.g. 1420, 1438, 1479) and epidemics. Large-scale immigration of Rumanians into the areas where Saxons had been slaughtered or carried off was especially striking in the environs of Szászváros, Szászsebes, in the foreland of the Szeben Mountains and in the Olt 7. As a result of this, the proportion of the Orthodox (Rumanian) population increased to 20 % in the King's Land 8 and to 13 % in Barcaság by the end of the 15 th century 9. The Orthodox Rumanians also estimated at 100,000 were still leading a mainly a pastoral way of life at that time, and by the end of the 15 th century had established a centre to their ethnic territory migrating from the south to the north. This area stretched 4 Szabó I Magyarország népessége az 1330-as és az 1526-os évek között (Population of Hungary between 1330 and 1526) in: Kovacsics J. (Ed.) Magyarország történeti demográfiája (Historic Demography of Hungary), Budapest, 65.p. 5 Saxon mining towns becoming Magyarized from the 15 th century: e.g. Torockó-Rimetea, Abrudbánya-Abrud, Zalatna-Zlatna, Aranyosbánya-Baia de Arieş, Nagybánya-Baia Mare, Felsőbánya- Baia Sprie, Kapnikbánya-Cavnic see Iczkovits E Az erdélyi Fehér megye a középkorban (The Transylvanian Fehér-Alba County in the Middle Ages), Budapest and Maksai F A középkori Szatmár megye (The Medieval Szatmár-Satu Mare County), Budapest. 6 Makkai L Társadalom és nemzetiség a középkori Kolozsváron (Society and Ethnicity in Medieval Kolozsvár-Cluj), Kolozsvár 7 Wagner, E Wüstungen in den Sieben Stühlen als Folge der Türkeneinfälle des 15. Jahrhunderts Forschungen zur Volks- und Landeskunde (Bukarest) Bd.21. Nr , 45.p. 8 Niedermaier, P Zur Bevölkerungsdichte und -bewegung im Mittelalterlichen Siebenbürgen in: Forschungen zur Volks- und Landeskunde (Bukarest) Bd.29. Nr p., Wagner, E ibid. 48.p. 9 Graf, B Die Kulturlandschaft des Burzenlandes, Verlag für Hochschulkunde, München 103
 1943 Magyarok és románok I., Budapest, pp.314-440., Makkai L. 1946 Histoire de Transylvanie, Les Presses Universitaires de France, Paris, 382p.")
105 Figure 23. Ethnic map of the present-day territory of Transylvania (late 15 th century) Source: Csánki D Magyarország történelmi földrajza a Hunyadiak korában I - III., V., Budapest, Makkai L Erdély népei a középkorban Deér J. - Gáldi L. (szerk.) 1943 Magyarok és románok I., Budapest, pp , Makkai L Histoire de Transylvanie, Les Presses Universitaires de France, Paris, 382p., Pâclişanu, Z Un registru al quinquagesimei din in: Albumul dedicat Fraţilor Alexandru şi Ion I. Lăpedatu, Bucureşti, pp , Pascu, Ş. 1971, 1979 Voievodatul Transilvaniei I-II, Editura Dacia, Cluj-Napoca, Prodan, D Iobăgia în Transilvania în secolul al XVI-lea, I-III., Bucureşti, Suciu, C Dicţionar istoric al localităţilor din Transilvania, I - II., Editura Academiei R.S. România, Bucureşti, Wagner, E Historisch-statistisches Ortsnamenbuch für Siebenbürgen, Böhlau Verlag, Köln - Wien, 526p. Ugocsa-Ugocea: Szabó I Ugocsa megye, Budapest, Szatmár-Satu Mare: Maksai F A középkori Szatmár megye, Budapest, 240p., Máramaros-Maramureş: Bélay V Máramaros megye társadalma és nemzetiségei. A megye betelepülésétől a VIII. század elejéig, Budapest, 224p., Bihar- Bihor: Jakó Zs Bihar megye a török pusztítás előtt, Budapest, Győrffy I. 1915: Dél-Bihar népesedési és nemzetiségi viszonyai negyedfélszáz év óta Földrajzi Közlemények pp , Arad-Zaránd: Márki S Aradvármegye és Arad szabad királyi város története, Arad, 564p., Prodan, D Domeniul catăţii Şiria la 1525 Anuarul Institului de Istorie din Cluj III., pp , Csanád-Cenad: Borovszky S Csanád megye története 1715-ig I-II. MTA, Budapest, Hunyad-Hunedoara: Pataki, I Domeniul Hunedoara la începutul secolului al XVI-lea, Studiu şi documente 114., Editura Academiei R.S. Române, Bucureşti, 351p., Popa, R Siedlungsverhältnisse und Ethnodemographie des Hatzeger Landes im Jahrhundert in: Forschungen zur Volks- und 104
106 from the Banat Mountains through the Bihar Mountains up to Máramaros 10. There were no permanent settlements in the central, highly-elevated, expanding section of the ethnic territory of the Rumanians (with small villages and scattered farmsteads). This was because the population surplus had been absorbed by the depopulated Hungarian and Saxon villages in the Transylvanian Basin. As a consequence of their lifestyle, permanently-settled Rumanians in Transylvania at the end of the 15 th century were village dwellers and they did not form an ethnic majority in any of the towns. Other ethnic groups worth mentioning were present from about 1495 on the territory of present-day Transylvania : the indigenous but ethnically hardly separate Slavic population of the Banat; Ruthenians in the north (western margin of Máramaros, Kelemeni and Görgényi mountains); Bulgarians in the southern Saxonian areas (Rusciori, Cergău Mic), and Serbs in the Banat and in the Arad area. Both spontaneous and organised migration associated with the final occupation of Serbia by the Turks in 1459 (e.g. by Branković, Jakšić and Kinizsi) caused an influx of Serb immigrants, not only to South Banat, the Lippa Hills and the Maros-valley at Maroskapronca, but also to Continuation of sources for Fig. 23 Landeskunde (Verlag der Akademie der Sozialistischen Republik Rumänien, Bukarest) Bd.31. Nr.2. pp , Szászföld-Districtele şi scaunele săseşti: Binder P Közös múltunk. Románok, magyarok, németek és délszlávok feudalizmus kori falusi és városi együttéléséről., Bukarest, Binder, P Ethnische Verschiebungen im mittelalterlichen Siebenbürgen Zeitschrift für Siebenbürgische Landeskunde (Arbeitskreis für Siebenbürgische Landeskunde) Jg.18., H.2., pp , Graf, B Die Kulturlandschaft des Burzenlandes. Ein geographischer Beitrag zur auslandsdeutschen Volks- und Kulturbodenforschung, Verlag für Hochschulkunde, München, 136p., Müller, G Die ursprüngliche Rechtslage der Rumänen in siebenbürger Sachsenlande Archiv des Vereins für Siebenbürgische Landeskunde 38. pp , Fehér-Alba: Iczkovits E Az erdélyi Fehér megye a középkorban, Budapest, 88p., Kolozs-Torda-Doboka-Közép-és Belső-Szolnok-Kraszna / Cluj-Turda-Dobâca- Solnocul de mijloc şi din lăuntru-crasna: Jakó Zs A gyalui vártartomány urbáriumai, Erdélyi Tudományos Intézet CIII., 482p., Makkai L Északerdély nemzetiségi viszonyainak kialakulása, Kolozsvár, 20p., Makkai L Szolnok-Doboka megye magyarságának pusztulása a XVII. század elején, Kolozsvár, Makkai L Társadalom és nemzetiség a középkori Kolozsváron, Kolozsvár, Petri M Szilágy vármegye monographiája I - VI., Budapest, Wagner, E Register des Zehnten und des Schaffünfzigsten als Hilfsquellen zur historischen Demographie Siebenbürgens in: Benda Kálmán et al. (Hrsg.) 1987 Forschungen über Siebenbürgen und seine Nachbarn I. Festschrift für Attila T. Szabó und Zsigmond Jakó, Dr. Rudolf Trofenik, München, pp , 10 At the end of the 15th century the Rumanian ethnic territory extended over the dominions around the following castles (mainly founded in the 13th century): Törcs-Bran, Talmács-Tălmaciu, Hunyad-Hunedoara, Déva, Sebes, Illyéd-Ilidia, Halmos-Almăj, Váradja-Vărădia, Solymos-Şoimoş, Világos-Şiria, Sólyomkő-Peştiş, Valkó-Valcău, Léta-Lita, Jára-Iara, Csicsó-Ciceu, Kővár-Chioar, Görgény-Gurghiu (Makkai L. 1943a, ibid. 353.p.) 105
107 the environs of Csák, Temesvár, Arad, Világos, and Lippa. Nevertheless, a Hungarian majority population is assumed to have existed in these areas around Within this region the Hungarian population perished and their majority diminished, particularly in the flatlands of the Banat and in the Arad area - due both to the war 12 and epidemics of They were replaced mainly by Serbs and, to a lesser extent by Rumanians, Gypsies and Turks. On the territory of the principality of Transylvania, which was a symbol of the survival of Hungarian statehood, the previous ethnic processes continued undisturbed till the end of the 16 th century. In the towns of the Hungarian counties of Transylvania (especially in Kolozsvár, Torda, Gyulafehérvár and Déva) the Hungarian character of local society was strengthened by an influx of Hungarians who had escaped from the Great Hungarian Plain which was occupied by the Turks. The Rumanian population became increasingly settled and changed from shepherding to farming. This was due to the relative demographic saturation of of their previous ethnic areas, and they not only occupied Hungarian and Saxon ethnic areas but settled in the earlier uninhabited parts of mountain regions 13. At the end of the 16 th century, historical Transylvania was assumed to have had a population of 670,000 with approx. 52% Hungarians, 28% Rumanians and 19% Saxons 14. During the so-called fifteen year war, between , there were serious clashes between the Hapsburg (Austrian), Ottoman (Turkish) Empires, Transylvanian (Hungarian) and Wallachian (Rumanian) Principalities, and Giorgio Basta, a general of the Hapsburg Empire, and his ally the Wallachian voivode Mihai Viteazul ( Michael the Brave ), imposed terror and organised subsequent massacres in Transylvania, a Hungarian principality striving for independence. Rumanians and Székely-Hungarians suffered less not only for political reasons, but because they occupied wooded mountain areas far from the routs of the campaigns. But the mainly Hungarian dwellers in the central parts of Transylvania (e.g. in the environs of Kolozsvár and Torda) were almost undefended. As a consequence of massacres, plague and famine, the population of (later called) Szolnok-Doboka county 11 Makkai L. 1943a, ibid. 389.p., Makkai L Histoire de Transylvanie, Les Presses Universitaires de France, Paris, Márki S Aradvármegye és Arad szabad királyi város története (History of Arad County and Free Royal Town Arad), Arad, Borovszky S Csanád megye története 1715-ig I-II. (History of Csanád County till 1715), MTA, Budapest 12 Acts of war devastating and desolating the Banat and the vicinity of Arad: peasant uprising led by George Dózsa (1514), ravaging by Serb troops of Jovan Crni Nenad (1527), main Turkish campaigns of 1551, 1552, Barta G Az Erdélyi Fejedelemség első korszaka (The First Period of the Principality Transylvania) in: Makkai L. - Mócsy A. (Eds.) Erdély története (History of Transylvania) I. Akadémiai Kiadó, Budapest p. 14 Estimations of the population number of Transylvania around 1595 (350 thousand Hungarians, 190 thousand Rumanians, 130 thousand Saxons) based on the 1495 population and ethnic data using also the following sources: Barta G ibid. 510.p., Barta G Az Erdélyi Fejedelemség (The Principality of Transylvania) in: Erdély rövid története (Short History of Transylvania), Akadémiai Kiadó, Budapest, 238.p., Jakó Zs Adatok a dézsma fejedelemségkori adminisztrációjához (Data to the Administration of the Tithe during the Period of the Transylvanian Principality), Kolozsvár 106
108 with a Hungarian majority, dropped by 70% between and that of Kolozsvár by 68% between The number Hungarians decreased by 85% and that of the Rumanians by 45% in Szolnok-Doboka over the same period. Based on the above data, and assuming Székely losses to have been similar to Rumanian ones, no more than 330,000 people might have lived on the territory of the now ruined Transylvania in 1604 (Fig. 24.). During a relatively calm period until the mid-16 th century a massive migration of Rumanians continued from the inner mountain areas (e.g. Kővár-Chioar Land, Bihar- Apuşeni Mts.), and from the Rumanian principalities (Wallachia, Moldavia), because of extreme social oppression and the uncertain political situation there. These large numbers of Rumanians, solving a shortage of labour in the area, were welcomed by Hungarian landowners and the leaders of Saxon settlements. By the mid-17 th century the proportion of Rumanians probably exceeded one third of the population 16, and may have equalled the combined number of Hungarians and Székelys (Fig. 25.). Following an unsuccessful invasion of Poland by Prince George Rákóczi II between , certain regions of Transylvania were devastated by Turkish and Tartar troops and a subsequent plague decimated the population, again, predominantly its Hungarian part. Due to the annihilation, the kidnapping and fleeing of Hungarians, and the immigration of Rumanians into the territories of Kolozs, Doboka, Inner and Middle-Szolnok, and Kraszna counties, 177 out of 317 Hungarian villages changed to having a Rumanian majority population during the 17 th century 17. As a result, the Transylvanian Basin, which had been an area with Hungarian majority at the end of the medieval period, disintegrated, while the Saxon villages in the Beszterce district and in King s Land were ruined. Due to these events the number of Rumanians in Transylvania exceeded Hungarians in the second half of the 17 th century. Wars between 1599 and 1711 had created a profound and irreversible shift in the ethnic composition of Transylvania in favour of the Rumanians who enjoyed a permanent replenishment of population from over the Carpathians, and these changes eventually proved decisive in shaping ethnic patterns well into the 20 th century. According to the data on tax-payers of 15 Makkai L Szolnok-Doboka megye magyarságának pusztulása a XVII. század elején (The Destruction of the Hungarians of Szolnok-Doboka County in Early 17 th Century), Kolozsvár, 31., 34.p., Bakács I A török hódoltság korának népessége (The Population of Parts of Hungary under Ottoman Rule) in: Kovacsics J. (ed.) Magyarország történeti demográfiája (Historic Demography of Hungary), Budapest, 136.p. 16 According to V. Lupu, the Rumanian voivode of Moldavia, over one third of the population of Transylvania were already Rumanians at this time - Szilágyi S Erdély és az északkeleti háború. Levelek és okiratok (Transylvania and the War in NW. Letters and Documents), I. kötet, Budapest, , p.). 17 Makkai L Északerdély nemzetiségi viszonyainak kialakulása (The Formation of the Ethnic Structure of Northern-Transylvania), Kolozsvár, 18.p. 107
109 Figure 24. Change in the number of Hungarians, Rumanians and Germans on the historical territory of Transylvania ( ) 1720 on the territory of historical Transylvania 806,000 people may have lived there 18, about half of them Rumanians 19. Following the liberation of the Kőrös-vidék / Crişana region (1692) and of Banat (1718) from Ottoman (Turkish) occupation, large numbers of Rumanians from the mountain areas were attracted by the almost depopulated flatlands 20. The Hapsburg administration settled predominantly Catholic Germans in the western, most fertile part of Banat, in the surroundings of strategically important towns like Temesv r and Arad, and in the mining areas of Oravicabánya, Dognácska, Szászka, Boksán, Resicabánya etc. 21. As a result of this, a fairly uniform German ethnic area emerged west of the Lippa-Temesvár-Detta line, while to the east the Banat became essentially Rumanian. The ethnic composition of this region was made extremely colourful as a result of the 18 Acsády I Magyarország népessége a Pragmatica Sanctio korában (Population of Hungary ). Magyar Statisztikai Közlemények XII. /Új folyam/, Budapest, 58.p. 19 Also according to Prodan, D. this was the period when Rumanians attained their absolute ethnic majority in Transylvania - (1944 Teoria imigraţiei românilor din principatele române in Transilvania in veacul al XVIII-lea, Sibiu, 21.p.). 20 Jakó Zs Újkori román települések Erdélyben és a Partiumban (Rumanian Settlements in Transylvania and in Crişana during the 17-18th centuries) in: Deér J. - Gáldi L. (eds.) 1943 Magyarok és románok (Hungarians and Rumanians)I., Budapest, p. 21 Buchmann K A délmagyarországi telepítések története (The History of Colonization in Southern-Hungary) I. Bánát, Budapest, 130p., Feneşan, C Kolonisation des Banater Berglandes im 18. Jahrhundert Forschungen zur Volks- und Landeskunde (Bukarest) Bd.22. Nr.2. pp
 subsequent settlement of Serbs, Crashovans, Hungarians, Bulgarians, Slovaks and Czechs")
110 Figure 25. Change in the ethnic structure of population on the historical territory of Transylvania (16 th 20 th century) subsequent settlement of Serbs, Crashovans, Hungarians, Bulgarians, Slovaks and Czechs during the 18 th century. In the Bihar, Szilágy and Szatmár counties, apart from the Rumanian ethnic expansion which was to the detriment of Hungarians, important changes in ethnic composition were introduced in the 18 th century by the settlement of Slovaks in the Réz Mountains and of Germans in the vicinity of Nagykároly. In the area of historical Transylvania, resettlement meant that the Rumanians came down from the mountain territories and migrated there from Wallachia and Moldavia. The Trans-Carpathian migration of Rumanians was not however exclusively one-way (into Transylvania); it depended on the socio-economic situation and was closely related to security considerations - it was often directed from Transylvania to Wallachia or Moldavia 22. The positive balance of migration into Transylvania is witnessed by an increase well above average in the Rumanian population: their estimated number was 561,000 in 1720, 453,000 in 1733, 538,000 in 1750, 561,000 in 1762 and 729,000 in Due 22 Prodan, D. ibid. 21.p. 23 Chirca, H Intregire la conscripţia confesională din 1733 privind populaţia românească din Transilvania (Addenda to the census 1733 regarding to the Rumanian population of Transylvania) in: Pascu, S. (Red.) Populaţie şi societate. Studii de demografie istorică, Vol. I., pp , Togan, N Românii din Transilvania la Conscripţia episcopului Ioan In. Klein de Sadu Transilvania XXIX. (Sibiu), Bunea, A Statistica Românilor în Transylvania în 1750 Transilvania XXXII. (Sibiu) 1901, pp , Nyárády R. K Erdély népességének etnikai és vallási tagozódása a magyar államalapítástól a dualizmus koráig (Ethnic and religious structure of the population of Transylvania since the foundation of the Hungarian state till the time of Dualism) in: 109
111 to the settlement of Orthodox Rumanians and Gypsies speaking Rumanian, on the territory of the 11 Saxon seats (administrative units), as well as 87,000 Lutheran Saxons, 66,000 (43%) Orthodox people (Rumanians and Gypsies) lived in 1765; their share had risen over 53 % by By this time the Saxon seats of Szászváros, Szászsebes, Újegyház and Szerdahely which were devastated in the 16 th and 17 th centuries, had become predominantly Rumanian. By the end of the 18 th century as a result of migration, an ethnic pattern emerged which did not change essentially in the rural areas until the mid-20 th century. During a hundred years following the 1770s the number of the Rumanian population rose at a lower rate, but in 1832 it surpassed one million in the historical area of Transylvania. In this way their share of the overall population was close to 60%, well exceeding that of Hungarians (29%). Several tens of thousands of Hungarians and Rumanians fell victim to the War of Independence of resulting in a drop of 190,000 between 1848 and According to the Austrian census of 1850 out of a population of 1,861,000 living on the territory of historical Transylvania, 58.3% declared themselves to be Rumanian, 26.1 % Hungarian and 10.3% German. Following the Austro-Hungarian Compromise (1867) when Transylvania was formally reannexed to Hungary and both socio-economic modernisation and capitalist transformation were taking place, the last cholera epidemic occurred in even before there was any improvement in health conditions. As a result, the total population of Transylvania dropped by 3.2% between the 1869 and 1880 censuses 26. At the time of the first Hungarian census in 1880, in answer to questions regarding native/mother tongue, it transpired that 21% of Hungarians, 17.1% of Germans and 3.4% of Rumanians lived in urban settlements. Hungarians formed the majority in 62% of towns 27. At the turn of the century there was significant emigration to America, to Rumania and to the central parts of the country - primarily to Budapest, the capital. There was also some immigration of Jews from Ukrainian territories (Galicia Province) and Bukovina to Máramaros, to Northern Transylvania 28 and to the larger towns located along the periphery of the Great Hungarian Plain (e.g. Temesvár, Arad, Nagyvárad, Szatmárnémeti). Apart from the favourable rise in the birthrate among Hungarians between 1880 and 1910, the voluntary linguistic assimilation and Magyarization of the A KSH Népességtudományi Kutató Intézetének történeti demográfiai füzetei 3., Budapest, pp.7-55., Ballmann, J. M Statistische Landeskunde Siebenbürgens im Grundrisse, Hermannstadt, 120p., Lebrecht, M Versuch einer Erdbeschreibung des Grossfürstentums Siebenbürgen, II. Auflage, Hermannstadt 24 Müller, G Die ursprüngliche Rechtslage der Rumänen in siebenbürger Sachsenlande Archiv des Vereins für Siebenbürgische Landeskunde 38., 28.p. 25 Bieltz, E.A ibid.148.p. 26 The cholera epidemics had reduced number of Rumanians by c 200,000 and that of Hungarians by c 60, Manuila, S Aspects démographiques de la Transylvanie La Transylvanie. Institut d'istoire Nationale de Cluj, Académie Roumanie, Bucarest, 804.p. 28 Growth of population of Jewish confession in historical Transylvania: 1850: 11,692; 1880: 29,993; 1910: 64,
112 Jews 29 greatly contributed to the growth of the Hungarian speaking population (Figs. 26., 27.). An increase in the number of Hungarians was observed in urban settlements (e.g. in Temesvár, Arad, Brassó, Nagyszeben). On the Rumanian ethnic territory of South Transylvania, colonies mushroomed around heavy industrial works (Resicabánya, Boksán, Anina, Vajdahunyad, Kalán, Petrozsény etc.) where there were raw material deposits (coal and iron ore), and absorbed large masses of skilled workers, mainly Hungarians and Germans. As far as the Rumanian population is concerned, their Magyarization was negligible. Kovászna, Torda, Nagyszalonta, Bánffyhunyad, Marosvásárhely were towns where the proportion of Hungarians had dropped as a result of Rumanian immigration. Rumanian expansion was even stronger in Nagyszeben, Segesvár, Medgyes, at the expense of the Saxons. At the time of the 1910 Hungarian census, of the nearly 5,3 million population living on the territory of present-day Transylvania, 54% declared Rumanian to be their mother tongue, 32% Hungarian and 11% German (Tab. 20.). In comparison with the situation at the end of the 18 th century the ethnic pattern had not essentially changed, only the partial Magyarization of Greek Catholics, Jews and Roman Catholic Germans created a more homogeneous ethnic Hungarian area of 20 to 30 km width along the present Hungarian-Rumanian state border (North-Bihar - Szatmár - Ugocsa), while in the Banat and in the southern part of Transylvania Hungarian language pockets, ethnic islands grew in number (Fig. 28.). The ethnic territory of Germans (the Saxons and Swabians) was the least broken up by Rumanian villages in the environs of Beszterce, in remote parts of the Hortobágy Hills and in the Banat, between Temesvár and Nagyszentmiklós. In the Banat an extremely complex ethnic pattern survived (with Rumanians, Germans, Hungarians, Serbs, Gypsies, Czechs, Bulgarians, Crashovans and Slovaks) from colonisations of the 18 th century. This relative ethnic stability characterised the ethnic territory of the Slovaks in the Réz Mts. and that of the Ruthenians in Máramaros. Nevertheless, there was an absolute or relative majority of those declaring themselves to be Hungarian in 30 of the 41 urban settlements of presentday Transylvania, those of the state-forming ethnic group. There was a Rumanian majority in 6 smaller towns (Karánsebes, Hátszeg, Szászváros, Szászsebes, Abrudbánya, Vízakna), while Germans dominated Nagyszeben, Medgyes, Segesvár, Szászrégen and Beszterce. Most of those people with Hungarian lingual affiliation (23-28,000) lived in Nagyvárad, Kolozsvár, Arad, Szatmárnémeti, Temesvár and Marosvásárhely in The largest Rumanian communities were in Brassó, Arad and Nagyszeben (9-12,000), the German ones (11-32,000) being Temesvár, Nagyszeben and Brassó. Among the 5,321 present-day settlements ethnic majorities were distributed as follows: 3,921 Rumanian, 1,026 Hungarian, 279 German, 81 Slavic, one Gypsy (Priszlop at Resinár in Szeben county); the areas of 13 present-day settlements were uninhabited. 29 Of the Jewish population of Transylvania 55.6% in 1890, and 73.3% in 1910 declared their native tongue to be Hungarian (Jakabffy E Erdély statisztikája Statistics of Transylvania, Lugos, 7.p.) 111
113 Figure 26. Change in the population number of ethnic Hungarians in major areas of Transylvania ( ) Figure 27. Change in the population number of the main ethnic groups on the present-day territory of Transylvania ( ) 112
114 Table 20. Ethnic structure of the population on the present territory of Transylvania ( ) Sources: 1880, 1900, 1910: Hungarian census data, 1920, 1930, 1948, 1956, 1966, 1977, 1992: Rumanian census data, 1941: combined Hungarian and Rumanian census data, 1997: estimation of K.Kocsis. 1900, 1920 census data from Varga E.Á Népszámlálások a jelenkori Erdély területén (Censuses on the present-day territory of Transylvania), Regio - MTA Történettudományi Intézet, Budapest, pp Remarks: Present territory of Transylvania = historical Transylvania, Maramureş, Crişana, Rumanian Banat. Italic figures: mother / native tongue data, other figures: ethnic data. Rumanians with Aromunians and Macedorumanians; Hungarians with Székelys and Csángós; Germans with Saxons and Swabians. Total Year population Rumanians Hungarians Germans Ethnic Jews Gypsies Others number number % number % number % number % number % number % ,005,467 2,294, ,045, , , ,872,366 2,685, ,438, , , ,260,181 2,829, ,663, , , ,764 3, ,114,124 2,930, ,305, , , ,484 3, ,549,806 3,208, ,353, ,278 9,.1 178, , ,507 2, ,549,806 3,234, ,480, , , , ,717 2, ,912,413 3,304, ,744, , ,812 5, ,761,127 3,752, ,481, , , ,850 2, ,218,427 4,041, ,558, , , , ,133 2, ,719,555 4,559, ,597, , , , ,169 1, ,500,229 5,203, ,691, , , , ,581 1, ,723,313 5,684, ,603, , , , ,882 1, ,723,313 5,815, ,619, , , ,725 1, ,612,953 4,800, ,470, , ,150, ,
115 Figure 28. Ethnic map of the present-day territory of Transylvania (1910) Source: Census 1910 At the end of World War I territories of Eastern Hungary were occupied by the Royal Rumanian Army. From this area of about 103,000 km² (Transylvania in the broader sense) was annexed to Rumania at the Peace Treaty of Trianon (4 June, 1920) by the victorious Entente Powers. Thus, according to the 1910 census data, nearly 2,5 million non-rumanians (including 1,7 million Hungarians), 46% of the total population of Transylvania, were to become citizens of Rumania which suddenly turned into a multi-ethnic state. According to the figures of the National Office for Refugees in Budapest, between 1918 and 1924, following the Hungarian-Rumanian shift of power, 107,035 Hungarians fled Rumania to the new state territory of Hungary 30. The number of Hungarians recorded in Rumanian statistics was further decreased firstly by the classification of Jews (mostly Hungarian speakers) into a separate ethnic category, and 30 Petrichevich-Horváth E Jelentés az Országos Menekültügyi Hivatal négy évi működéséről (Report about the activity of the National Office for Refugees), Budapest 114
116 by the registration of already Magyarized Greek Catholics and Orthodox people as Rumanians, and of Roman Catholic Swabians of German origin in the Szatmár Region as Germans 31. The decrease in the number and proportion of Hungarians between 1910 and 1930 for the above reasons was striking in the urban settlements of the western border region between Kőrös-vidék-Crişana and Máramaros, (e.g. Arad, Nagyvárad, Nagykároly, Szatmárnémeti, Máramarossziget), while there was a massive additional resettlement of Rumanians in Kolozsvár, Torda, Marosvásárhely, Zilah, Nagybánya, Déva, Petrozsény and Dés (Tabs. 21., 22., Fig. 29.). As a consequence, a mere 37.9% of the urban population of Transylvania were registered as Hungarian in After the towns received 185,000 Rumanians between 1910 and 1930 they represented 35% of the total urban population. Outside of the towns, Rumanianization took place within the framework of land reform by establishing Rumanian colonies along the new Hungarian- Rumanian border, on the ethnic Hungarian territories of Szatmár and Bihar counties 32. Economic reasons apart a policy of ethnic discrimination led to massive emigration of ethnic minorities; the distribution of emigrants from Rumania in 1927 was as follows: 30% Germans, 28% Jews, 12% Hungarians and 5% Rumanians 33. The number of Germans between the two world wars stagnated, due to their low birthrate 34 and because of emigration. There was a sudden increase in Germans in the Szatmár region; they had previously declared themselves to be Hungarian. Among urban settlements, an absolute majority of Germans was retained only at Resicabánya (55.4% in 1930) and a relative one in Nagyszeben, Medgyes and Segesvár. Due to the expansion of Rumanians and Gypsies with a much higher birth rate, only two Saxon districts in Transylvania (Medgyes, Erzsébetváros) had a German majority population at that time. 68% of Transylvanian Jewry having previously undergone rapid Magyarization 35 and numbering 179,000 in 1930, lived mainly in the north, in the coun- 31 See Varga E. Á Népszámlálások a jelenkori Erdély területén (Censuses on the present territory of Transylvania), Regio - MTA Történettudományi Intézet, Budapest, 208p. 32 Micula Nouă, Bercu Nou, Mireşul-Mesteacăn, Drăguşeni, Livada Mică-Colonia Livada Nouă, Principele Mihai-Traian, Locateşti-Dacia, Colonel Paulian, Gelu, Baba Novac, Lucăceni, Horea, Marna Nouă, Scărişoara Nouă, Mihai Bravu, Regina Maria-Avram Iancu etc. 33 Braunias, K Die Auswanderung aus Rumänien und die Minderheiten Nation und Staat (Wien) 1. pp Mean annual natural increase and vitality index by the main ethnic groups of Transylvania between : Rumanians 8.1, Hungarians 6.2, Germans (Manuila, S Studii etnografice asupra populaţiei României. Cu o anexă despre evoluţia numerică a diferitelor grupe etnice din România în anii , Bucureşti, pp ) and Rumanians: 130.8, Hungarians: 130.4, Germans: (Râmneantzu, P The biological grounds and the vitality of the Transylvanian Rumanians, Centrul de Studii şi Cercetări Privitoare la Transilvania, Sibiu, 64.p.). 35 In 1930 on the territory of present-day Transylvania the number of Jews (according to the religious affiliation) was 192,833, ethnic Jews numbered to 178,699, and 111,275 persons declared Yiddish their native tongue (Varga E. Á ibid. pp ). 115
117 Table 21. Change in the number of ethnic Hungarians by major parts of Transylvania ( ) Year Székely Region/ Szeklerland Rest of Transylvania Partium Banat , , ,669 41, , , , , , , , , , , , , , , ,661 92, , , ,036 86, , , ,187 70,772 Sources:1880,1910: Hungarian census data (mother/native tongue), 1977, 1992: Rumanian census data (ethnicity), 1930, 1948, 1956: Rumanian census data (mother/native tongue) Remark: Székely Region/Szeklerland = Maros/Mureş, Hargita/Harghita, Kovászna/Covasna counties; Rest of Transylvania = Beszterce-Naszód/Bistriţa-Nasăud, Kolozs/Cluj, Fehér/Alba, Szeben/Sibiu, Brassó/Braşov, Hunyad/Hunedoara counties; Partium = Máramaros/Maramureş, Szatmár/Satu Mare, Szilágy/Sălaj, Bihar/Bihor, Arad counties; Banat = Temes/Timiş, Krassó-Szörény/Caraş-Severin counties ties Máramaros (34,000), Szatmár (24,000), Bihar (22,000), Kolozs (17,000), Szilágy (13,000) and Szamos (10,000). During World War II ministers of foreign affairs in Germany and Italy decided to calm down the war-like tensions between their allies, Hungary and Rumania, dividing the territory of Transylvania between these two countries (Second Vienna Award, 30 August 1940). The northern half (43,104 km², with a 53.6% population of Hungarians (1941 Hungarian census data) 36 was reannexed to Hungary, while the southern part with a 68.5% population of Rumanian ethnic origin (1941 Rumanian census data) remained in Rumania. In this extremely tense situation, and for a variety of reasons (a sense of fear, being compelled to emigrate, being expelled), 219,927 Rumanians 37 left the northern area which was under Hungarian administration, between , while 190,132 Hungarians fled Southern Transylvania between As a result of a massive, enforced Hungarian-Rumanian population shift ( ), accelerated Rumanianization and a reduction in the Hungarian population of town in South 36 The proportion of Hungarians in North Transylvania was 51.4% in 1910 (Thirring L A visszacsatolt erdélyi és keletmagyarországi terület - The Reannexed Transylvanian and East- Hungarian Territory Magyar Statisztikai Szemle 1940 / p.), and it dropped to 38.1% in 1930 (Die Bevölkerungszählung in Rumänien 1941, Publikationsstelle Wien, 1943, 20.p.), according to estimations by Manuila, S. the latter was 37.2% in 1940 (Spa iul istoric şi etnic românesc III., Bucureşti, 1942, 17.p.). 37 Universul (Bucureşti) and , Schechtman, J.B European Population Transfers , New York - Oxford University Press, 430.p. 38 Main data on Rumanian refugees according to the conscription of February 1944 Magyar Statisztikai Szemle 1944 / pp , Stark T Magyarország második világháborús embervesztesége (Human Losses of Hungary during the War II), MTA Történettudományi Intézet, Budapest, 65.p. 116

118 Figure 29. Change in the ethnic structure of population in selected municipalities of Transylvania ( ) 117
119 Table 22. Change in the ethnic structure of selected Year Total population Rumanians Hungarians Germans Others number % number % number % number % number % Temesvár - Timişoara , , , , , , , , , , , , , , , , , , , , , , , , , , , , , , , , , , , , , , , , , , , , , Kolozsvár - Cluj-Napoca , , , , , , , , , , , , , , , , , , , , , , , , , , , , , , , , , , , , , , , , , Brassó - Braşov , , , , , , , , , , , , , , , , , , , , , , , , , , , , , , , , , , , , , , , , , Nagyvárad - Oradea , , , , , , , , , , , , , , , , , , , , , , , , , , , , , , , , , , , , Arad - Arad , , , , , , , , , , , , , , , , , , , , , , , , , , , , , , , , , , , , , , , , , , , , ,
120 cities and towns of Transylvania ( ) Year Total population Rumanians Hungarians Germans Others number % number % number % number % number % Marosvásárhely - Târgu Mureş , , , , , , , , , , , , , , , , , , , , , , , , , , , , , , Nagybánya - Baia Mare , , , , , , , , , , , , , , , , , , , , , , , , , , , , , , , Szatmárnémeti - Satu Mare , , , , , , , , , , , , , , , , , , , , , , , , , , , , , , Zilah Zalău , , , , , , , , , , , , , , , , , , , , , , , , Csíkszereda Miercurea Ciuc , , , , , , , , , , , , , , , , , , , , Sources: 1880, 1910: Hungarian census data (mother/native tongue), 1930, 1948, 1956, 1966: Rumanian census data ( mother/native tongue), 1941: Brassó, Temesvár, Arad = Rumanian census data (ethnic origin); other cities and towns = Hungarian census data (mother/native tongue), 1977, 1992: Rumanian census data (ethnicity). Remark: All data were calculated for the present administrative territory of the cities and towns excluding their village components (except in 1948 and 1977).
121 Transylvania was particularly striking between 1930 and 1941 in Torda (-30%), Brassó (-24%), Arad, Déva, Petrozsény (-20%), Temesvár and Nagyenyed (-17%). Meanwhile, in the Hungarian section of Transylvania, due to both the enforced Rumanian-Hungarian migrations, and the declaration of a majority of Jews and Szatmár County Swabians as having a Hungarian mother tongue, ethnic proportions similar to those of the 1910 census had been re-established in urban settlements (80-90% Hungarians). After Rumanian civil servants had fled and settled in Transylvania following 1918, a drop in the number in Rumanian population was observed in Kolozsvár (-25,000), Nagyvárad (- 16,000), Szatmárnémeti (-12,000), Marosvásárhely (-8,000) and Nagykároly (-4,000). Because of the pressure exerted on the "hostile" minorities, large numbers of Hungarians fled rural areas of Rumania such as Szatmár and Bihar Counties, and villages of the southern regions of the Maros and Küküllő valleys (e.g. Piski, Alvinc, Tövis, Marosújvár, Felvinc, Aranyosgyéres, Radnót and Bonyha). During World War II there was no massive extermination or deportation of Jews in South Transylvania, in contrast to Transnistria, Bessarabia and Moldavia. In Northern Transylvania, however, the overwhelming number of 151,000 Jews, predominantly Hungarian native speakers, were deported in May and June Thus the Hungarian population was greatly reduced in Nagyvárad (-20,000), Kolozsvár (-16,000), Szatmárnémeti (-12,000) and Marosvásárhely (-5,000). Following Rumania s siding with the Allied Powers towards the conclusion of World War II (23 August 1944), Northern Transylvania became undefendable and large masses of Hungarians began to escape, especially those who had settled there after 1940 and had compromised themselves politically; Saxons from the Beszterce region and Swabians from Szatmár County were evacuated. During the war, shifts of power were accompanied by bloody acts of vengeance committed both by Hungarians and Rumanians; these only had a local effect on demographic-ethnic patterns of population. After Northern Transylvania was recovered by Rumania no official measures were taken to expatriate Germans. However, in order to achieve the social and national aims of Rumanian land reform which was adopted in 1945, the majority of Germans who remained in the country and were deprived of their land and property (mainly those in the Banat), were taken to labour camps. At least 70,000 of them were deported to the Soviet Union to do forced labour 40. These migrations caused the number of Saxons to drop by 37% and Swabians by 39%. 39 Remember 40 years since the massacre of the Jews from Northern Transylvania under Horthyst occupation, 1985, Published by Federation of Jewish Communities in the S.R. of Romania, Bucureşti, 71p. 40 Baier, H Deportarea etnicilor din România în Uniunea Sovietică 1945 (Deportation of ethnic groups of Rumania into the USSR in 1945), Sibiu. Number of Transylvanian Saxons was put by Wagner, E. (1983, Die Bevölkerungsentwicklung in Siebenbürgen in: Schuster, O. (Ed.) Epoche der Entscheidungen. Die siebenbürger Sachsen im 20. Jahrhundert, Böhlau Verlag, Köln - Wien, 87.p.) at 48,
122 About one third of Jews in North Transylvania survived World War II, similar to those of Moldavia and Bessarabia 41. Since then the number of Transylvanian Jews has decreased to 2,687 (1992 census data) due to emigration to the State of Israel established in One third of Slovaks left their homeland (Nagylak, Réz Mts.) to make a home in settlements in South Slovakia from where Hungarians were expelled. As a result of the deportation of Hungarian Jews and the exodus in autumn 1944, Hungarian speakers in Northern Transylvania diminished by c 238,000 between 1941 and A massive population shift (of Hungarians, Jews, Germans and Rumanians), meant that by the time of the 1948 census Rumanians had achieved an absolute ethnic majority in Transylvanian urban settlements (50.2%) while the proportion of Hungarians was reduced to 39 % and that of Germans to 7.2 % 43. Following the communist take-over in the 1950 s, during the heroic age of Rumanian socialist industrialisation, a concentration of population, an increase in industrial jobs and urban population were the primary goals. Between 1948 and 1956 the urban population of Transylvania increased by over one million. In addition to fulfilling the socio-political aims of early East European socialist urbanisation, the Rumanian ethno-political aim was to turn cities and towns with a Hungarian character into ones with a Rumanian ethnic majority. The ethnic structure of urban settlements (with 49.9 % non-rumanian native speakers), would undoubtedly have changed even without political interference, because the source of their population growth (the inhabitants of Transylvanian villages), had been two-thirds Rumanian for more than two centuries. Time would have determined where, when and to what extent the Rumanian majority in urban centres would prevail. It is a fact, that of the 2,1 million population that lived in present-day towns, the 1956 census found 58.1 % Rumanians, 30.3 % Hungarians and 7.4% Germans 44. By this time on the present-day territory of Kolozsvár, the Hungarian cultural centre of the region, the number of the Rumanian population equalled that of Hungarians (47.9 %), while Nagybánya lost its Hungarian majority and became Rumanian (55.9%). It should be noted that in the period between the censuses of 1948 and 1956 there was an increase in the number and proportion of Germans in urban populations, since those who had returned from labour camps found themselves excluded from the land reform and deprived of their property. They had to look for jobs 41 In ,476 Jews were recorded in urban settlements of North Transylvania and 11,230 persons in the rural ones (38.4 and 17.5% of the 1941 population) - (Remember , ibid.). 42 According to census data the most dramatic drop in the number of persons who declared Hungarian to be their mother tongue was recorded in Nagyvárad (-33,000), Kolozsvár (-30,000) and Szatmárnémeti (-17,000) between Source of the 1948 census data: Golopen ia, A. - Georgescu, D.C. Populaţia Republicii Populare Române la 25 ianuarie 1948, Extras din "Probleme economice", Nr. 2. Martie 1948, Bucureşti, pp Az erdélyi települések népessége nemzetiség szerint (The Population of the Transylvanian Settlements according to the ethnicity, ), 1996, Központi Statisztikai Hivatal, Budapest, 421p. 121
123 in cities, towns and industrial centres. As a result, half of the Transylvanian Germans became urban dwellers 45. According to 1956 census data, 6,218,427 people lived on the present-day territory of Transylvanian counties. Of these 65 % (4,04 million) declared themselves to be Rumanian; 25.1 % (1,56 million) Hungarian; 5.9 % (368,000) German, and 1.3 % (78,000) Gypsies. Because of the massive migrations and losses during the war, the rural ethnic territory of Germans (whose numbers had diminished by 200,000 since 1941) vanished completely. An ethnic vacuum in this fertile region of the Banat and in the agriculturally less important area of the Saxon villages which were emerging in , had been almost completely filled by Rumanians by There had been a massive settlement of Rumanians in the Barcaság Land, while 95 % of Saxons left the Beszterce region in Thus, no settlements with an absolute majority of Germans existed in these areas. In this area, in the environs of Szászrégen and Bátos, Hungarians moved into vacant villages. People of Swabian origin who had undergone Magyarization already in the 19 th century and lived in the Szatmár region, overwhelmingly declared themselves to be Hungarian both regarding their nationality and native tongue, in contrast to the period between 1920 and At the same time, the Rumanian population returned to small colonies founded between 1920 and 1940 along the borderline, in the Szatmár - Bihar ethnic Hungarian territory, and new villages were also established. In spite of a 7.8 % average natural increase in population, the inhabitants of the Transylvanian counties only grew by about 1.5 million, i.e. 24.2% in the period between the 1956 and 1992 censuses 46. Owing to the high discrepancies among different ethnic groups regarding their birthrate and demographic trends, due to changes in ethnic identity (assimilation - dissimilation), the number of Gypsies increased by 159 %, the Ukrainians-Ruthenians by 59.7 %, the Rumanians by 40.7 % and Hungarians by 2.9 %, while there was a 93.9 % decrease in the number of Jews, 70.4 % in Germans, and a % decrease in Slovaks, Bulgarians, Serbs and Croats-Crashovans during the 36 years studied. An average annual natural increase according to ethnic groups can only be estimated for this period (Rumanians: 8.6, Hungarians: 6.6, Germans: 3.3 ) 47. Based on these figures, the number of Rumanians should have been 5,3 million (instead of the recorded 5,684,000), the Hungarians 1,928 million (as oppposed to 1,6 million) and Germans 412,000 (instead of 109,000) in Large changes in proportions were due to emigration from and immigration into Transylvania which affected more than one million people, causing a negative balance for ethnic minorities 45 Proportion of urban dwellers within the main ethnic groups in 1956: Rumanians 30.4 %, Hungarians 41.1 %, Germans 42.4 % (24.2 % in 1948). 46 Hungary's population increased by 5.2% and the population of Rumania Proper grew by 11.2% between In this period a mean annual natural increase was 2,3 in Hungary and 11,2 in Rumania Proper. 47 Our estimations, checked by migration components were based on differences between rates of natural increase by the main ethnic groups in the period and the recorded Transylvanian average (7,8 ). 122
124 and a positive one for Rumanians. According to the statistics concerning place of birth and demographic trends, reliable estimates put the number of Rumanians who resettled from the regions over the Carpathians at about 800,000, while a quarter of a million people went to Wallachia and Moldavia between 1945 and Of the latter, the number of Hungarians may have reached 60,000. An overwhelming number of immigrants from Moldavia and Wallachia were directed to South Transylvania, into the counties of the Brassó-Arad-Resicabánya triangle of heavy industry, where an increased demand for workers could not be satisfied. This was due to a traditionally low birthrate (which subsequently became a decline) and later, to a rise in the emigration of Germans. Later on, large numbers coming from Moldavia and Wallachia were used to accelerate the Rumanianization of certain municipalities in Northern Transylvania (Kolozsvár, Nagyvárad). Aside from the massive influx of Rumanians, the rapid process of decline in the number of ethnic minorities in Transylvania was the result of their increased emigration. While there was an annual emigration between 1956 and 1975 of 2,000-3,000 Germans and a maximum 1,000 Hungarians within the framework of family unification, 389,000 people (215,000 Germans, 64,000 Hungarians, 6,000 Jews and 5,000 others) left Transylvania between 1975 and the 1992 census 49. The annual number of German emigrants - according to the agreement concluded in 1978 between German chancellor H. Schmidt and Rumanian president N. Ceauşescu, was fixed at between 10 and 14,000 annually 50. In the same period the number of Hungarians leaving the region rose from 1,058 in 1979 to 4,144 in 1986 and 11,728 in 1989, in parallel with the gradual deterioration of the economic and political situation. As a result of the exodus which started with the collapse of the Ceauşescu regime, 60,072 Germans, 23,888 Rumanians and 11,040 Hungarians abandoned Rumania in 1990 alone. Out of the 96,929 persons that had left the country, 83,512 (86.2 %) were from Transylvania. The influencing factors were the higher living standards abroad and a hope for a better future for their children, together with a shattered confidence in Rumania and an open burst of nationalism 51. This wave of emigration has recently diminished and stabilised at a national rate of 20,000 annually 52. Massive migrations in different directions which took place over the past four decades, especially the internal shifts caused by socialist urbanisation, that is, from rural 48 Varga E. Á Limbă maternă, nationalitate, confesiune. Date statistice privind Transilvania în perioada in: Fizionomia etnică şi confesională fluctuantă a regiunii Carpato-Balcanice şi a Transilvaniei, Asocia ia Culturală Haáz Rezső, Odorheiu Secuiesc, 111.p ,553 persons emigrated from Romania between (of them 235,744 were Germans, 171,770 Rumanians, 64,887 Hungarians, 21,006 Jews and 10,146 people of other ethnicities) (Anuarul Statistic al României 1993, 143.p.). 50 Anuarul , ibid. 143.p., Schreiber, W Demographische Entwicklungen bei den Rumäniendeutschen Südosteuropa Mitteilungen 33.Jg. Nr p. 51 Schreiber, W ibid. 209.p. 52 Number of emigrants from Rumania. Germans: 1991: , 1992: 8.852, 1995: 2.906, Hungarians 1991: 7.494, 1992: 3.523, 1995: (Anuarul Statistic al României 1996, 133.p.). Ratio of Transylvanians within Rumanian emigrants dropped between from 76% to 64.4%. 123
125 to urban settlements, resulted in a population growth in Transylvanian cities and towns from 2,1 to 4,4 million, while the population of villages dropped from 4,1 to 3,3 million between 1956 and In rural areas, due to the exodus of Germans, all of the three present-day dominant ethnic groups (Rumanians, Hungarians and Gypsies) were able to increase their proportion 53. However, in the centres of the settlement system and governmental power, focuses of Rumanianization, the number and proportion of Rumanians rose considerably (1956: 1,2 million, i.e. 58.1%; 1992: 3,3 million, 75.6% in urban settlements). During this period eight towns with a majority Hungarian population and one with a German majority (Zsombolya in 1990), turned into settlements with Rumanian majority. As a result of the accelerated population growth, dictated by party resolutions and implemented through the resettlement of people from Rumanian villages in Transylvania and Moldavia, Wallachia, the following formerly Hungarian towns turned into ones with a Rumanian population majority (over 50 %): Kolozsvár in 1957, Zilah in 1959, Balánbánya and Szászrégen in 1969, Nagyvárad in 1971, Bánffyhunyad in 1972, Szatmárnémeti in 1973 and Élesd in Relatively rapid and profound social changes took place in urban settlements of Transylvania. Groups of different social structure and behaviour, ethnic and religious affiliation were mixed together and later, a total ruralization of towns increased the danger of emerging ethnic conflicts in the largest of them. Similar transformations took place at the expense of ethnic minorities in the rapidly growing suburbs of big cities (e.g. Arad, Temesvár, Kolozsvár, Marosvásárhely and Brassó). But the local society of the rural areas beeing in unfavourable traffic situation could protect or even strengthen its original ethnic character due to the increasing emigration, aging and natural decrease of the population. Such Hungarian villages exist in most parts of the Székely Region, Küküllő Hills, Mezőség region, Szilágy and in more remote parts along the Hungarian-Rumanian border. At the same time, independent of natural and other demographic factors, a dissimilation of Swabians in Szatmár (previously almost completely Magyarized) and of many Hungarian speaking Gypsies, several settlements lost their former statistical majority. An ethnic group with the highest birthrate in Transylvania, the Gypsies (Romas) have been able to substantially increase their local proportion in their traditional ethnic territory: in Bihar, Szatmár, Szilágy, Kolozs, Maros, Szeben and Brassó counties and in villages of the Olt- Maros Interfluve abandoned by the Saxons. This resulted from a high natural increase, a strengthened awareness, and a gradual dissimilation from Rumanians and Hungarians. In certain regions of South Transylvania, however, a reverse ethnic process took place among the population of Gypsy native speakers: their massive return to the Rumanians 54. For the five years since the 1992 census, the population number of Transylvania declined to 7,6 million by 1 January, 1997 mainly due to natural 53 In the Transylvanian villages the proportion of Rumanians increased from 68.5 to 70.8%, that of Hungarians grew from 20.3 to 21.4%, and of Gypsies from 1.6 to 4%, while the proportion of Germans shrunk from 7.4 to 1.6% between Some examples of re-rumanization of Gypsies in the communes of Berény-Beriu, Tordos-Tordaş, Resinár-Răşinari, Nagycsűr-Şura Mare, Veresmart-Roşia, Bodola-Budila, Bölön-Belin etc. 124
126 decrease 55. Based on demographic trends and ethnic data of the 1992 census, 74.5 % of the population of Transylvania were officially Rumanians (5,670,000), 20.2 % of them Hungarians (1,540,000), and 2.7 % Gypsies (208,000). Our calculations based on the more likely number of Gypsies for 1992 (1,150,000), the ethnic composition of Transylvania at the beginning of 1997 was presumably as follows: 4,8 million Rumanians (63 %), 1,470,000 Hungarians (19.3 %), 1,150,000 Gypsies (15.1 %), 73,000 Germans (0.9 %) and 120,000 others (1.7 %). THE PRESENT TERRITORY OF HUNGARIAN SETTLEMENT IN TRANSYLVANIA According to the census carried out on 7 January 1992, the population of the Rumanian Banat, Kőrös-vidék - Crişana, Máramaros and the historical territory of Transylvania was found to be 7,759,466 (310,000 less than in the middle of 1989). Of these 5,7 million (73.6 %) declared themselves to be Rumanian, 1,6 million (20.7 %) Hungarian, 204,000 (2.6 %) Gypsy (Roma), and 109,000 (1.4 %) German. There were 50,000 Ukrainians, 28,000 Serbs, 19,000 Slovaks, 8,000 Bulgarians, 7,000 Croats, and 5,000 Czechs 56. As a consequence of the above outlined migrations and demographic processes which took place during the 20 th century, the ethnic picture of Transylvania has become simpler and less diverse at the expense of the national minorities and in favour of the Rumanians, and with the ethnic expansion of Gypsies, more colourful. In 1992 ethnic Hungarians numbered 1,604,000 while 1,620,000 regard Hungarian as their mother tongue. They formed a population majority in Hargita and Kovászna counties and in four municipalities (Marosvásárhely, Csíkszereda, Székelyudvarhely, Sepsiszentgyörgy), as well as in 14 other Transylvanian towns (9 in the Székely Region) and in 795 villages (Tabs. 23., 24., Figs. 30., 31.). 56 % were urban dwellers, while those living in settlements with a population of over 100,000 represented 20.4 %. Their proportion in middle-sized towns with 20, ,000 inhabitants ( Our estimations as to January 1, 1997 are based on the results of the 1992 census, on the demographic data in the Statistical Yearbook of Rumania (1996), and a publication by V. Ghe ău (Costul în oameni al tranziţiei Adevărul, 7 februarie 1996, 3.p.). Since 1992, in Rumania in general and in Transylvania in particular the number of deaths has exceeded the number of births and the natural decrease reached -1,15 in Transylvania and -0,59 in the rest of Rumania. 56 Census data were calculated by the author: Rumanians with Aromunians and Macedorumanians, Hungarians with Székelys and Csángós, Germans with Saxons and Swabians, Ukrainians with Ruthenians, Croats with Crashovans. On the territory of the Transylvanian counties the distribution of population according to mother tongue was as follows: 5,815,425 (75.3 %) Rumanians, 1,619,735 (21 %) Hungarians, 91,386 (1,2 %) Germans, 84,718 (1,1 %) Gypsies (Romas), 47,873 (0,6 %) Ukrainians, 31,684 Serbo-Croatians (0,4 %), 18,195 Slovaks, 7,302 Bulgarians, 3,934 Czechs. 125
127 Year Table 23. Change in the ethnic structure of population of selected counties of Transylvania ( ) Total population Rumanians Hungarians Germans Others number % number % number % number % number % SZATMÁR - SATU MARE county (megye - judeţ) , , , , , , , , , , , , , , , , , , , MÁRAMAROS MARAMUREŞ county (megye - judeţ) , , , , , , , , , , , , , , , , , , , , SZILÁGY - SĂLAJ county (megye - judeţ) , , , , , , , , , , , , , , , BIHAR - BIHOR county (megye - judeţ) , , , , , , , , , , , , , , , , , , , ARAD - ARAD county (megye - judeţ) , , , , , , , , , , , , , , , , , , , , TEMES - TIMIŞ county (megye - judeţ) , , , , , , , , , , , , , , , , , , , , KOLOZS - CLUJ county (megye - judeţ) , , , , , , , , , , , , , , , , , , , , MAROS - MUREŞ county (megye - judeţ) , , , , , , , , , , , , , , , , , , , , HARGITA - HARGHITA county (megye - judeţ) , , , , , , , , , , , , , , , ,
128 Table 23 (continued from page 120) KOVÁSZNA - COVASNA county (megye - judeţ) , , , , , , , , , , , , , , , BRASSÓ BRAŞOV county (megye - judeţ) , , , , , , , , , , , , , , , , , , , Sources: 1910: Hungarian census data (mother/native tongue), 1956: Rumanian census data (mother /native tongue), 1977, 1992: Rumanian census data (ethnicity). Remarks: Census data of 1910 and 1956 for the present territories of the counties were calculated by K.Kocsis. Rumanians with Aromunians and Macedorumanians; Hungarians with Székelys and Csángós; Germans with Saxons and Swabians. %) was similar to that of Rumanians, while Hungarians had above average representation in middle-sized and large villages with 1,000-5,000 people. 44 % of Hungarians lived in rural areas, mainly the Székely Region, Bihar and Szilágy; 56.9 % of Transylvanian Hungarians lived in settlements where they formed an absolute majority, 28 % of Hungarians were resident in settlements where their proportion was above 90 %, while 9.2 % of them are scattered and doomed to vanish and be assimilated (where their proportion is below 10 %). The most populous Hungarian communities - excluding Marosvásárhely - are to be found in towns (Kolozsvár, Nagyvárad, Szatmárnémeti), where the ratio of Hungarians has been reduced to a % minority over the past years (Tab. 25., Fig. 32.) % of Hungarians lived in the Székely Region, 31.2 % in the Kőrös-vidék Crişana region, 4.4 % in the Banat and 19.2 % in other counties of historic Transylvania. They have been able to maintain a relative homogeneity in only the ethnic territories of the Székely Region and North Bihar. In Szatmár and Szilágy counties Hungarians live mixed with Rumanians, Germans, Gypsies, and in other regions they form ethnic pockets of various sizes, or are scattered. 127
129 Table 24. The largest Hungarian communities in Transylvania (1956, 1986 and 1992; thousand persons) Kolozsvár / Cluj-Napoca 77,8 Kolozsvár / Cluj-Napoca 120,9 74,9 Nagyvárad / Oradea 62,8 Nagyvárad / Oradea 111,3 74,2 Marosvásárhely / Târgu Mureş 50,2 Marosvásárhely / Târgu Mureş 96,5 83,2 Arad / Arad 37,6 Szatmárnémeti /Satu Mare 69,3 53,9 Temesvár / Timişoara 36,5 Temesvár / Timişoara 65,2 31,8 Szatmárnémeti /Satu Mare 25,2 Brassó / Braşov 58,7 31,6 Brassó / Braşov 24,2 Arad / Arad 54,0 29,8 Nagybánya / Baia Mare 16,7 Sepsiszentgyörgy/Sfântu Gheorghe 51,4 50,0 Sepsiszentgyörgy/Sfântu Gheorghe 15,3 Nagybánya / Baia Mare 43,7 25,9 Székelyudvarhely / Odorheiu Sec. 13,6 Székelyudvarhely / Odorheiu Sec. 35,6 39,0 Nagyszalonta / Salonta 13,0 Csíkszereda / Miercurea Ciuc 35,4 38,0 Nagykároly / Carei 11,9 Kézdivásárhely/ Târgu Secuiesc 21,0 19,4 Csíkszereda / Miercurea Ciuc 11,2 Zilah / Zalău 20,3 13,6 Gyergyószentmiklós /Gheorgheni 11,1 Gyergyószentmiklós /Gheorgheni 19,3 18,9 Szászrégen / Reghin 10,0 Nagykároly / Carei 19,2 13,8 Sources: 1956: Rumanian census data (mother/native tongue), 1986: estimation of Kocsis, K. (Hungarian native speaker, see Kocsis, K. 1990), 1992: Rumanian census data (ethnicity). Table 25. Towns in Transylvania with absolute Hungarian majority (1992) Settlements Percentage of the Hungarians 1. Szentegyházas / Vlăhiţa Székelyudvarhely / Odorheiu Secuiesc Székelykeresztúr / Cristuru Secuiesc Barót / Baraolt Tusnádfürdõ / Băile Tuşnad Kézdivásárhely / Târgu Secuiesc Szováta / Sovata Gyergyószentmiklós / Gheorgheni Érmihályfalva / Valea lui Mihai Csíkszereda / Miercurea Ciuc Borszék / Borsec Sepsiszentgyörgy / Sfântu Gheorghe Kovászna / Covasna Szilágycseh / Cehu Silvaniei Nagyszalonta / Salonta Nagykároly / Carei Marosvásárhely / Târgu Mureş 51.6 Source: Final data of the Rumanian census of 1992 (ethnicity). 128
130 Figure 30. Ethnic map of Transylvania (1992) Source: Census
131 THE HUNGARIAN ETHNIC TERRITORY OF THE SZÉKELY REGION 57 More than one third of Hungarians in Transylvania live in the Székely Region. The survival of this almost compact Hungarian ethnic block is due partly to its autonomous status between the 13 th century and 1876, and to the mountainous surroundings which offered protection to its inhabitants during the great catastrophies and invasions of the 17 th century. 84,000 Hungarians live in Marosvásárhely, the ever expanding capital of Maros county. The Rumanian population in the city and its suburban communities is growing rapidly due to settlers mainly from Mezőség region and the region of the Küküllő rivers. As a result, their percentage is over 46 in the county seat. Despite the changes in the ethnic structure in urban areas, the borders of the Hungarian rural ethnic territory next to the Maros and Nyárád rivers extend along the Balavásár Lukafalva Mezőbánd Szabéd Mezőcsávás Beresztelke Magyarpéterlaka Nyárádremete lines. The most important centres of this Székely area apart from Marosvásárhely are Szováta, Erdőszentgyörgy, Nyárádszereda and Szászrégen, the town with a current Hungarian population of one-third. Although the Hungarian majority populated villages located to the north of Szászrégen in the Maros Valley and among the Rumanians of the Görgény district, they do not belong strictly to the Székely region, but they can be considered part of the compact ethnic Hungarian population of this area both ethnically and geographically (Marosfelfalu, Marosvécs, Holtmaros, Magyaró, Görgényüvegcsûr, Alsóbölkény, etc.). Travelling along the upper Maros passing through a few villages with Hungarian minority populations (Palotailva, Gödemesterháza, etc.) one reaches the Gyergyó Basin at Maroshévíz whose population is one-third Hungarian. In the Gyergyó region, the century-old Gyergyóremete-Ditró-Hágótőalja line continues to be the Hungarian-Rumanian ethnic border. The most important Hungarian settlements north of this border include the resort of Borszék with an 80 % Hungarian majority population, and Galócás, Salamás, Gyergyótölgyes and Gyergyóholló, all with Hungarian minority communities. The economic centre of the basin is Gyergyó-szentmiklós with a population of 18,888 Hungarians and 2,169 Rumanians. 57 Székely Region (Hungarian: Székelyföld; German: Szekerland; Rumanian: Pamîntul Secuilor; Latin: Terra Siculorum). An area populated since the 12 th century almost exclusively by Székely-Hungarians in the centre of present-day Rumania, bordered by the Eastern Carpathians. The clan division of this privilegized borderland was followed in the th century by the establishment of special territorial administrative units (Hungarian: "szék"), namely Marosszék, Csíkszék, Kászonszék, Udvarhelyszék, Sepsiszék, Kézdiszék and Orbaiszék. Due to the devastation of war, the mass immigration of the Rumanians and the shattering of the Hungarian ethnic territory in the Northwest and Central Transylvania during the 16 th and 17 th centuries, the direct ethnic-territorial connection between the Hungarian ethnic block of the Great Hungarian Plain and the Székely Region ceased. Since then the Székely ethnic block has become completely encircled by Rumanians. The special status of this region came to an end after the administrative reorganization of Hungary in The entire Székely ethnic block was formally united within the framework of an autonomous province of Rumania ("Hungarian Autonomous Province") only for a short period, between 1952 and
132 Figure 31. Percentage of ethnic Hungarians in the municipalities, towns and communes of Figure 32. Hungarian Transylvania communities (1992) in Transylvania (1992) Source: Census 1992 The route into the neighbouring Székely Basin of Csík leads through two Rumanian majority populated villages (Vasláb, Marosfő). Csíkszereda, the seat of the former Csík cunty and the present Hargita county, lies at the intersection of the road from Segesvár to Moldavia and the road along the River Olt. In 1948 the total population of Csíkszereda was only 6,000, whereas today there are already 45,769 inhabitants. Today, over 16% of the city or 7,488 people are Rumanian due to its central location and the immigration of Rumanians from Moldavia. Among the other larger settlements in Csík, it is worth mentioning two other towns, copper-producing Balánbánya with a 30% Hungarian, 70% Rumanian population, and the spa town of Tusnádfürdő with its two thousand Hungarian inhabitants (the smallest Transylvanian town). A few other villages are also important (Csíkszentdomokos, Csíkszépvíz, Mádéfalva, Csíkszentkirály, Csíkszenttamás etc.). Kászonaltíz is the most important settlement in the former Kászonszék district located in the basin between Csíkszék and Háromszék. 131
133 The former county of Udvarhely, was disbanded as a unit approximately four decades ago, and is now in the southwestern part of Hargita county. Székelyudvarhely, near to the size of Csíkszereda with 39,959 inhabitants and with 97.6 % ethnic Hungarians, is the capital of this most homogeneous part of the Székely Region. Outside of Székelyudvarhely, most of the jobs in this less urbanised region which is characterised by small settlements are provided by the agro-industry in Székelykeresztúr, the iron-ore industry, metallurgy in Szentegyházas, the ceramic industry of Korond and salt mining and refining in Parajd. The southernmost territory of the Székely Region is Kovászna county, formerly known as the region of Háromszék ( Three Districts ) composed of the subregions of Sepsi, Orbai and Kézdi. Sepsiszentgyörgy, with 67,220, inhabitants is the capital of Kovászna county and the second largest Székely town. Today, Hungarians comprise only three-quarters of this south Székely county seat. There is a significant percentage of ethnic Rumanians in Kovászna, Bereck, Kézdimartonos, Zabola and Zágon explained by their presence dating back to the middle ages up to the period of modern history. The following Hungarian villages in the Olt valley were never under the administration of any Székely district and do not currently belong to Kovászna county, yet they form an integral part of the Hungarian ethnic territory of the Székely Region: Apáca, Örményes, Alsórákos (with its basalt and limestone quarries) and Olthévíz (famous for its construction material industry). Based on the above, the Hungarian- Rumanian ethnic border in the southern Székely Region extends along the Újszékely- Székelyderzs-Homoródjánosfalva-Olthévíz-Apáca-Árapatak-Kökös-Zágon-Kommandó line. HUNGARIAN ETHNIC ENCLAVES IN HISTORICAL TRANSYLVANIA The regions with the most ancient Hungarian settlements in Transylvania are the Mezőség region and the area surrounding the Szamos rivers. The devastation of previous centuries hit these territories especially hard. Today, Hungarians inhabit only a few ethnic enclaves and numerous scattered communities. The most ethnic Hungarian settlements in the valley of the Big Szamos are Magyarnemegye, Várkudu, Bethlen, Felőr, Magyardécse, Árpástó, and Retteg, and those near the lower part of the Little Szamos include Dés, Désakna, Szamosújvár, Kérő, Bonchida, Válaszút and Kendilóna. In the Mezőség Region, located between the Maros and Szamos Rivers, Hungarian settlements include Mezőbodon, Mezőkeszü, Vajdakamarás, Visa, Szék, Zselyk, Vice, Ördöngősfüzes, Bálványosváralja, Szentmáté and Cegőtelke. The largest Hungarian community of Transylvania with thousand people live in Kolozsvár with a total population of 328,602, where the Little Szamos, Nádas creek and numerous national and international roads meet. The villages of the region of Kalotaszeg (Körösfő, Kalotaszentkirály, Magyarvalkó, Jákótelke, Bogártelke, Magyarvista, Méra etc.), one of the most important as regards Hungarian folk culture, are located west of Kolozsvár City considered to be the cultural capital of Hungarians 132
134 of Transylvania and near the upper part of the Nádas creek and the Sebes Körös. The ethnic Hungarian profile of the Kalotaszeg region s centre, Bánffyhunyad, has changed significantly due to the settlement of Rumanian highlanders from a broader periphery. Some Hungarian villages in the Erdőfelek Hills (Györgyfalva, Tordaszentlászló, Magyarléta, Magyarfenes, Szászlóna) provide a link between the Hungarians of the Kalotaszeg and Torda regions. In the former Székely district of Aranyosszék 58 and its surroundings, the percentage of Hungarians declined primarily in Székelykocsárd, Hadrév, Felvinc, Aranyosegerbegy and Szentmihály as a result of the increased settlement of Rumanians and the urbanisation of the Torda region and Maros valley. The highland villages, on the other hand, were able to preserve their Hungarian majorities (Torockó, Torockószentgyörgy, Kövend, Bágyon, Kercsed, etc.). Some of the most important factors in migration were the roads, railways and employment as well as commuting opportunities which reshaped or left untouched the ethnic composition of the Maros and Küküllő regions. Rumanians became a majority in settlements which formerly had a Hungarian majority along the nationally and regionally important roads and in the industrial centres, for example, Radnót, Marosludas, Marosugra, Marosújvár, Nagyenyed and Dicsőszentmárton. The former Hungarian character of small, deserted villages whose young populations emigrated, has remained or even intensified in certain places (Magyarbece, Magyarlapád, Nagymedvés, Magyarózd, Istvánháza, Csávás, etc.). A majority of ethnic Hungarians in the territory between the Little Küküllő and Olt inhabit larger industrial centres (Medgyes, Segesvár, Kiskapus, Nagyszeben) or remote villages (Halmágy, Kóbor, Dombos, Nagymoha, Sárpatak, Bürkös, etc.) and Vízakna. In Hunyad county, the Hungarians mostly inhabit towns in the Zsil valley (Petrozsény, Lupény, Vulkán, Petrilla), Vajdahunyad, Déva, Kalán and Piski. The few hundred descendants of the medieval Hungarians and the Székely-Hungarians from Bukovina who settled in this region at the turn of the century live mainly in Bácsi, Hosdát, Gyalár, Haró, Nagyrápolt, Lozsád, Csernakeresztúr and Rákosd in the last three villages as the absolute majority of the local population. Brassó, the largest city in Transylvania with a population of 323,736, is the main traditional urban centre of the Székelys aside from Marosvásárhely. For this reason, growth of the Hungarian population of the city has been uninterrupted since the Second World War (31,574 in 1992). Four Csángó-Hungarian 59 Rumanian villages of the 58 Aranyosszék ("Golden District"). A small Székely-Hungarian ethnographical, untill 1876 an administrative region including 22 settlements in West-Central Transylvania, between the towns of Torda and Nagyenyed. It was founded by the Hungarian King Stephen V with Székelys from Kézdiszék (today north of Covasna county) on the territory of the deserted royal estate of Torda, between 1264 and The historical seat of the Aranyosszék district was Felvinc (Rumanian: Unirea). 59 Csángó (Rumanian: Ceangău; German: Tschango): general name of the persons separated from the Székely-Hungarians, emigrated from the Székely Region. The Csángó Hungarian ethnographical group primarily includes Roman Catholic Hungarians in Moldavia, but also the Hungarians in the Upper-Tatros /Trotuş Valley around Gyímes /Ghimeş and the Hungarians in the Barcaság /Bîrsa /Burzenland region, west of Brassó City, the last two situated in the Eastern Carpathians. The number of the Csángós of Hungarian ethnic identity in Moldavia is decreasing due to intensive, forced Rumani- 133
135 city s suburbs (Bácsfalu, Türkös, Csernátfalu, Hosszúfalu) were united under the name of Szecseleváros, where the percentage of Hungarians has dropped to 27.2 due to an influx of Rumanians who settled there after the establishment of the electrical industry. HUNGARIANS IN THE PARTIUM REGION 60 (ARAD, BIHAR, SZILÁGY, SZATMÁR AND MÁRAMAROS COUNTIES) The majority of the Hungarian national minority in the Partium region, estimated to be approximately 700,000 primarily inhabit cities along the main traffic routes on the periphery of the Great Hungarian Plain, approximately 40 kilometres from the Hungarian-Rumanian border. More than half of the ethnic Hungarians of the overwhelmingly Rumanian Máramaros county live as a % minority in Nagybánya, the county seat, famous for its non-ferrous metal processing plants. Hungarians also comprise a similar proportion (20-30 %) in the other towns of the county (Felsőbánya, Kapnikbánya, Máramarossziget, Szinérváralja), with the exception of Borsa, Magyarlápos and Felsővisó. Important Hungarian communities can be found in some villages located near the periphery (Rónaszék, Aknasugatag, Hosszúmező, Kistécső, Domonkos, Erzsébetbánya, Magyarberkesz, Koltó, Katalin, Monó, Szamosardó etc.). Due to the attractions of Kolozsvár, Nagyvárad, Szatmárnémeti and Nagybánya, the Szilágyság region was not the destination of large numbers of immigrants, also because of unfavourable local potentials for economic development. In fact, this county in Transylvania became one of those with the largest number of people leaving it. This situation led to the relative stability of the ethnic structure in villages. The large degree of migration within the Szilágyság region led to a decline in the percentage of the Hungarian population in towns especially Zilah, Szilágysomlyó or Szilágycseh. Hungarians became a minority in the first two of the above-mentioned towns. The largest Hungarian communities of the county live in Zilah (13,638), Szilágysomlyó (4,886), Kraszna (3,936), Sarmaság (3,829), Szilágycseh (3,774), Szilágynagyfalu (2,404) and Szilágyperecsen (2,259). zation (1930: 20,964; 1992: 6,514). The number of Roman Catholics in Moldavia exceeded the 184,000 in 1992 (untill the end of the 19 th century they were predominantly Hungarian speaking). Similarly to the predominantly English speaking and Roman Catholic Irish in Ireland, only some of the Csángós, from among the Moldavian Roman Catholics of ethnic Hungarian origin can be counted as Hungarian native speakers (c. 50,000). They live mostly around the towns of Bákó /Bacău and Roman, in the Szeret /Siret river valley. 60 Partium (Hungarian: "Részek", English: "Parts"). As a geographical collective term this included the territories of the Principality of Transylvania outside mostly west of historic Transylvania (Máramaros, Kővárvidék, Közép-Szolnok, Kraszna, Bihar, Zaránd and Szörény counties) in the 16 th and 17 th centuries. Nowadays it is often used by Hungarians to represent the former Hungarian territories annexed to Rumania in 1920 apart from historic Transylvania and Banat: the present-day Rumanian counties of Arad, Bihar, Szilágy, Szatmár and Máramaros or the former Rumanian provinces of Crişana and Maramureş. 134
136 Following the land reform, the Rumanian colonies established between the two world wars (Decebal, Traian, Dacia, Paulian, Lucăceni, Aliza, Gelu, Baba Novac, Crişeni, Horea, Scărişoara Nouă, etc.) and the villages with a population of Swabian origin (e.g. Béltek, Mezőfény, Mezőterem, Csanálos, Nagymajtény) disrupted the previous homogeneity of Szatmár county s Hungarian ethnic territory along the Rumanian-Hungarian border. In 1941 there was a % majority Hungarian population in the new county seat of Szatmárnémeti and the old county seat of Nagykároly. This dropped according to Rumanian statistics, to % by 1992, despite the significant rise in the birthrate. In addition to the above-mentioned towns, a significant number of Hungarians can be found in Tasnád, Mezőpetri, Szaniszló, Kaplony, Börvely, Erdőd, Béltek, Bogdánd, Hadad, Szatmárhegy, Lázári, Batiz, Sárköz, Halmi, Kökényesd, Túrterebes and Avasújváros. The third largest Hungarian community in Transylvania with 74,228 people is in Nagyvárad, the seat of Bihar county, where Hungarians currently number 33.3 %, according to the 1992 Rumanian census. The compact ethnic Hungarian population of Bihar is located north of the county s capital and west of the Fugyivásárhely Szalárd Szentjobb Micske Margitta line. Among the notable local centres in this area, Margitta, Érmihályfalva, Székelyhíd, Bihardiószeg and Bihar are worth mentioning. Important medieval language enclaves continue to preserve Hungarian culture in the upper regions of the Berettyó and Sebes/Rapid Körös rivers (Berettyószéplak, Bályok, Mezőtelegd, Pusztaújlak, Pósalaka, Örvénd, Mezőtelki, Élesd, Rév etc.). In Southern Bihar, the majority Hungarian populated territories have shrunk over the last three centuries to the environs of Nagyszalonta, Tenke and Belényes (Árpád, Erdőgyarak, Mezőbaj, Bélfenyér, Gyanta, Köröstárkány, Kisnyégerfalva, Várasfenes, Körösjánosfalva, Belényessonkolyos, and Belényesújlak). Of the above-listed settlements, Tenke, Körösjánosfalva and Belényessonkolyos have already lost their Hungarian majority due to an influx of Rumanians as well as natural assimilation. More than half of the Hungarians of Arad county live in the county seat. Arad has 29,832 Hungarians and the rest live primarily in the environs of Arad and Kisjenő. Among these, the largest Hungarian population can be found in Magyarpécska (now united with the mainly Rumanian and Gypsy inhabited Ópécska), Kisjenő, Kisiratos, Nagyiratos, Borosjenő, Pankota, Nagyzerénd, Simonyifalva, Ágya, Zimándújfalu and Kispereg. HUNGARIAN ETHNIC ENCLAVES IN THE BÁNÁT The total number of Hungarians living in the rural ethnic enclaves and urban diaspora of the Bánát is estimated to be approximately 90,000 (1992 census data: 70,772 ethnic Hungarians). This number has stagnated due to the movement of Hungarians (mainly Székelys) from other Transylvanian territories to Temesvár, Resica and other industrial centres thereby evening out the natural decrease of the population and assimilation. Due to this, as well as to the increasing regional concentration of 135
137 Hungarians in the Bánát, 45% of Hungarians in this region claim to be from Temesvár City. In addition to inhabiting this city of 334,115 people, important numbers and percentages of ethnic Hungarians live only in around 30 settlements, for example, Pusztakeresztúr, Porgány, Nagyszentmiklós and Majláthfalva in the northwest, Nagybodófalva, Szapáryfalva, Igazfalva, Nőrincse, Vásáros and Kisszécsény in the northeast, and Dézsánfalva, Omor, Detta, Gátalja, Végvár, Ötvösd, Józsefszállás, Torontálkeresztes and Magyarszentmárton in the south. In the Temesvár agglomeration, the percentage of Hungarians has drastically decreased in the formerly majority Hungarian populated settlements of Győröd, Újmosnica, Magyarmedves and Újszentes due to considerable immigration of Rumanians and the natural decrease of local Hungarians. 136
138 Chapter 5 THE HUNGARIANS OF VOJVODINA The southernmost area of Hungarian settlement in the Carpathian Basin can be found in Vojvodina 1. At the time of the last Yugoslav census in 1991, 339,491 people declared themselves to be ethnic Hungarian in Vojvodina. This Hungarian minority makes up 2.6% of Hungarians living in the Carpathian Basin and 12.5 % of Hungarians living outside the borders of Hungary. Due to an exceptionally adverse history, the Hungarians inhabiting the broad area of the Danube and Tisza river valleys preserve Hungarian culture in compact ethnic blocks of varying size as well as in ethnic enclaves. THE NATURAL ENVIRONMENT The Vojvodina Hungarians inhabit the southern part of the Great Hungarian Plain, referred to in Yugoslavia as the Pannonian Plain (Fig. 33.). This flatland territory with the exception of the alluvial soil of the river regions, the brown forest soil of the Fruška Gora (Péterváradi) Mountains, and the meadow soils and the ameliorated peats of the Bánát is covered to a great extent with chernozem. Having some of Europe's best agricultural land and most favourable climates, the quantity and quality of wheat and corn yields are outstanding in this region. As a result, Vojvodina plays a determining role in Serbia's food supply. Extensions of the monotonous flatlands include the Fruška Gora (Péterváradi) Mountains (538 metres) famous for their vineyards, the Versec Mountains (640 meters), the loess plateau of Bácska (Telecska) and the Titel Plateau (128 metres) and the Deliblát sand hills (250 metres). There has been a long tradition of controlling rivers in Bácska and Bánát, for example, by draining the Versec- Alibunár marshland. The enormous canal projects of the last few decades, including the construction of the navigable Danube-Tisza-Danube canal between Bezdán-Óbecse- Palánka, aimed to provide uninterrupted irrigation of the extremely important Vojvodina agricultural land. The major rivers of the lowland regions inhabited by Hungarians are the tributaries of the Danube - the Száva, Temes and Tisza all of which flow directly 1 Vojvodina ("Voivodship", Hungarian: Vajdaság). Province in Federal Republic of Yugoslavia, and in Serbia, north of the Sava and Danube rivers. Territory: 21,506 square kilometres, population number: 2 millions, capital: Újvidék /180,000 inhabitants/. Between the 10 th century and 1918 a part of South Hungary, since then a part of Yugoslavia, between 1945 and 1989 as an autonomous province of Serbia. Its only historical precedent was the province "Serbian Voivodship and Bánát of Temesvár" created, separated from Hungary (1849), repealed (1860) by Habsburg absolutism as part of its revenge for the Hungarian War of Independence of
139 Figure 33. Important Hungarian geographical names in Vojvodina into the Danube. The most important still waters for Hungarians include the Palics and Ludas Lakes near Szabadka and the Fehér /White/ Lake near Nagybecskerek. ETHNIC PROCESSES DURING THE PAST FIVE HUNDRED YEARS During medieval times the southern Hungarian ethnic area also became increasingly homogeneous and larger (Fig. 34.). Ethnic processes favourable to the Hungarians, slowed down from the late 14 th century, when a continuous, never-ending stream of Serbs fled to southern Hungary (mostly to Syrmia-Szerémség and South Bánát), following catastrophic defeats suffered at the hands of the Ottoman-Turks (e.g battle in Kosovo Polje). Serb immigration escalated after 1459 (the fall of the Serbian capital Smederevo), and the Ottoman conquest of Serbia. As a result of this, the majority of the population in the southern Hungarian territories, primarily Syrmia 138
 region, which became a permanent seat of operations and was abandoned by the local")
140 Figure 34. Change in the ethnic territory of Hungarians on the present-day territory of Vojvodina (11 th 20 th century) region, which became a permanent seat of operations and was abandoned by the local Catholic Hungarian population, counted as orthodox Serbs. Not only the Turkish devastation, but serious Hungarian ethnic-demographical losses and the casualties during the Peasant War of G. Dózsa contributed to the immigration of Serbian refugees (1514) 2. In the second half of the 15 th century the most important centres of the Hungarian settlement network on the territory of present-day Vojvodina were in the Bácska region: Szabadka, Tavankút, Coborszentmihály (today Zombor), Apáti (today Apatin), Bodrog (today Monostorszeg), Bács, Pest (today Bácspalánka), Futak, Vásárosvárad (today Újvidék), Titel, Becse, Zenta, in the Bánát region: Kanizsa, Basahida, Aracs, Becskerek, 104.p. 2 Popović, D. J Srbi u Vojvodini (Serbs in Vojvodina) I. Matica Srpska, Novi Sad, 139
141 Pancsal (today Pancsova), Keve (today Kevevára), Érdsomlyó (today Versec), and in the Syrmia-Szerémség region: Csörög (today Čerević), Bánmonostor (today Banoštor), Pétervárad and Karom (today Karlóca) 3. The total defeat of the Hungarian Royal Army at Mohács in 1526, and the events which followed, resulted in the dissolution of the medieval Hungarian state and its ethnic structure. Because of the permanent Ottoman (Turkish) occupation and the devastation by Serbian troops under J. Crni (Nenad) in 1527, the majority of southern Hungarian territories lost their Hungarian populations for more than two centuries, Syrmia in 1526, Bácska in 1541 and West Bánát in On the territory of present-day Vojvodina next to the ruins of about 600 burnt down and deserted Hungarian settlements, Serbian colonies developed which were suited to the state of war and to the way of life (military service, semi-nomadic stock-breeding) of the immigrant Serbs. At the same time, Muslims (Turks, Bosnians), Serbian soldiers and in some places Greeks, Gypsies and Jews settled in the restored, important towns and castles 4. This ethnic pattern had developed by the late 16 th century and was characterised by Serbian ethnic dominance which remained unchanged untill the collapse of Ottoman power. Bácska and the greater part of Syrmia were liberated from Ottoman rule following the peace treaty of Karlóca (1699). Important changes had taken place in the ethnic-religious structure of the population since The Muslims (Turks and the Muslimized Slavs and Hungarians) fled to Bosnia from Hungarian territories liberated by the Christian troops. Later, the Catholic Shokats and Bunjevats from Bosnia and Hercegovina fled to southern Hungary, mostly to the present territory of Vojvodina. Following the fall of Belgrade (1690) tens of thousands of Serbian families, under the leadership of patriarch Arsenije III Crnojević ( ), took refuge in Hungary, where the Austrian Emperor Leopold I assured them wide political and religious autonomy in exchange for fighting against the enemies (Turks, Hungarians) of the Habsburg Imperial Court. The majority of them settled in the newly organized Military Border along the Maros, Tisza, Danube and Száva rivers. Following the defeat of the anti-habsburg Hungarian War of Independence ( ) lead by F. Rákóczi and the reannexing of Bánát in the peace-treaty of Požarevac (1718), a census of the taxpaying population was organised in Hungary (1720). Of the 3,111 taxpaying households in Bácska 97.6 % were Serbian and Croatian, 1.9 % Hungarian and 0.5 % German 5. At the same time in Bánát and Syrmia the Hungarians were almost totally absent. In these border regions during the first half of the 18 th century the Imperial Court, primarily the Imperial War Council in Vienna, prevented the return of Hungarians, who were regarded as politically 'unreliable'. During this period for economic and political reasons tens of thousands of Catholics, 3 Csánki D Magyarország történelmi földrajza a Hunyadiak korában (Historic Geography of Hungary in 15 th century) I-V., Budapest 4 Nyigri I A visszatért Délvidék nemzetiségi képe (Ethnic Patterns in the Returned Southern Region) - in: A visszatért Délvidék, Halász, Budapest, pp , Popović, D. J ibid. 5 Acsády I Magyarország népessége a Pragmatica Sanctio korában (Population of Hungary ). Magyar Statisztikai Közlemények XII. Budapest, 288p. 140
142 mostly from southern Germany, were settled in the war-stricken, almost deserted and agriculturally uncultivated Bácska and Bánát. The majority of the economically very 'useful' and politically reliable German population were settled in west-southwest Bácska and South Bánát. The mass return of Hungarians to historical southern Hungary was only allowed after the accession of Maria Theresia to the throne (1740). The first important Hungarian colonies were established in the non-military part of Bácska during the gradual dismantling of the Military Border of Tisza - Maros which lost its military importance ( ): Nemesmilitics, Bezdán, Kula, Bácstopolya etc. The majority of Serbs from the old Military Border of Tisza who were used to military service and to independence from the Hungarian authorities, migrated to the south-east corner of Bácska, to the Military District of Sajkás and to the west of Bánát, to the autonomous Serbian District of Nagykikinda. Between 1750 and 1770 the Hungarians returned from the Jász and Kun districts, from Csongrád county and Transdanubia (Dunántúl) to the deserted regions of Bácska, partly taking the place of the Serbs in Doroszló, Bácstopolya, Bajsa, Ada, Mohol, Magyarkanizsa, Zenta, Szabadka, Bajmok, Csantavér, Péterréve, Bácsföldvár etc 6. Due to this Hungarian migration the population number of Szabadka increased 5-fold, to 10,000 between In this period the Hungarian ethnic block of the Szabadka - Tisza Region was formed between the German ethnic area in W-Bácska and the Serbian districts of Sajkás and Nagykikinda. During the reign of Maria Theresia mass German immigration supported by the state continued and was accompanied by the immigration of the Slovaks, Ruthenians and Rumanians. The characteristic ethnic-religious character and diversity of the territory of present-day Vojvodina was formed in the second half of the 18 th century. The mass return of Hungarians to the present Serbian part of the Bánát region was due to the expansion of the tobacco-growing from Szeged area, famous in the 18 th century. Thousands of Hungarian tobacco growers settled on the large estates of Bánát between 1773 and 1810 in the areas between the Serbian District of Nagykikinda and the Military Border of Bánát: e.g. Magyarmajdány, Törökkanizsa, Csóka, Oroszlámos, Szaján 7. The colonization policy during the reign of Joseph II ( ) was characterised by predominantly German immigration, but at that time the settlement of Protestants, for example Calvinist Hungarians, was also made possible (e.g. in Bácsfeketehegy, Bácskossuthfalva, Pacsér, Piros). Later, between the settlement of Hungarians in the Bánát area increased with the immigration of Hungarian tobacco gardeners from Csongrád and Csanád counties from Magyarszentmihály, Tamásfalva, Ürményháza etc. 6 Bodor A Délmagyarországi telepítések története és hatása a mai közállapotokra (History of the Colonizations in South Hungary and their Effects on the Present Situation), Stephanum, Budapest, 14.p. 7 Banner J Szegedi telepítések Délmagyarországon (Colonizations from the Szeged region in South Hungary), Földrajzi Közlemények, LIII, pp
143 The proclamation of a Serbian Vojvodina independent from the Hungarian Kingdom was made in Karlóca on May 13, During the time of the Hungarian War of Independence ( ), Serbian troops burnt down the majority of Hungarian and some German settlements, and expelled their populations (e.g. Temerin, Bácsföldvár, Zenta, Magyarkanizsa, Versec, Fehértemplom) following battles between the Hungarian Army and local and foreign Serbian troops. A significant number of Hungarian refugees from Bácska fled to Szabadka. As a result of this migration, the Austrian census of 1850 in Szabadka recorded nearly 30,000 (about 61 % of the total population of 48,823) Hungarians. Later, the Hungarian refugees returned to their original settlements in Bácska, where the number of Hungarians grew steadily due to the increasing north-south migration, motivated by economic and demographic considerations. The first Hungarian census enquiring into linguistic (mother tongue) affiliation was carried out at the end of 1880 following the Austro-Hungarian Compromise (1867). At that time, of the 1.2 million inhabitants living on the territory of present-day Vojvodina, 35.5 % was Serbian, 24.4 % German, 22.6 % Hungarian and 6.2 % Croatian according to their mother tongue (Tab. 26.) 8. According to this census data, outside the Hungarian ethnic block of the Szabadka - Tisza Region, where 56 % of the Hungarians of the region concentrated, Hungarians represented the majority of the population in 27 settlements (Bácska 7, Bánát 19, Syrmia 1). After 1880, as a result of growing economic development, sanitary conditions primarily in the German and Hungarian settlements improved rapidly. As a consequence, mortality gradually decreased and the natality grew significantly among the Hungarians of the Great Hungarian Plain. Between 1901 and 1910 the natural increase in settlements with a Hungarian majority - excluding Szabadka - on the territory of present-day Vojvodina, was 14.1 % (Germans: 13.6%, Serbs: 10.9%). This Hungarian population growth caused many social problems (division of the land, impoverishment, unemployment etc) mainly on the Great Hungarian Plain. It was alleviated by the partial division of government estates and by establishing colonies. But this government-organized settlement policy between 1883 and 1899 was small scale, and affected not only ethnic Hungarians, but also Germans, Slovaks and Bulgarians and did not result in any major change in the ethnic structure of the region. During this period some of the Hungarians from Bukovina settled along the Danube (Székelykeve, Sándoregyháza, Hertelendyfalva). At the turn of the century, the number of ethnic Hungarians increased significantly not only in the bigger towns (Újvidék, Szabadka, Nagybecskerek, Pancsova, Versec etc), but on the farms of the large estates (e.g. the Csekonits, Karátsonyi, Pejacsevich and Kotek families) and in certain industrial 8 Data of the 1880 census as in the case of the censuses of 1890, 1900 and 1910 are calculated on the present territory of Vojvodina including the data of the present-day Kelebia, Tompa and Csikéria settlements of Hungary which belonged to Szabadka City till the peace-treaty of Trianon (1920). In the calculation of persons in the so-called 'beszélni nem tud / can not speak' statistical category, they were was proportionally divided between the linguistic-ethnic groups. Those in the Serbo-Croatian linguistic category were divided on the basis of their religious affiliation between the Orthodox Serbs and Catholic Croats. 142
144 centres (Beočin, Vrdnik) (Tab. 27.). Mainly as a result of the mass exodus of the population from the Hungarian ethnic block, the number of Hungarians in south-east 143
145 Table 26. Ethnic structure of the population of the present territory of Vojvodina ( ) Sources: 1880, 1890, 1900, 1910, 1941: Hungarian census data (mother/native tongue), 1921, 1931: Yugoslav census data (mother /native tongue), 1948, 1953, 1961, 1971, 1981, 1991: Yugoslav census data (ethnicity), 1941: combined Hungarian (in Bácska 1941) and Yugoslav (in Banat and Syrmia/ Szerémség/ Srem 1931) census data. 1996: estimation of K. Kocsis based on "Census of Refugees..., Belgrade, Remarks: Data between 1880 and 1910 include the settlements of Tompa, Kelebia, Csikéria of the present-day Republic Hungary at that time belonging to the administrative area of Szabadka/Subotica City. The Croats include the Bunyevats, Shokats and Dalmatinian ethnic groups and the Serbs of Roman Catholic religious affiliation in Year Total population Serbs Hungarians Germans Croats Montenegrins Slovaks Rumanians Ruthenians, Ukrainians number number % number % number % number % number % number % number % numb. % number % ,172, , , , , , , , , ,331,143 45, , , , , , , , ,432, , , , , , , , , ,512, , , , , , , , , ,528, , , , , , , , , ,624, , , , , , ,636, , , , , , ,640, , , , , , , , , , ,701, , , , , , , , , ,854,965 1,017, , , , , , , ,952,533 1,089, , , , , , , , , ,034,772 1,107, , , , , , , , , ,013,889 1,143, , , , , , , , , ,213,000 1,422, , , , , , , , , Others
146 Table 27. Change in the ethnic structure of selected Year Total population Serbs Hungarians Germans Others number % number % number % number % number % Újvidék - Novi Sad , , , , , , , , , , , , , , , , , , , , , , , , , , , , , , , , , , , , , , , , , Szabadka - Subotica , , , , , , , , , , , , , , , , , , , , , , , , , , , , , , , , , , , , , , , , Zombor - Sombor , , , , , , , , , , , , , , , , , , , , , , , , , , , , , , , , , , , , , , , , Temerin - Temerin , , , , , , , , , , , , , , , , , , , , , , , , , , Bácstopolya - Bačka Topola , , , , , , , , , , , , , , , , , , , , , , , , , , , Sources: 1880, 1910, 1941: Hungarian census data (mother/native tongue), 1921, 1931: Yugoslav census data (mother /native tongue), : Yugoslav census data (ethnicity).
147 cities and towns of Vojvodina ( ) Year Total population Serbs Hungarians Germans Others number % number % number % number % number % Magyarkanizsa - Kanjiža , , , , , , , , , , , , , , , , , , , , Zenta Senta , , , , , , , , , , , , , , , , , , , , , , , , , , , , , , , Óbecse - Bečej , , , , , , , , , , , , , , , , , , , , , , , , , , , , , , Törökbecse - Novi Bečej , , , , , , , , , , , , , , , , , , , , , , , , , , , , , Nagybecskerek - Zrenjanin , , , , , , , , , , , , , , , , , , , , , , , , , , , , , , , , , , , , , , , Remark: All data were calculated for the present administrative territory of the cities and towns excluding Szabadka ( ), Zenta, Bácstopolya and Magyarkanizsa ( ).
148 Bácska increased by 66.3 % between 1880 and 1910, by 82.3 % in Central and South Bánát, and by 130 % in Syrmia. The present Hungarian ethnic enclaves of Syrmia (Satrinca, Maradék, Herkóca, Nyékica etc) were formed following Hungarian emigration from Bácska (e.g. Kishegyes, Temerin, Mohol and Kula). Emigration may have played an important role in the change of the population. Between 1899 and 1913 about 150,000 people migrated from the present area of Vojvodina (mostly from the Bánát). 53 % out of them counted as German, 18 % as Serbian and 10 % as Hungarian 9. The rapid growth of native Hungarian speakers was also contributed to by natural assimilation, a change in language use and ethnic identity, and voluntary Magyarization. The effect of these processes was especially noticeable among Germans, Bunjevats, Jews and Serbs living in towns, first of all in Újvidék, Nagybecskerek, Zombor, Szabadka, Pancsova and Versec. The last Hungarian census was carried out in the whole area of the present-day Vojvodina in At that time 28.1 % of the 1.5 million inhabitants of the region declared themselves to be Hungarian, 33.8 % Serbian, 21.4 % German and 6 % Croatian, Bunjevats and Shokats native speakers. At this census the Hungarian ethnic territory was at its largest since the middle of the 16 th century. Outside their ethnic block along the Tisza river, Hungarians represented an absolute or relative majority of the local population in the area of 53 present-day settlements, also in Újvidék and Nagybecskerek (Fig. 35.). In 1910 the largest Hungarian communities were concentrated in the triangle of Újvidék - Szabadka - Magyarkanizsa. At the end of the First World War, following the liberation of Serbia and Montenegro, until November 14, 1918, the Serbian troops supported by the Entente occupied the southern Hungarian territories till the line of Barcs-Pécs-Baja-Szeged- Arad. This military action was seen as occupation by 60.8 % of the population (Hungarians, Germans, Bunjevats) of the later Yugoslav parts of Baranya, Bácska and Bánát and as liberation by the Serbs (28 %). This Serbian minority announced the annexation of Bácska, Bánát and Baranya to Serbia on November 25, 1918 behind the front line in Újvidék, to legitimise the presence of the Serbian Royal Army. The Serbian authorities immediately started to liquidate Hungarian state authority there and to ruin the local Hungarians both politically and economically. Power was given to the local Serbian minority while the majority of Hungarian public employees were dismissed or forced to retire, and schools were nationalised by Serbia (August 20, 1920). On February 25, 1919 Serbia started to expropriate the majority of large landed estates of over 500 cadastral acres a little later, of over 100 cadastral acres predominantly in Hungarian and German hands. This measure called 'agrarian reform' served both ethnic and social aims: to ruin the class of large Hungarian landowners, indirectly to ruin Hungarian peasants and workers, and to satisfy Serbian generally South Slavian claims for land % out of the large private estates selected for expropriation were 9 Maletić, M. (Ed.) 1968 Vojvodina. Znamenitosti i lepote (Places of interests), Književne Novine, Beograd, 104.p. 147
149 Figure 35. Ethnic map of the present-day territory of Vojvodina (1910) Source: Census 1910 Hungarian, 36.3 % German, Jewish or Italian 10. In spite of the fact that early in 1919 from 57,631 landless peasants of Bácska 41.4 % were Hungarian and 18.2 % were German, these ethnic groups, considered as enemies, were almost totally omitted from the redistribution of land. This included the farms of expropriated estates, and according to our calculations, 14,345 Hungarian and 1,239 German workers and farmhands were expelled to make room for Serbian colonists and volunteers (dobrovoljci) (Fig. 36.). The peace-treaty of Trianon (June 4, 1920) took place under these circumstances, and 8,558 km² from the Hungarian Bács-Bodrog County were annexed to the Kingdom of Serbs- Croats and Slovenes, and 9,324 km² from Bánát (e.g. Torontál and Temes counties). The first census of the new South Slavian state was carried out on January 31, According to the data, 363,450 (23.8 %) of the 1.5 million inhabitants of presentday Vojvodina were registered as Hungarian, 34.9% as Orthodox and 8.5 % as Catholic 10 Kecić, D Revolucionarni radnički pokret u Vojvodini (Revolutionary workers movement in Vojvodina) , Institut za Izučavanje Istorije Vojvodine, Novi Sad 148
150 Figure 36. Serbian (Yugoslav) colonization in Vojvodina ( ) Serbo-Croatian native speakers 11. Due to the Hungarian-Serbian take-over in 1918, the statistically registered number of the Hungarians had extraordinarily decreased by the census of At this time according to our calculations out of the persons who declared themselves in 1910 as Hungarian native speakers in the new, anti-hungarian situation, about 52,000 inhabitants declared themselves or were registered without asking on the base of the 'surname analysis order of Svetozar Pribičević' 12 as non- 11 From the official census data of 1921 relating to Horgos (today in Kanjiža Commune), we have subtracted 7551 Hungarian inhabitants of the present-day settlements of Röszke, Ásotthalom and Mórahalom in Hungary which were under Serbian occupation as a part of Horgos until 1923 (see Magyar Statisztikai Közlemények Vol. 83., 1932). The Serbo-Croatian linguistic category was divided on the basis of religious affiliation into Serbs and Croats. 12 According to this Serbian order it was not allowed for persons with a surname of linguistically non-completely Hungarian origin to declare themselves as ethnic Hungarian, e.g. at the census or at school registration (Kirilovič, D Asimilacioni uspesi madjara u Bačkoj, Banatu i 149
151 Hungarians (12,330 as German, 32,620 as 'Catholic Serbo-Croatian' and 6,850 as other non-hungarian). As a result of these events according to the census the number of ethnic Hungarians was drastically reduced, primarily in Szabadka and Zombor, towns of the new border region (Fig. 37.). Similar to the above mentioned dissimilation, local Hungarians suffered heavy losses due to the escape, expulsion or repatriation of about 33,000 Hungarian employees, intellectuals and landowners 13. In the period between the censuses of 1921 and 1931 Yugoslav (Serbian) agrarian reform 14 developed completely, which, in accordance with the Great-Serbian ethnic policy, aimed to increase the number of southern Slavs (first of all Serbs), to break up the Hungarian ethnic block of the Tisza region and to destroy the majority of Hungarian ethnic enclaves. According to our calculations, 48,000 foreign Slavs (45,000 Serbs, 3,000 optant Bunjevats) were settled on the estates of 468,989 cadastral acres in Vojvodina beside the local Slavs. This land was expropriated mostly within 50 km of the border area on Hungarian ethnic territory between 1918 and 1931 (Fig.36.). We estimate that about 16,200 Serbs (military, civil servants, craftsmen, tradesmen etc) were settled in place of the escaped or expelled urban Hungarians during this period. At the same time landless Hungarians (24,000 in 1919) migrated in increasing numbers to the seat of the Dunavska Banovina (Danubian Banate), to Újvidék and to the capital, Belgrade. In the period between 1921 and 1929, 14,442 Hungarians migrated from Yugoslavia to America or Australia (about 10,000 from Vojvodina) 15. In 1929 the Kingdom of Serbs, Croats and Slovenes was transformed into Yugoslavia openly controlled by the Serbs. The second Yugoslav census was carried out in 1931, in the year of the proclamation of the new constitution, which both disclaimed the presence and prohibited the organisation of national-ethnic minorities. At that time 376,176 people were registered as Hungarians on the territory of present-day Vojvodina. Due to the intensive overseas emigration of Hungarians, their number increased only gradually in the period , in spite of the fact that their natural increase was Baranji. Prilog pitanju demadjarizacije Vojvodine (Assimilatory results of Hungarians in Bácska, Bánát and Baranya. Contributions to the question of Magyarization in Vojvodina), Novi Sad, 41p., Nyigri I ibid. 378.p.). 13 Hollós I A régi magyar államterület népességének fejlődése között (The Development of the Population of the Old Hungarian State Territory between 1910 and 1930), Magyar Statisztikai Szemle, pp Jojkić, V Nacionalizacija Bačke i Banata (Nationalisation of Bácska and Banat), Novi Sad, Nyigri I ibid., Gaćeša, N.L Agrarna reforma i kolonizacija u Bačkoj (Agrarian reform and colonization in Bácska) , Matica Srpska, Novi Sad, 285p., 1972 Agrarna reforma i kolonizacija u Banatu (Agrarian reform and colonization in Banat) , Matica Srpska, Novi Sad,420p, 1975 Agrarna reforma i kolonizacija u Sremu (Agrarian reform and colonization in Syrmia) , Matica Srpska, Novi Sad, 341p., Mesaroš Š Položaj madjara u Vojvodini (Situation of the Hungarians in Vojvodina) Filozofska Fakulteta, Univerzitet u Novom Sadu, Novi Sad. 15 Nyigri I ibid. 150

152 Figure 37. Change in the ethnic structure of population in selected cities and towns of the present-day Vojvodina ( ) 151
153 considerable ( : 7,5%, 16 ). The ratio of the Hungarians in the total population decreased to 23.2 %, the share of the Serbs due to the immigration of about 64,000 Serbs increased to 37.8 %. Serbian colonization significantly transformed not only the demographical-ethnical structure of the province, but the ethnic patterns of certain districts of Hungarian (or German) character. Between 1910 and 1931 the population of 53 present-day settlements (in Bácska 26, in Bánát 21, in Syrmia 6) changed from a Hungarian to a Serbian ethnic majority. Following the coup overthrowing the Cvetković government (March 27, 1941) Hitler ordered the occupation of Yugoslavia with its very unstable internal situation. On April 6, 1941 German and Italian troops started to invade the country. This formally ended with the capitulation of the Yugoslav Army (April 17, 1941). Meanwhile, on April 10, 1941 the Independent State of Croatia (NDH) was proclaimed. This meant the dissolution of Yugoslavia. On the day (April 11, 1941) that the Germans occupied Syrmia and Bánát, Hungarian troops announced the recapture of SE-Baranya and Bácska with a relative majority population of ethnic Hungarians which had been occupied by Serbian troops in October and November, Military administration was introduced in the returned territories together with pacification. The internment and deportation of the Serbs 17 who had immigrated after December 31, 1918 also started on the basis of a Hungarian government decree of April 28, The Hungarian authorities treated the German and Croatian minorities considerately because of Hungarian international relations, but they had their revenge on the Serbs for the humiliation of local Hungarians between 1918 and Parallel to the emigration and displacement of Serbian colonists and state employees, the Hungarian state policy served to reinforce the local Hungarians (Fig. 38.). Between May 11 and June , 13,200 Bukovinian, 161 Moldavian and 481 Hungarian veteran ('Knight' - vitéz) families (2,325 persons) were settled in the evacuated settlements of the former Serbian colonists 18, who had settled there 16 Jojkić, V ibid. 17 In May ,459, in June 12,000 immigrated Serbs, Jews and political unreliable persons were interned mostly in the camps in Újvidék, Bácstopolya, Bajsa and in some others along the Danube. In the period of ,921 Balkanian Serbs escaped or were trasported back by the Hungarian authorities from Bácska to Serbia (Milošević, S.D Izbeglice i preseljenici na teritoriji okupirane Jugoslavije , Beograd, 276.p., A.Sajti E Délvidék (South Hungary) , Kossuth Kiadó, pp ). 18 Hungarians from Rumanian Bukovina were settled in the greatest number in Novi Žednik (Hadžićevo, Bácsjózseffalva, 860 persons), Višnjevac (Radivojevićevo, Istenes-Istenvárára, 683), Novo Selo (Bajmočka Rata, Hadikújfalu, 1,264), Rastina (Hadikfalva, 733), Karadjordjevo (Andrásfalva, 927), Bački Sokolac (Bácsandrásszállás, 643), Njegoševo (Istenáldás, 613), Lipar (Sokolac-Emušić, Istensegíts, 1,341), Stepanovićevo (Horthyvára, 1,324), Temerin-Staro Djurdjevo (Hadikföldje, 652) and in Sirig (Hadiknépe, 796 persons) (see Merk Zs A bukovinai székelyek Bácskába telepítése az egyházi források tükrében, (The settlement of the Székely-Hungarians of Bukovina in Bácska in the mirror of the church sources, ) in: Bárth J. (Ed.) Dunáninnen - Tiszáninnen, Kecskemét, pp ). The "Vitéz- knight" families were settled in Vajska and in Bač-Mali Bač (Vitézfalu). Besides these, the Hungarian government resettled 395 Hungarian families (1,552 persons) in April 1941 from the eastern part of the Independent State of Croatia (NDH) (e.g. Bijeljina, Brčko, Vučijak, Gunja) to Bácska in Stepanovićevo (Horthyvára), Veternik (Hadikliget) and in Sirig (Had- 152
154 Figure 38. Hungarian colonization in Bácska ( ) between 1918 and 1931 on the large Hungarian and German estates, following the expulsion of local (mostly Hungarian) farmers and workers. iknépe) (Faluhelyi F Baranya, Bácska, Bánát nemzetiségi képe (Ethnic Pattern of Baranya, Bácska and Bánát region), Délvidéki Szemle 1943/8. (aug.) p.342., Albert G Emelt fővel (With head erect), Szépirodalmi Könyvkiadó, Budapest, 511p., A.Sajti E ibid.). 153
155 In addition to the agrarian colonization, the number of Hungarians in Bácska and Baranya increased with the settlement of about 20,000 people (state employees, military personnel, land-owners, craftsmen etc) from the territory of 'Trianon-Hungary'. Due to these events, at the time of the 1941 census held in the returned southern areas between 11 and 25 October 45.4 % or 47.2 % of the 789,705 inhabitants of Bácska declared themselves to be Hungarian native speakers or ethnic Hungarians. The proportion of Hungarians in Northeast Bácska reached 74.7 % (in %, in %) while the area north of the Bajmok-Kula-Bácsföldvár line, excluding the small Bunjevats ethnic area south of Szabadka, became an almost homogeneous ethnic Hungarian area. The number and the ratio of local Hungarians increased in every town, but their ethnic expansion in Szabadka, Újvidék and Zombor was the most remarkable compared with Yugoslav statistics from 1921 and Újvidék, the current provincial seat of Vojvodina, was statistically recorded as a city populated by a Hungarian majority of 50.4 % in Following the Hungarian recapture of Bácska, Serb-Yugoslav partisans began subversive activity against the Hungarian state. It became more and more intensive after mid-december Their armed activity was concentrated in the Serbian ethnic block of SE-Bácska, in the historical Sajkás District (e.g. Csurog, Zsablya, Mozsor), where the Hungarian Army, gendarmerie and counterintelligence avenged their losses with increasing brutality. Due to these raids in January 1942 the Serbian population was collectively called to account in many places, such as Óbecse, Szenttamás and Újvidék, 2,550 Serbs, 743 Jews and 47 other people also fell victim 19. Following the German occupation of Hungary (March 19, 1944), between April and August 16,034 people of Jews were deported to Germany. According to our estimation there were about 10,000 Hungarian native speakers among them. Later in September and October 1944 the escape of Hungarian state employees and colonists and the evacuation of about 60,000-70,000 Germans from Bácska started 20. In October 1944 Soviet, Yugoslavian and Bulgarian troops took the majority of the present-day territory of Vojvodina and under Tito s orders military rule was introduced. Internment of local Germans (about 140,000 persons) and Hungarian men of military age began in 41 concentration camps. Immediately after the take-over, in the first weeks according to different sources 21 and to our calculations based on the analysis of the censuses of 1931, 1941 and 1948, about 16,800 Hungarians fell victim to a Serbian vendetta in Bácska (in Vojvodina it was about 20,000) (Fig. 39.). During this time, within the framework of the second Yugoslavian agrarian reform, 389,256 hectares of German estates were confiscated, which was 58.2 % of all the 19 A.Sajti E ibid. 159.p. 20 Mirnić,J.1974 Nemci u drugom svetskom ratu (Germans during the World War II),Novi Sad, pp Cseres T Vérbosszú Bácskában (Vendetta in Bácska), Magvető, Budapest, 276 p., Matuska M A megtorlás napjai (The days of revenge), Montázs Könyvkiadó, Budapest, 376p. 154
156 Figure 39. Serbian and Hungarian losses in Bácska ( ) 155
157 land distributed in Vojvodina 22. Only 9.9 % of the land redistributed among private individuals was given to Hungarians, while 84 % was given to Serbians (or other Yugoslavs ). Between September 1945 and July ,696 people 23 mostly from the Krajinas in Croatia and Bosnia (162,447 Serbs, 40,176 Montenegrins, 12,000 Macedonians, 7,134 Croats, 2,091 Slovenes etc.) took the unique historical opportunity and settled in the areas of the Germans who had fled or been deported. According to the first census of the second Yugoslavia (1948) 60.4 % of the 1,640,757 inhabitants of Vojvodina were Serbs, Montenegrins and Croats, due to the vast population movements between 1944 and With these events, the former ethnic aims of the Serbs were realised and the two-hundred-year-old ethnic balance between the Serbs, Hungarians and Germans of Vojvodina came to an end with the Serbs in an absolute majority in the province, as in the days of the Ottoman-Turkish occupation. In spite of the heavy losses, 428,554 persons declared themselves to be ethnic Hungarian in According to our calculations based on the censuses of 1931, 1941 and 1948, about 30,800 of these may have been of German origin. They declared themselves Hungarian rather than German, due to the relatively better political situation of the Hungarians, their knowledge of Hungarian and their sympathy with the Hungarians in their misfortune. During the last half century, in the period between the censuses of 1948 and 1991, the demographical- ethnic geographical situation of the Vojvodina Hungarians was influenced by many objective factors (e.g. natural increase, migration) and subjective factors (e.g. statistical methods of the censuses, state policy towards minorities, mixed marriages, change in ethnic identity, natural assimilation). The birthrate of the local Hungarians between 1948 and 1991 (according to the data of Mirnics K. 24 ) together with our estimations for was 4 %, that is 17,191 persons. The low increase in number was a result of their decreasing fertility (1953: 19.5, 1991: 11.4 ) and their increasing mortality (1953: 11.2, 1989: 18.0 ). This unfavourable demographical trend was connected with the distortion of their age structure, their gradual ageing. The old age index of the Hungarians in Vojvodina increased between 1961 and 1991 from 63.9 to 155.2! Similar ageing was noticeable only among the Rumanians, Croats and Slovaks (176.7, and 136.4). On the other hand, the demographical situation of the state forming ethnic groups (Serbs, Montenegrins) and the 'Yugoslavs', who did not declare their ethnic affiliation, was relatively favourable 25. The demographic situation of the Hungarians was very grave in the small ethnic enclaves of the 22 Gaćeša, N.L Agrarna reforma i kolonizacija u Jugoslaviji (Agrarian reform and colonization in Yugoslavia) Matica Srpska, Novi Sad, 404p. 23 Gaćeša, N.L ibid. 24 Mirnics K Kissebségi sors (Minority destiny), Fórum Könyvkiadó, Novi Sad - Újvidék, 139p. 25 The old age index (number of the persons over 60 years to 100 persons under 14 years) of other ethnic groups of Vojvodina in 1991: 'Yugoslavs' 32.5, Montenegrins 56.8, Serbs Natural increase or decrease of different ethnic groups of Vojvodina in 1989: 'Yugoslavs' +11.3, Montenegrins +4.2, Serbs -1.1, Croats -4.9, Slovaks -6.4, Hungarians -6.6, Rumanians
158 Figure 40. Ethnic map of Vojvodina (1991) Bánát and Syrmia (Rábé, Magyarmajdány, Torontáltorda, Alsóittebe, Ürményháza, Sándoregyháza, Satrinca etc.). They were in a very unfavourable situation regarding transport, with poor living conditions, and were badly affected by the rural exodus and in having certain villages with a Calvinist religious character (e.g. Pacsér, Bácskossuthfalva). It was partly the unfavourable migration processes which resulted in only 339,491 ethnic Hungarians being registered at the census of 1991 instead of 445,745 Hungarians calculated on the basis of the natural increase between 1948 and During the Yugoslavian socialist urbanisation, in the 'heroic age' of communist, social and economic modernisation, tens of thousands of Hungarians were indirectly forced to migrate from the ethnically closed rural societies to the ethnically and linguistically mainly foreign urban environment. The accelerated migration of the population from the Hungarian ethnic enclaves was directed not only towards the big industrial centres, towns of Serbian character and western countries, but towards the towns of Northeast Bácska in Hungary, too. Due to this internal migration, the share of those Vojvodina Hungarians who lived in the Tisza Region increased from 52.1 % to 59.6 % between 157
159 1948 and The Hungarians of the province suffered much heavier losses due to the international migration, compared to internal population movements. According to our calculations based on natural movement of population and assimilation, Hungarian migration losses between 1948 and 1991 were 69,193 people, 25,228 of whom left in the 80s. The negative migration balance between 1948 and 1961 was mainly due to the emigration of the majority of people of German origin who had declared themselves to be Hungarians in The first big emigration wave took place between 1965 and It was considered at that time to be a temporary phenomenon, related to the possibility of foreign employment in western countries and due to the Yugoslavian economic crisis. In these years 16,627 Hungarians 27.5 % of Vojvodina s 'Guest workers' were employed abroad 26. Hungarian migrant workers ("Guest workers") left in the greatest numbers from the communes of Szabadka (2,677), Újvidék (1,419), Bácstopolya (950), Zombor (909) and Ada (906), and left in the greatest ratio from the ethnic enclaves in the Bánát. During the last decades subjective factors influencing ethnic identity played a very important role in the statistical change in number of ethnic Hungarians. Yugoslavian ethnic policy seemingly 'exemplary' from the outside filled the Hungarians with the feeling of having no future and being rootless as a minority group. This was exacerbated by the Yugoslavs discrediting the Hungarian nation which was at that time under Soviet control and a member of the Warsaw Pact. Special attention was paid to the reorganisation and internationalisation' of the Hungarian education system and stress was laid on the importance of the Serbian language. Due to this policy, the ratio of Hungarian school children studying in Serbo-Croat increased between the school years 1959/1960 and 1989/1990 from 13.1 % to 20 % 27. With mixed marriages becoming more and more common natural assimilation increased with a change in the mother tongue and ethnic identity. The ratio of ethnically homogeneous marriages decreased from 82.2 % to 73.6 % between 1956 and This resulted in the growing assimilation of children of mixed families. Due to state propaganda glorifying Yugoslavia and disparaging the culture and language of national minorities and thanks to mixed marriages the number of the population with an uncertain or absent ethnic identity continued to increase. While at the 1961 census only 0.3 % of the province s population did not want to (or could not) declare their ethnic affiliation, this percentage increased to 9.8 by Of these, primarily the fairly young, slightly religious minority population, with a very uncertain ethnic identity declared themselves to be 'Yugoslavs'. In 1991, 71.2 % of the so-called 'Yugoslav' population with an undeclared ethnicity were younger than 40 years old. 26 Bukurov, B Kolonizacija Bačke za vreme drugog svetskog rata (Colonization of Bácska during the World War II), Glasnik Srpskog Geografskog Društva LI. 1.pp Mirnics K ibid. 158
160 THE PRESENT TERRITORY OF HUNGARIAN SETTLEMENT IN VOJVODINA At the time of the last Yugoslavian census (March 31, 1991) carried out in a turbulent political atmosphere only 339,491 inhabitants in Vojvodina decided to be open about their Hungarian ethnicity. 174,295 of inhabitants 'without ethnic affiliation' (197,718) declared themselves to be 'Yugoslavs'. In so far as we divide this 'Yugoslav' population proportionately between the ethnic groups, the estimated number of Vojvodina Hungarians would have been 376,000 in The majority of Hungarians in Vojvodina (202,000 people) live in their ethnic block along the Tisza River, where they represent 56.5 % of the local population (Fig. 40.). Only seven of the communes had an absolute Hungarian majority in 1991 (Magyarkanizsa, Zenta, Ada, Bácstopolya, Kishegyes, Csóka and Óbecse). Hungarians were in a relative majority in the Szabadka community with 42.7 %, and represented a strong minority in the communities of Temerin (38.7 %) and Törökkanizsa (33.8 %). In keeping with historical events and the unique geographical environment of this region, Hungarians primarily inhabit small towns (26.4 %) and large villages (19.5 %). Thus, the biggest Hungarian community in Vojvodina and also Serbia (officially 39,749 but 49,000 according to our estimates) inhabit the city of Szabadka, but more than ten thousand Hungarians live in Zenta, Újvidék, Nagybecskerek, Óbecse, Bácstopolya, Table 28. The largest Hungarian communities in Vojvodina (1991) Settlements Population 1. Szabadka / Subotica 39, Zenta / Senta 17, Újvidék / Novi Sad 15, Nagybecskerek / Zrenjanin 14, Óbecse / Bečej 13, Bácstopolya / Bačka Topola 11, Magyarkanizsa / Kanjiža 10, Ada / Ada 10, Temerin / Temerin 9, Csantavér / Čantavir 7, Horgos / Horgoš 6, Péterréve / Bačko Petrovo Selo 5, Nagykikinda / Kikinda 5, Ómoravica / Stara Moravica 5, Kishegyes / Mali Idjoš 5, Mohol / Mol 4, Zombor / Sombor 4, Törökbecse / Novi Bečej 4, Palics / Palić 4, Szenttamás / Srbobran 4, Pancsova / Pančevo 4,052 Source: Final data of the Yugoslav census of 1991 (ethnicity). 159
161 Magyar- Figure 41. Hungarian communities in Vojvodina (1991) Source: Census 1991 kanizsa and Ada (Tab. 28., Fig. 41.). Besides the Tisza Region, Hungarians represent the majority of the population in only 30 settlements (in Bánát 20, in Syrmia 2, in South and West Bácska 8) (Tab. 29.). The fact that 43.4 % of Hungarians live in settlements where they are in the minority (in addition to other previously mentioned demographic characteristics) has had a negative influence on the change in the population of Hungarians in Vojvodina, their sense of identity and their exposure to linguistic assimilation. Recently, the demographic situation and the ethnic identity of Hungarians in Vojvodina have been influenced by many factors. The emigration of about 25,000-30,000 Hungarians 28, escaping from the sometimes ethnically discriminative recruiting policy during the war in Croatia and Bosnia is a threatening phenomenon. Thousands of 28 Mirnics K ibid. 160
162 Hungarians also left Vojvodina due to the economic crisis, poverty, soured relations and the tense atmosphere between the Serbs particularly Serbian refugees (242,340 per- Table 29. Towns in Vojvodina with absolute Hungarian majority (1991) Settlements Percentage of the Hungarians 1. Magyarkanizsa / Kanjiža Ada /Ada Zenta / Senta Bácstopolya / Bačka Topola Mohol / Mol Palics / Palić Csóka / Čoka Temerin / Temerin Óbecse / Bečej 50.6 Source: Final data of the Yugoslav census of 1991 (ethnicity). sons in 1996) 29 from Croatia and Bosnia and the minorities (Hungarians, Croats, Bunjevats etc). 75% of former Croatian and Bosnian Serbs looking for a new homeland settled in southwest Bácska and in the Syrmia region between 1991 and They mainly went to the settlements of their relatives who had colonised Vojvodina between and to the villages of Croats who had emigrated, fled or been expelled (e.g. Szond, Herkóca, Kukujevci, Gibarac, Novi Slankamen) and of course to the bigger towns which offered favourable living conditions (e.g. 24,487 Serbs in Újvidék, 6-8 Thousand in Ruma, Zombor, Pancsova, India and Mitrovica) (Fig. 42.). In the Hungarian ethnic area of the Tisza Region, Serbian refugees were settled in limited numbers (5,891 persons) or were accepted by the local authorities. At the same time Serbs in significant numbers found new homes in towns of Hungarian character and with good transport (e.g. Szabadka 6,401, Temerin 3,444, Óbecse 1,471, Palics 1,359 and Bácstopolya 1,200). Due to this Serbian settlement and the partial emigration and natural decrease of local Hungarians the ratio of the ethnic Hungarians fell below 50 % e.g. in Óbecse, Bácsföldvár, Nemesmilitics and in Palics by Moreover, in Temerin, Bajmok and Törzsudvarnok the number of Serbs now exceeds that of Hungarians. The recent large-scale immigration of Serbian refugees and the increasing emigration of Croats and Hungarians resulted an important change in the ethnic structure of the population of Vojvodina. According to our estimation the proportion of Serbs reached the 64.3 % (56.8 % in 1991) and of Hungarians fell to 12,9 % (16.9 % in 1991) in 1996 (Tab. 26.). 29 Census of Refugees and Other War-Affected Person in the Federal Republic of Yugoslavia, UNHCR - UN High Commision for Refugees - Commisioner for Refugees of the republic of Serbia, Belgrade,
163 Figure 42. Serbian refugees in Vojvodina (1996) Source: Census of Refugees and other War-affected Persons in the Federal Republic of Yugoslavia UNHCR - UN High Commissioner for Refugees - Commissioner for Refugees of the Republic of Serbia, Belgrade,
164 Chapter 6 THE HUNGARIANS OF CROATIA According to the Yugoslav census carried out before the Croatian war broke out in 1991, 22,355 persons, i.e. 0.5 % of the total population declared themselves to be ethnic Hungarian, and 19,687 persons were native Hungarian speakers, in the presentday territory of the Republic of Croatia. This Hungarian minority populace, predominantly scattered in areas struck by the war and occupied between , represented 0.2 % of Hungarians in the Carpathian Basin and 0.8 % of the Hungarian minorities of that region. THE NATURAL ENVIRONMENT The autochthonous ethnic Hungarians of Croatia (70.4 %) inhabit the southwestern periphery of the Great Hungarian Plain (Nagyalföld): the Danubian Plain of Baranya 1, the Plain of Lower Dráva, the Plain of Valkó (Vuka) and the West-Syrmian loess plateau (Fig. 43.). Diluvial gravel, clay, sandy terraces, and loess platforms emerge above the alluvia of the above-mentioned flatlands. Loess plateaus were terrain especially favourable for the formation of very fertile soils, such as chernozems, along the southern foothills of Hills of Bán (Báni-hegység, Baranyahát, Bansko Brdo) 2 and in the surroundings of Vukovár. The highest elevations of the flatland inhabited by Hungarians are the Hills of Bán (243 m) and the Ridge of Erdőd, the latter can be found at the confluence of the Danube and Dráva rivers (Dályahegy, Čvorkovo brdo, 189 m). The marshy areas along the Danube and the Valkó (Vuka), e.g. Kopácsi-rét (meadow) are refuges which provided security during the destruction of war in the past thousand years. They ensured the survival of the autochthonous Hungarian population several times. The ever-shrinking scattered communities of Hungarians which mainly emerged as a result of migrations in the 19 th century (12 % of the Hungarians in Croatia, i.e. 2,690 people) 1 Baranya: historical Hungarian county and region in the southeastern part of Transdanubia cut by a state border since the Trianon Peace Treaty (1920). For the sake of simplicity in this chapter, Baranya means the present-day Croatian territory to be found between the Danube, Dráva and the Hungarian border. It should be mentined that during medieval times Baranya County extended to areas south of the Dráva, to the environs of the present-day Eszék, Valpó and Našice. 2 Bognar A Changes in Ethnic Composition in Baranya, Geographical Papers 8., Institute of Geography, University of Zagreb, 303.p. 162
165 Figure 43. Important Hungarian geographical names in Croatia 163
166 live in the Belovár and Daruvár basins of Western Slavonia 3 enclosed by the Psunj (984 m), Papuk (953 m), Monoszló (Moslavačka Gora, 489 m) and Kalnik Mountains (643 m) built of crystalline schists and granite, and by Mt. Bilogora (294 m) constituting Pliocene limestone and marl with foothills covered by loessy clay. The most important rivers in these areas are the Csázma, Ilova and Pakra. ETHNIC PROCESSES DURING THE PAST FIVE HUNDRED YEARS At the end of the 15 th century Baranya, and the areas along the Danube and Dráva rivers in present-day Croatia were inhabited predominantly by Hungarians. Slavonian-Croatian and Hungarian settlement areas were separated by marshes and the woodlands of Karašica, Vučica, Vuka and Bosut rivers extending beyond the Dráva river. The most important medieval towns of the Hungarian ethnic area were Baranyavár, Danóc, Karancs, Laskó and Csemény (north of the Dráva), and Villyó, Szeglak, Verőfény, Szombathely, Valpó, Eszék, Drávaszád, Hagymás, Erdőd, Boró, Valkóvár, Berzétemonostor, Szata, Atya and Újlak 4 (south of the river). The basically Hungarian character of the above territory along the Danube and Dráva rivers is evidenced by the tax inventories of the estates at Kórógy, Eszék and Baranyavár of At that time the number of family names of Hungarian, Slav and uncertain origin in Baranyavár - Karancs was 53.3 %, 5.3 % and 41.4 %, respectively, while it was 52.8 %, 7.5 % and 39.7 % in Eszék. From the second half of the 15 th century the ethnic character of the Hungarian settlement area started to change, owing to the northward migration of Croats and Serbs moving there who had escaped from the Turks. Fundamental ethnic changes occurred in present-day eastern Croatia as a result of migrations following the crushing defeats by the Turks (e.g. Mohács 1526, Gara-Gorjani 1537), and the Turkish occupa- 3 Slavonia: In the Middle Ages, as a southwestern principality (Hung. "Tótország", Country of Slavones) it comprised the counties of Zágráb, Varasd, Kőrös, Dubica, Szana and Orbász along the Száva River. Its Roman Catholic inhabitants called themselves Slavones (Slovenes) until the 17 th century. Later, under Turkish rule, simultaneously with a massive northward escape of the Croatian population, the name Croatia became a reference to the (formerly Slavonian) area between the Kapela Ranges and the Dráva river, not occupied by the Turks. In this way Slavonia as a region gradually turned into an area east of Zágráb (Zagreb) situated between the Dráva, Danube and Száva rivers, repopulated by Croats and Serbs. It was also called as "Austrian Mesopotamia" during the Hapsburg times, in the 18 th century. (See: Szabó P. Z Horvátország és mai részei a magyar történelemben -in: Földrajzi Zsebkönyv 1945, Magyar Földrajzi Társaság, pp ) 4 The current names of the listed settlements are: Branjin Vrh, Topolje-Duboševica, Karanac, Lug, Čeminac and Viljevo, Zelčin, Topolina-Bizovac, Lug Subotički, Valpovo, Osijek, Aljmaš, Erdut, Borovo, Vukovar, Nuštar, Sotin, Šarengrad, Ilok Regestrum super taxam ordinariam et extraordinariam in pertinentiis Korogh, Ezeek et Baronyawar nec non Hagmas et Drazad impositam, primo et principaliter in Baranywar. Magyar Országos Levéltár (Hungarian National Archive) Dl (See: Mažuran, I Porezni popis grada i vlastelinstva Osijek i njegove okolice Godine (Tax census of the town and estate Eszék and of its environs in 1469), Starina Kn. 58 / 1980., JAZU, Zegreb, pp ) 164
167 tion of present-day Baranya and Slavonia between There was a massive flight of Catholic Croats-Slavones to the north, from the occupied areas, situated east of the Sziszek-Csázma-Verőce line, and an organised resettlement of people from the Slavonian estates of the Zrínyi, Batthyány, Erdődy, and Nádasdy families to Western Hungary (mainly to present-day Burgenland) 6. The overwhelming majority of those Catholic Slavones-Croats staying in their former place of residence (e.g. three-quarters of them in the Pozsega Basin) 7, especially noblemen and town dwellers who stayed for economic and social reasons, became converted to the Islamic faith. In the first half of the 16 th century there were heavy losses (killing, flight), and conversion to Islam (especially in towns 8 ) among the Hungarians living along the Belgrád-Eszék-Baranyavár-Buda military route. In remote areas lying closer to the rivers (Danube, Dráva), in the marshland of Vuka-Palacsa and in the vicinity of Kórógy, however, Hungarians survived and were converted to Protestantism (Reformed Church) from the second half of the 16 th century. According to the tax inventory carried out by the Turks in 1554, of the 1,131 taxpayers in present-day Croatian Baranya 69.9 % bore Hungarian and 9.2 % Slavic family names and 20.9 % of them were of uncertain ethnic origin 9. At that time 47 of the villages in the region were Hungarian, and 1 (Gragoróca) had a Slavic majority. The most populous Hungarian communities were Laskó, Újfalu (today Darázs), Hercegszőlős and Vörösmart near the marshes along the Danube. In Baranyavár and Karancs, which lay along the military route between Eszék and Mohács, and which were earlier considered to be the flourishing towns of the region, the number of taxpayers dropped from 67 to 10 and from 139 to 43 between 1469 and Following the voluntary migration and resettlements by the Turks during the 16 th century, the share of the Slavic population (Serbs, Vlachs-Iflaks) gradually expanded. According to a census from 1591, in presentday Croatian Baranya 36 settlements were considered Hungarian, 8 settlements had a Slavic majority and 3 settlements were ethnically mixed 10. On the territories south of the Dráva, Orthodox Vlach-Serbs leading a pastoralmilitary way of life were settled from Bosnia in place of the Slavones-Croats and Hungarians 11 who had fled. In Slavonia there was a massive resettlement of Serbs as border 6 Pavičić, S Podrijetlo hrvatskih i srpskih naselja i govora u Slavoniji (Origin of the Croatian and Serbian settlements and of dialects in Slavonia), Djela JAZU 47., Zagreb, 204.p. 7 Karger, A Die Entwicklung der Siedlungen im Westlichen Slawonien, Kölner Geographische Arbeiten 15., Franz Steiner Verlag, Wiesbaden, 46.p. 8 This was chiefly due to similar conversions in Újlak, one of the most flourishing towns of medieval Hungary, where 386 Muslim and 18 Christian households were recorded in (See: Popović, D Srbi u Vojvodini (Serbs in Vojvodina) I-III. Matica Srpska, Novi Sad, 261.p.) 9 Káldy-Nagy Gy Baranya megye XVI. századi török adóösszeírásai (Turkish taxcensuses of Baranya County in 16 th century), Magyar Nyelvtudományi Társaság, Budapest. This inventory did not contain data about the Hungarian settlements of Kopács, Bellye, Várdaróc and Csamafalva. 10 Bognár A Changes in ethnic composition in Baranya, Geographical Papers 8. (Zagreb), 311.p. 11 Serbs increasingly moved into the place of Hungarians who had fled from the following settlements: Ilok, Šarengrad, Vukovar, Borovo, Dalj, Erdut, Aljmaš, Osijek, Bobota, Tenja stb. (Popović, D ibid. 110.p.) 165
168 guards. The target areas were the entrances to the Pozsega Basin and the Papuk, Krndija and Dilj mountains, an area between the Ilova River (a Christian-Moslem front line) and the mountains of Papuk and Psunj, which at that time was called Little Wallachia (Mala Vlaška) 12. With the movement of the Moslem population (e.g. Bosnians, Turks), and the conversion of the majority of Hungarians and Croats to Islam ("renegades"), most of the Slavonian towns counted as Moslem in the 16 th century 13. According to the number of houses, the largest towns of the region in 1620 were Eszék, Pozsega (1,000-1,000), Verőce (400), Pakrác (350), Orahovica, Velika ( ) and Valkóvár-Vukovár (100) 14. Of these Eszék, a bridgehead of strategic importance, was overwhelmingly Hungarian even in 1663 (though most of the people converted to Islam) 15. The present-day territory of Eastern Croatia was liberated from Ottoman- Turkish occupation between 1684 and 1688, as a consequence of which the local Muslims (not only the Turks but also the "renegades", i.e. the Islamized Slavs and Hungarians) fled to Bosnia 16. Almost immediately Catholic Croats entered the liberated Slavonia. From 1690 onwards, there was a massive influx of Orthodox Serbs (led by patriarch Arsenija Crnojević III.), Roman Catholic Shokatses 17 (from the environs of Srebrenica) and Bunevatses following the recapture of Serbia and Bosnia by the Turks and the retreat of Hapsburg troops. Between 1686 and 1696 the population of the freed territories which had grown by tens of thousands, and which had been the base of operations suffered severely from brutality of the Hapsburg troops. They passed through demanding food and shelter, which raised taxes, causing many people to emigrate 18. As a consequence of the destruction at the end of the 17 th century, the number of villages with a Hungarian ethnic majority decreased from 36 to 14 between 1591 and At the 1696 census 5 ethnic Serb and 4 Croat-Shokats villages were recorded. At that time 57 % of the registered 449 families lived in Hungarian villages, while 23.8 % of them resided in Serb villages and 19.2 % were inhabitants of smaller Croat settlements 19. The former medieval Hungarian settlement area south of the Danube and Dráva rivers had completely broken up and became ethnically Serb, especially in the areas of Eszék and Valkóvár. 12 Karger, A ibid. 64.p. From these environs of Daruvár and Pakrác, being the borderland between the Hapsburg and Ottoman Empires, parallel with the recurring destruction between 1587 and 1600, the Hapsburg troops made Serbs move to the Austrian side of the border, and settled them in the vicinity of Kapronca 13 Karger, A ibid. 70.p. 14 Smičiklas, T Spomenici o Slavoniji u XVII. vijeku (Rememberances about Slavonia in 17 th century) ( ), Zagreb, 4.p. 15 Karácson I Evlia Cselebi török világutazó magyarországi utazásai (Travels of Turkish world traveller, Evlia Chelebi in Hungary) , MTA, Budapest, 179.p. 16 As a result the population number of e.g. Pozsega, site of a former sanjak, had dropped from 15,000 down to 220 by (See: Karger, A ibid. 28.p.) 17 Shokatses chiefly moved to Izsép, Dályok, Hercegmárok and Baranyavár (on the territory of Baranya) and to Újlak, Tárnok and Szata in the Croatian Syrmia (Szerémség, Srijem). 18 Taba I Baranya megye népessége a XVII. század végén (Population of Baranya County at the end of 17 th century), Pécs, 9.p. 19 Taba I ibid. pp
169 In 1697 only 66 Hungarian families belonged to the Reformed Church at Szentlászló, Kaporna 20 and Kórógy 21 in the Vuka marshland. The Islamized Hungarian population disappeared almost totally from the towns giving way to a new wave of Serb and Shokats refugees, or to Germans who settled down immediately after the liberation (i.e. at the Eszék fortress). At the turn of the 17 th and 18 th centuries, spontaneous and organized resettlement was disturbed by an anti-hapsburg war of independence led by Prince F. Rákóczi II ( ). Serbs fought on the side of the Austrian emperor, causing serious damage, 22 so in a punishing campaign by the Rákóczi troops (1704) not only Serb villages in Bácska but those in Baranya were burnt down and their inhabitants driven away. Following the Szatmár Peace Treaty (1711) the Serbs returned and the resettlement of Bosnian Catholics (e.g. Shokatses) proceeded under the auspices of the Franciscan Order. The large estate owners of Baranya and Slavonia (e.g. those with a centre in Bellye belonging to the Savoy family, in Dárda to the Veteranis, later an Eszterházy estate, in Erdőd to the Pálffy family, in Valkóvár to the Eltz family, in Újlak to the Odeschalchis, later Pejačević) and the imperial chamber, continued their policy of resettling Catholic Germans and Croats on depopulated territories or those which were inhabited by a sparse pastoral-military Serb population, i.e. areas to be turned into fertile cropland. As a result of these migrations the autochthonous Hungarians gradually became an ethnic minority in the first half of the 18 th century, among Croats and Serbs. While in 1720, of the 580 registered heads of households on the territory of present-day Croatian Baranya 53.4 % bore a Hungarian family name 23, in 1752, of the 1,717 households only 29.7 % could be considered Hungarian 24. In the period between 1720 and 1752 the number of Croats increased from 24.9 % to 31.6 %, that of Serbs rose from 20.3 % to 25.9 %, and the number of Germans increased from 1.4 % to 12.8 %. Germans mainly from Wurttemberg, Baden, Hessen, and Bavaria settled in Pélmonostor, Dárda, Baranyabán, Baranyaszentistván and Keskend (in the Baranya region), or moved to Eszék-Újváros, Új-Vukovár, Vinkovci and the surrounding villages (in Slavonia). Ruthenians settled on the estate belonging to the archbishop of Kalocsa (Petrovci, Mikluševci) in the environs of Vukovár in As a result of the above settlements the area situated north of the present-day towns of Donji Miholjac - Vinkovci - Šid, which used to be Hungarian during the Middle Ages, acquired a mosaic-like ethnic pattern (with Croats, Serbs, Hungarians and Germans as the main ethnic components) similar to Vojvodina in Serbia. The ethnic spatial pattern formed by the end of the 18 th century in the present-day area of Eastern Croatia did not change significantly until the second half 20 Presumably together with Haraszti and Lacháza. 21 Popović, D ibid. II. 52.p. 22 E.g. Sacking and burning down of town Pécs by the Serbs on February 1 and Acsády I ibid. pp By 1720 the Hungarian ethnic area, similar to the present situation retreated to the area between the Hills of Bán and the Danube. At that time most of the Hungarian households were recorded at Kopács (39), Karancs (38), Várdaróc (33), Laskó (31), Hercegszőlős (26) and Vörösmart (25). 24 Bognár A ibid. 312.p. 25 Popović, D ibid. II. 53.p. 167
170 of the 19 th century. In Baranya Croats retained their relative majority over Hungarians between the mid-18 th and early 19 th centuries and gained an absolute majority in the counties of Pozsega, Verőce and in the military border districts of Croatia ( ,9 %) by the first half of the 19 th century 26. By 1840, 1,605,730 people lived in the area of the the counties and border zones south of the Dráva (later Croatia-Slavonia) and the Hungarian Coast of the Adriatic Sea (the towns of Fiume-Rijeka, Buccari-Bakar and their environs); 67 % of them were Croats and 31.4 % Serbs. At that time Germans numbered 13,226, Hungarians 5,151, Slovaks 3,558 and Jews 1, At that time the most populous town of Croatia was Eszék, a bridgehead on the Dráva and a market centre of this fertile agricultural region, an overwhelmingly German-Croatian settlement with 12,562 inhabitants. The Croatian capital, Zágráb (12,231) was second to it. 36,706 people lived on the territory of present-day Baranya in Croatia; 34.1 % were Hungarians, 28.9 % Croats, 22.4 % Germans and 13.3 % Serbs (Tab. 30.). The largest villages (with 2,000-1,900 inhabitants) of the time in Croatia were Dárda (with a German- Hungarian-Serbian mixed population), the German and Serbian village of Baranyabán and the Hungarian village Vörösmart. The largest Hungarian communities (with 1,900-1,100 persons) in Baranya were Vörösmart, Karancs, Kopács and Laskó. In the first half of the 19 th century Hungarian colonists from the Bácska and Transdanubia were added sporadically (in Ójankovác, Csák, Antunovác) to the autochthonous Hungarians of Slavonia who survived the devastations of the 16 th and 17 th centuries 28. The economic boom which gradually emerged after the abolition of serfdom (1848), the Austro-Hungarian Compromise (1867) and the Hungaro-Croatian Compromise (1868) and, subsequently the dissolution of the Croato-Slavonian Military Border districts 29 between 1871 and 1881, accelerated the mobility of the population and this resulted in considerable changes in the ethnic pattern with certain typical areas of immigration. During the last decades of the 19 th century and at the turn of the century, there was a massive emigration of Slovaks and Ruthenians from Upper Hungary, of Germans Table 30. Ethnic structure of the population of Croatian Baranya ( ) Total Yugoslavs Year Croats Serbs Hungarians Germans Others population ,706 10,600 4,900 12,500 8, In 1840, according to Fényes E ibid. 27 Fényes E ibid. 28 See Ruh Gy Magyarok Horvátországban (Hungarians in Croatia), Szociográfiai Értekezések Tára 4., Magyar Szociográfiai Intézet, Budapest. 29 A gradual abolition of the southern Military Border districts of the Hapsburg Empire (after 1867 Austro-Hungarian Monarchy) was motivated by an outdated military system. It was uneconomic in character and was losing its function in foreign affairs (which resulted in an extremely weakened Ottoman Empire as a neighbour and the elimination of the "Turkish menace", occupation of Bosnia-Herzegovina by the Monarchy in 1878 and the emergence of Serbia as an independent state). From the Hungarian side the measure was favoured by the supporters of (Austro-Hungarian) dualism in order to get rid of a military border zone inhabited by Serbs, Croats, Rumanians and Germans under the auspices of the Viennese Ministry of Defense as a potential internal source of danger in the event of political change. 168
171 ,329 10,574 5,425 14,230 13,156 1, ,885 10,701 6,276 17,184 14, ,758 10,614 5,873 17,325 14, ,616 9,912 6,267 20,381 14, ,452 9,434 6,170 16,638 16, ,846 10,893 10,434 13,973 15,751 1, ,781 8,492 7,813 18,648 14,238 2, ,190 19,328 11,465 17,025 4,500 1, ,866 17,984 11,607 16,012 3, , ,087 23,514 13,698 15, , ,322 23,283 15,614 13, ,046 2, ,409 19,136 12,857 9, ,397 2, ,265 22,740 13,851 8, ,265 4, ,482 7,689 23,458 6, Year Total popul. % Croats % Serbs % Hung. % Germ. % Yug. % Other % Sources: 1840: Fényes E Magyarország geographiai szótára I-II., Pest, , 1941: Hungarian census data (mother/native tongue), 1921, 1931: Yugoslav census data (mother /native tongue), : Yugoslav census data (ethnicity), 1992: Serbian local census (Ćurčić, S. - Kicošev, S Development of the population of Baranya, Beli Manastir - Novi Sad) Remarks: The Croats include the Bunyevats, Shokats and Dalmatinian ethnic groups and the Serbs of Roman Catholic religious affiliation in (Swabians) from South Hungary to America, and Szeklers of Transylvania to the neighbouring Rumania. The ever-increasing Hungarian population surplus of Bácska and Transdanubia (entrepreneurial smallholders and landless people) moved to Slavonia in great numbers, and purchased still neglected land and property from the former military 169
172 personnel who were unable or unwilling to cultivate the land 30. The massive immigration of peasants, servants working on the large estates, industrial workers and civil servants also added to the number of Hungarians. At the beginning the spontaneous agrarian immigration of Hungarians from Bácska and Transdanubia was restricted to the environs of the Dráva and the Danube, e.g. to the Verőce, Szlatina and Vukovár districts, but then it extended to Belovár-Körös and Pozsega counties. This voluntary economic migration which spread Hungarians over the Croatian and Serbian settlement area of Slavonia was in four main directions 31 : 1. From Somogy, Tolna, Zala and Vas counties to Belovár- Körös County (to the basin between Bilogora, Monoszló mountains (Moslavačka Gora) and Ilova river; 2. From the Transdanubian region to Pozsega County (the districts of Daruvár and Pakrác); 3. From Somogy, Győr and Baranya counties to Verőce County (the districts of Verőce, Szlatina, Alsómiholjác, Nasice, Diakóvár and Eszék); 4. From the Bácska region mainly to the Vukovár district of Syrmia (Szerém) County. As a result of this intensified immigration, the number of Hungarians rose from 15,360 to 66,045 in the eastern part of present-day Croatia between 1840 and 1910, and grew from 4,951 to 45,664 in East Slavonia 32. The number of native Hungarian speakers was 105, 948 on the territory of the contemporary Croatian-Slavonian Kingdom 33, and 121,408 in the area of present-day Croatia in 1910 (Tab. 31.). There was an explosive population boom (a fold increase) among urban Hungarians (Eszék, Vukovár, Vinkovci) and in rural areas caused by migration and the high natural increase 34 (Tab. 32., Fig. 44.). At the same time, the number of autochthonous Hungarians (e.g. those in Kórógy, Szentlászló, Haraszti, Lacháza) rose by a "mere" 66 % between 1840 and Such an intense growth of the Hungarian population and 30 Margitai J A horvát-és szlavón magyarok sorsa, nemzeti védelme és a magyarhorvát testvériség (Destiny, defence of the Hungarians in Croatia-Slavonia and the Hungarian-Croatian fraternity), Budapest, pp Margitai J ibid., pp , Ruh Gy. 1941ibid. 10.p. In the choice of a new place of residence, when purchasing a new small holding, a natural environment similar to one s homeland was one of the criteria also taken into account. 32 Eastern part of Croatia: territory of the Republic of Croatia situated east of the Szlatina- Okučani line. East Slavonia:see 'Eastern part of Croatia' without Baranya. 33 Croato-Slavonian Kingdom: as part of the Hungarian Holy Crown between 1868 and 1918 it comprised counties situated between the Adriatic coast and Dráva River. A considerable difference from the present-day territory of Croatia is that it included Syrmia in present-day Serbia, but it failed to contain Baranya, Muraköz (Medjimurje), Istria, Fiume (Rijeka) and Dalmatia. 34 During the period between 1906 and 1910 on the territory of Croatia-Slavonia the average annual natural increase of Hungarians was 17.4, that of Croats 12.7, of Serbs (Ruh Gy ibid. 7.p.) 170
173 Table 31. Ethnic structure of the population on the present territory of Croatia ( ) Total Year population Croats Serbs Hungarians Italians Germans Slovenes Muslims Czechs Slovaks Ruthenians, Yugoslavs Others Ukrainians ,160,406 2,159, , , , ,948 28,485 31,484 7,660 2,075 24, ,460,201 2,371, , , , ,587 28,179 31,479 9,807 5,596 40, ,447,594 2,374, ,058 81, ,336 99,808 32,023 42,444 3,883 18, ,785,455 2,641, ,518 69, ,000 99,670 37,143 3,565 37,366 7,172 4,242 18, ,753,524 2,972, ,568 51,297 74,359 10,143 37,798 1,180 28,903 10,111 6,375 14, ,936,019 3,113, ,534 47,480 32,517 11,122 42,064 35,503 15,954 46, ,159,690 3,339, ,935 42,329 21,101 38,973 3,111 23,390 8, ,750 42, ,426,221 3,513, ,789 35,488 17,433 2,791 32,497 18,457 19,001 6,482 6,521 84,118 62, ,601,469 3,454, ,502 25,439 11,661 2,175 26,136 23,740 15,061 6,533 5, , , ,784,265 3,736, ,663 22,355 21,303 2,635 22,376 43,469 13,086 5,606 5, , ,628 Total Year Croats % Serbs % Hung. % Ital. % Germ. % Sloven. % Musl. % Czech% Slovaks popula. % % Ruth. % Yugosl. % Oth. % Sources: Stanovništvo prema vjeroispovjedi ( ) i narodnosti ( ) po naseljima (manuscript), Državni Zavod za Statistiku, Zagreb, , 1910: Hungarian-Croatian, Austrian census data (mother/native tongue, language affiliation), 1921, 1931: Yugoslav census data (mother/native tongue), : Yugoslav census data (ethnicity).
174 Table 32. Change in the number of Hungarians in different parts of East Croatia ( ) Year Baranya 14,230 17,184 17,325 20,381 16,638 13,973 18,648 17,025 16,012 15,303 13,473 9,920 8,956 8,791 Kórógy & environs 2,800 2,950 3,109 3,321 3,370 3,188 3,100 3,061 2,991 2,775 2,374 1,640 1,445 1,438 Eszék, Vukovár, Vinkovci 2,517 3,223 4,431 6,670 3,878 4,959 4,860 3,320 3,213 3,699 3,286 2,424 2,298 1,924 East- Slavonian diasporas 13,148 23,846 30,971 35,673 23,842 21,990 21,992 12,885 11,295 8,470 6,153 4,185 3,196 2,466 West- Slavonian diasporas 10, ,242 29,950 22,738 17, ,984 10,507 8,423 6,271 3,836 2,747 1,422 Sources: Calculations of K. Kocsis based on Stanovništvo prema vjeroispovjedi ( ) i narodnosti ( ) po naseljima (manuscript), Državni Zavod za Statistiku, Zagreb, 1995 Remarks: Italic figures: mother/native tongue data. Kórógy & environs = Kórógy, Szentlászló, Haraszti and Lacháza (Slavonian autochtonous Hungarian villages). East-Slavonian diaspores= Hungarians east of the line of Szlatina-Okučani, excluding "Kórógy & environs" and the towns Eszék, Vukovár and Vinkovci. West-Slavonian diaspores= Hungarians in the former communes Verőce, Daruvár, Pakrác, Novszka, Grubisno Polje, Garesnica, Kutina, Belovár and Csázma. the rule of K. Khuen-Héderváry, the Croatian Ban 35 between 1883 and 1903 and hated by the Croats, provoked bitter and nationalistic resistance from the Croatian authorities, and of the local Croats and Serbs on the territory of the Croato-Slavonian Kingdom which belonged to the Hungarian Holy Crown. This frequently led to violent clashes between them and the newcomer Hungarians. The chauvinist representatives of south Slavic separatism considered the growing Hungarian peasantry who were buying up more and more land, as agents of "violent Magyarization" and used all means to prevent them from asserting their cultural and linguistic rights, and to render their living conditions as difficult as possible Ban= governor / viceroy of Croatia. The activities of K. Khuen-Héderváry as Croatian Ban were focused on a struggle against the national aspirations of Croats, and for the assertion of Hungarian political and economic influence, not ruling out autocratic rule and violence. In the course of his activities he successfully applied the method "divide et impera" in playing off Serbs against Croats. 36 See: Makkai B Református magyar iskola és szeretetház (Calvinist Hungarian school and rest-home) Vukovár ( ) - in: Arday L. (Ed.) Fejezetek a horvátországi magyarok történetéből, Teleki László Alapítvány, Budapest, pp , Makkai B. - Makkai Várkonyi I A "Szlavóniai Magyar Újság" és a horvátországi magyarság (The newspaper Szlavóniai Magyar Újság and the Hungarians in Croatia) ( ) - in: Arday L. (Ed.) Fejezetek a horvátországi magyarok történetéből, Teleki László Alapítvány, Budapest, pp
175 Figure 44. Change in the number of Hungarians in different parts of Croatia ( ) According to the data of the 1910 census, ethnic Hungarians were gathering ground not only in the autochthonous settlements around Kórógy but in the following areas located south of the Dráva River: the surroundings of Vukovár and Eszék, the Alsómiholjác-Szlatina-Našice triangle, the environs of Verőce, the area of Belovár- Grubišno Polje, and the Daruvár-Pakrác-Garešnica triangle 37 (Fig. 45.). In 1910 there was an absolute or relative Hungarian ethnic majority in 137 settlements out of the 6770 in present-day Croatia. Of these 112 were found south of the Dráva River. The most populous Hungarian communities were found in urban centres such as in the Hungarian port of Fiume on the Adriatic Coast (6,493), in the dynamically developing capital of Croatia, Zágráb (4,028), in the market centre of Eszék in the East Slavonian Hungarian ethnic settlement area in Baranya (3,729) and in the most important industrial town and railway junction of the Száva Region, Bród (2,538). In Baranya, north of the Dráva, which belonged to the Hungarian Kingdom, there was a shift in the ethnic structure in favour of the Germans in the first half of the 37 The most important settlements of the aullochthonous (immigrated) Hungarian population in 1910: in the surroundings of Vukovár: Lipovača, Marinci, Stari Jankovci, Srijemske Laze, Grabovo, Čakovci, Opatovac, Ivanci; in the surroundings of Eszék: Antunovac, Čepin, Orlovnjak, Palača, Šodolovci, Ludvinci, Dályhegy, Erdőd; Alsómiholjác-Szlatina-Našice triangle: Alsómiholjác, Viljevo, Martinci, Humljani, Slana Voda, Szlatina, Zdenci, Senkovac; in the surroundings of Verőce: Budakovac, Malo Gaćište, Sokolac, Detkovac, Novi Gradac, Terezino Polje, Rezovac; in the surroundings of Belovár-Grubišno Polje: Galovac, Mala Pisanica, Bedenik, Velika Pisanica, Lasovac, Grbavac, Grubišno Polje; Daruvár-Pakrác-Garešnica triangle: Pašijan, Popovac, Brekinjska, Gaj, Toranj, Lipik, Pakrác, Daruvár, Dežanovac, Imsovci, Kreštelovac, Sokolovac, Trojeglava, Babina Gora, Govedje Polje. 173
176 174 Figure 45. Ethnic map of the present-day territory of East Croatia (1910) Source: Census 1910
177 19 th century, while in the second half of the century the Hungarians dominated to the detriment of Croats and Shokatses. In the period between 1840 and 1880 the population of Croats and Shokatses with a low birthrate (one child per family) rose by a mere 13.7 % while the Germans expanded by 68.3 % during the same period. Their expansion was already spectacular in the 18 th century, especially in villages mixed with Serbs (e.g. Kácsfalu, Dárda, Baranyabán). In the era between 1880 and 1910 the Hungarians gained ground due to the natural assimilation of Croats and Germans and an influx of Hungarians from the Bácska region (Fig. 46.). By the end of this period (1910), a great number of Shokatses in Kiskőszeg, Darázs, and Izsép, and Germans in Vörösmart, Kiskőszeg, Dárda, Pélmonostor and Karancs declared themselves to belong to the state-forming nation, i.e. Hungarians. As a result, out of 51,616 inhabitants in the region of Croatian Baranya, 39.5 % declared themselves to be Hungarian together with 28 % Germans, 19.2 % Croats-Shokatses, and 12.1 % Serbs. Of the villages of Baranya there were 14 with a Hungarian ethnic majority, 10 German, 9 Croat-Shokats and 1 Serb 38. Of the villages in Baranya in 1910 the largest Hungarian communities were found at Vörösmart (2,072), Kiskőszeg (1,854) and Laskó (1,806). In Muraköz (Medjimurje) between the Mura and Dráva rivers, which belonged to Zala County in Hungary, and was traditionally inhabited almost exclusively by Croats, the number of those declaring themselves to be Hungarian mainly owing to the partial Magyarization of Croats living in Csáktornya and Perlak and a gradual settlement of Hungarians rose to 6,766 by North of the Dráva, but as part of the Croato-Slavonian County of Belovár- Körös, in some settlements in Gola (e.g. Zsgyála) an inverse process to the overall trend of Magyarization had been taking place for half a century, namely the Croatization of Hungarians 40. A similar process was under way in Légrád located nearby but part of Zala County. This settlement had had a Hungarian population from the Middle Ages until the 19 th century, but following the regulation of the Dráva river homes were transferred to the right side of the river (the Croatian settlement area). In a new geographical setting and owing to closer ties with the Croats, the settlement underwent Croatization (the number of Hungarians was 80 % in 1715 and it decreased to 32.4 % by 1910). At the end of the First World War the Serbian Army, supported by the troops of the Entente, regained control of the territory of Serbia and Montenegro. Then (between 38 Of the settlements of Baranya which have become separated since 1910 (small villages, manors, colonies groups of farmsteads etc.) 14 (e.g. Tikveš, Sokolovac, Mirkovac, Jasenovac, Sudaraž, Uglješ) had a Hungarian ethnic majority, while in a further three (Kneževo, Novi Čeminac, Širine) the majority was formed by Germans. 39 The number of Hungarians living in Muraköz increased from 2,343 to 6,766 between 1880 and 1910, in Csáktornya the respective figures were 828 and 2,433 during the same period. 40 On the territory of Gola a mere 34.3 % of the local population could speak Hungarian in 1910 (1900= 40%) and only 7.6 % declared themselves Hungarian native speakers (1900=29,7%). In the case of Zsgyála and Légrád see: Arday L Az északnyugat-horvátországi szórványokról (About the Hungarian diasporas in NW-Croatia) - in: Arday L. (Ed.) Fejezetek a horvátországi magyarok történetéből, Teleki László Alapítvány, Budapest, pp
 November 7 and 14, 1918) it occupied Syrmia, Slavonia and South Hungary (up to the Barcs-Pécs-Szeged-Arad line), and by December 25,")
178 Figure 46. Change in the ethnic structure of the Croatian Baranya ( ) November 7 and 14, 1918) it occupied Syrmia, Slavonia and South Hungary (up to the Barcs-Pécs-Szeged-Arad line), and by December 25, 1918 they had taken Muraköz. Alarmed by the advance of Italian troops towards Slovenian and Croatian ethnic territory, and by Serb territorial claims (Simović-Antonijević line 41 ), the State of Slovenes-Croats-Serbs (formed on the territory of the Austro-Hungarian Monarchy on October 29, 1918) eventually joined Serbia thus finishing the war on the victorious side. This led to the founding of the Kingdom of Serbs-Croats-Slovenes (SHS) on December 1, 1918, the boundaries of which were drawn up between September 1919 and November Of the areas belonging to present-day Croatia and which had been part of Hungary until 1918, the Muraköz (Medjimurje) was ceded from Hungary in the Trianon Peace Treaty (1920) owing to its predominantly Croatian population, and Baranya owing to its vicinity near Eszék and Shokats-Croatian villages 42. On the territory of present-day Croatian Baranya during the Serb occupation and at the time of annexation, 67.5 % of the population were Hungarian and German, and 31.3 % of them Croats and Serbs. The authorities of the occupying Serbs in Baranya as in Bácska and Bánát immediately started to eliminate traces of Hungarian statehood and to ruin local Hungarians politically and economically. Most Hungarian civil servants were dismissed, forced 41 Simović-Antonijević line: the western border of the territories claimed by Serbia in Croatia in October, 1918 in case of the possible Croatian rejection of unification with Serbia: Vitrovitica-Novska-Una river-knin-šibenik. See: Čović, B. /Ed./ 1991 Izvori velikosrpske agresije (Sources of the Great-Serbian aggression), Zagreb, 380p. 42 Darázs, Hercegmárok, Izsép, Dályok, Baranyavár, Benge, Lőcs, Petárda, Torjánc. 176
179 to retire or expelled. Hungarian schools, cultural institutions and financial intitutions were closed down. On February 25, 1919 an order was issued on the expropriation of the majority of large estates (predominantly in Hungarian and German ownership) i.e. of holdings over 500 cadastral holds (and not much later, of over 100). This measure, called "land reform", pursued national aims (it was a step to crush the Hungarian and German large landowners, and indirectly the peasants and working class of the same nationalities). It was also directed at social targets (to meet demands for land of the southern Slavs, primarily the Serbs). Hungarians found themselves almost totally excluded from the land reform; at the same time Hungarian workers, hired labourers, servants and tenants were chased away to provide room for Serbian and Croatian colonists, dobrovoljats and optants 43. The political situation led to massive migrations in opposite directions as reflected in the first Yugoslavian census (1921). On the present-day territory of Croatia the number of Croats and Serbs 44 had risen to 68.8 % and 16.9 %, respectively, while that of Hungarians had dropped to 2.3% (81,835). Due to flight, expulsions and the dissimilation of previously Magyarized people (e.g. some of the Germans), there was an increasing assimilation of the descendants of autochthonous Hungarians on the territory of the present-day Croatia, and 32.6 % fewer Hungarians were registered in 1921 than in In this period the town of Bród lost 78.9 % of its Hungarian inhabitants, Zágráb 70.1 % and Eszék 38.8%. Both West Slavonia 45 and East Slavonia 46 suffered considerable losses (-24.5 % and %, respectively). In the ceded Baranya the number of Hungarians fell by 18.4 %, (a loss of nearly 3,800 persons) which, apart from migration losses 47 was due to the return in the statistics of 1,500 formerly Magyarized Germans 48. The number and ratio of Hungarians in Baranya decreased to below 14,000 or 26.4 % owing to their low birthrate, intensified emigration, the dissimilation of the earlier Magyarized Shokatses 49 and Serbian statistical manipulations based on surname analysis Dobrovoljats: Serbian volunteer of the First World War who gained military distinction. Optant: Croats and Serbs having chosen the option of being resettled from Hungary to the Kingdom of Serbs-Croats-Slovenes. 44 Between the two world wars the Yugoslavian statistics did not distinguish between Serbs and Croats but recorded a unified "Serbo-Croatian" native tongue. An approximate division could be made on the basis of religious affiliation, i.e. Roman Catholic of "Serbo-Croatian" native tongue =Croat; Orthodox of "Serbo-Croatian" native tongue=serb. 45 West-Slavonia includes Verőce, Daruvár, Pakrác, Novszka, Grubisnopolje, Garesnica, Kutina, Belovár and Csázma districts. 46 It should be noted that in spite of the change in 1918, the autochthonous Hungarian villages of East Slavonia (e.g. Szentlászló, Haraszti, Lacháza) were able to further increase their population between 1910 and Ca Hungarians fled from the following settlements by 1921: Dárda, Kiskőszeg, Izsép, Laskó, Vörösmart. 48 Re-Germanization ( ): Vörösmart, Kiskőszeg, Bellye, Karancs. 49 In 1931 c. 500, earlier Magyarized Shokatses declared themselves to be Catholic "Serbo- Croatians" at Darázs, Hercegmárok and Dályok. 177
180 Parallel to the decrease in the number of Hungarians was that the new stateforming nation of Serbs had increased sharply ( : %). This might be attributed to the resettlement of the afore-mentioned volunteers (dobrovoljats) and optants within the framework of land reform 51. Besides the colonies established in the environs of Dárda, Kácsfalu and Bolmány, several hundred Serbs moved to Főherceglak, Pélmonostor, Karancs, Kő and Hercegszőlős which formerly had a Hungarian- German ethnic majority. Hungarians left without a job and expelled from Slavonia in the course of the land reform emigrated to Hungary, Germany, France and America, or moved to nearby big towns. Having lost their roots and contracted mixed marriages, they soon gave up their Hungarian identity. As a result of this migration the number of Hungarians increased by 83.2 % in Zágráb and by % in Eszék and Vinkovci between 1921 and 1931, while there was a % and -7.8% loss in West and East Slavonia, respectively. Owing to the severe demographic loss, by the 1931 Yugoslavian census only 69,671 persons, or 1.8 % of the total population was considered Hungarian on the present-day territory of Croatia. Areas from which Hungarians had fled or emigrated were also occupied by Serbs in Slavonia, who established several colonies on the former estates confiscated estates (e.g. Eltz, Khuen-Belasi, Pejačević) in the environs of Eszék, Vukovár, Alsómiholjác, Szlatina and Verőce 52. On March 27, 1941, following the coup d'état against the pro-german Cvetković government which had joined the three-power pact, Hitler gave the order to overrun Yugoslavia, then under Serbian hegemony, with the involvement of neighbouring countries. The military operations by the German and Italian forces against an unstable Yugoslavia 53 (with its extremely mixed ethnic structure) started on April 6, and the 50 'Surname analysis order of Svetozar Pribičević': According to this it was not allowed for the persons with surname of linguistically non-completely Hungarian origin to declare themselves - e.g. at the census or at the registration at school - as ethnic Hungarian (Nyigri I A visszatért Délvidék nemzetiségi képe (Ethnic Patterns in the Returned Southern Region) - in: A visszatért Délvidék, Halász, Budapest, 378.p.). 51 Serbs from Montenegro, Hercegovina and Hungary were predominantly settled in Southwest Baranya (e.g. to the Bellye estate) where, after expelling the Hungarian inhabitants of the confiscated land, 7 colonies were formed or repopulated on 2,141 cadastral holds (Novo Nevesinje, Majiške Medje, Novi Bolman, Zornice, Novi Jagodnjak,Uglješ, Švajcarnica). See: Nyigri I ibid. 385.p., Šimončić-Bobetko, Z Agrarna reforma i kolonizacija na području Baranje u medjuratnom razdoblju (Agrarian reform and colonization in Baranya in the interwar period) ( godine) - in: Tri stoleća Belja, JAZU, Osijek, Bognár A Stanovništvo Baranje (Population of Baranya), Geografski Glasnik , Zagreb 52 Serbs from the Croatian areas of Lika, Bosnia-Herzegovina and Montenegro and from Hungary, living in the vicinity of Eszék and Vukovár, were settled in colonies with a former Hungarian population: e.g. Antunovac Tenjski, Ovčara-Čepin, Divoš, Paulin Dvor, Šodolovci, Lanka-Petrova Slatina, Križevci-Karadžićevo, Ada, Mlaka Antinska, Palača, Silaš, Lipovača, Ludvinci, Djeletovci, Ivanci. See Gaćeša, N. L Agrarna reforma i kolonizacija u Sremu (Agrarian reform and colonization in Syrmia) , Novi Sad, 227.p. 53 The multi-ethnic S-H-S Kingdom was a centralized, militarist, Greater Serbian state, which subdued the national and autonomous movements of the frustrated Croats and Slovenes, of the 178
181 war officially ended with the capitulation of the latter on April 17. In the meantime the Independent Croatian State (NDH) was proclaimed on 10 April which meant the disintegration of Yugoslavia. The next day, Hungarian troops occupied the Baranya and Bácska regions which had virtually turned into a "no man's land" (they were annexed by Serbs in 1918 when they had had a relative Hungarian ethnic majority). In these areas, this time ceded by Hungary, provisional military rule was introduced and the pacification of the territories began: according to a governmental order issued on April 28, 1941, Serbs who had settled after December 31, 1918 and had not escaped were interned and expelled; as a result, their number fell by 2,600 persons compared with The number of Hungarians (in a minority position and having regained the status of a state-forming nation) was 18,648, that is 36 %, within the total population - due to the assimilation of some Germans and Croats (1,600 and 500 persons, respectively) 54. In Muraköz the reappearance of Hungarian civil servants and military personnel, and the "statistical change of identity" of many Croats in the urban centres led to a rise in the number of Hungarians to 6,334, i.e. 6.1%. On the right bank of the Dráva, in Légrád (ceded to Hungary in 1941) there was a halt in the Croatization process of Hungarians, and 44.6 % of the 2,624 total population declared themselves to be native Hungarian speakers and 91.4 % of them to be ethnic Hungarians in a new political situation which was favourable to Hungarians. The Hungarian authorities treated the Croatian minority politely (mainly for foreign political reasons). However, to secure a railway connection with Italy they occupied Muraköz 55 with a Croat ethnic majority, and this became a source of tension in Hungaro-Croatian inter-state relations between 1941 and That is why the position of the Slavonian Hungarians living in scattered settlements did not improve, but remained politically and culturally depressed, and they were forced to flee in great numbers from territories of the partisan war 56. On the territory of the Independent Croatian State which included historical Croatia-Slavonia, Bosnia-Hercegovina and a large part of Dalmatia, the Croatian Ustasha troops took their revenge on the 1.8 million Serbs (who accounted for 32 % of the total population of the country) for the oppression and humiliation suffered by the Croats between the two world wars. Inhabitants of Serbian colonies formed after 1919 i.e. Muslimans persecuted for religious reasons, of Macedons, of non-slavic Albanians and Hungarians. There was particularly bitter antagonism between the Serbs and Croats, the most populous rival ethnic groups and only a rather delayed attempt was made to appease them (formation of the autonomous Croatian Banate, August 1939). 54 According to the 1941 census, most Hungarians moved to Pélmonostor, Hercegszőlős, Baranyavár, Főherceglak, Bellye and Bolmány. Germans declared themselves to be Hungarian native speakers in great numbers in Vörösmart, Kácsfalu, Dárda, Bellye and Kiskőszeg, Croats-Shokatses in Darázs, Hercegmárok, Kiskőszeg. 55 The ratio of the Croats within the total population of Muraköz was 92.8 % in 1941 and 97.2 % in Due to the partisan war and to deportations the number of Hungarians in the districts of Pozsega, Nasice, and Szlatina decreased by 62.7 % between 1931 and
182 105,000 persons 57 were expelled between April and June Of the Serbs remaining in Slavonia, 33,089 persons were killed in concentration camps and in the partisan war, while the number of casualties in Croatian Krajina (Lika, Kordun, Banija) was 55, This ethnic pattern changed profoundly as a consequence of the change in military power from German-Croatian-Hungarian rule to the Soviet-Yugoslav regime, as the front line moved over the territory (October April 1945). About 52 % of Germans living in present-day Yugoslavia escaped from the approaching Red Army and the Yugoslav (Serbian) partisan troops as some German armed forces (in the units of Wehrmacht, SS or as refugees having been evacuated 59 ). The remaining Germans, deprived of their property, were taken to detention camps 60, and to some Hungarian villages in Baranya (e.g. Hercegszőlős, Laskó and Várdaróc) 61. As in the Bácska region in the first months following the change of power, internment, killing and the decimation of the local Hungarian population began ,323 Croats and 3,858 Serbs moved to the territory of Baranya, in place of expelled Germans between 1945 and 1948; 8,204 of them were settled there by the Croatian Ministry of Agriculture between 1946 and Most of these Croats had come from overpopulated Zagorje, Muraköz-Medjimurje, Slavonia and Dalmatia and found their new homes in Baranyabán, Laskafalu, Albertfalu, Pélmonostor, Dárda and Baranyaszentistván, while the majority of Serbian colonists of Slavonian origin went to Pélmonostor, Kácsfalu and Főherceglak. Although Hungarians in the Baranya region had suffered a loss of 2,400 people due to war and migration, and 200 people through assimilation, their number only dropped to 17 thousand because 1,000 Germans 64 declared themselves Hungarian in 1948 to avoid expulsion. Of the 39 settlements in Baranya 12 had a Hungarian ethnic 57 Serbian colonists were expelled predominantly from the Verőce, Szlatina, Alsómiholjác, Eszék, Vukovár, Vinkovci and Pozsega districts. See: Kurdulija, S Atlas ustaškog genocida nad Srbima (Atlas of the Ustasha genocide against the Serbs) , Privredne Vesti "Europublic", D.O.O. - Istorijski Institut SANU, Beograd, 64.p. 58 Kurdulija, S ibid., 82.p. 59 Pauli, S Berichte aus der Geschichte des Südostens... unter besonderer Berücksichtigung der Schicksale der Donauschwaben und Siebenbürger Sachsen von der Ansiedlung bis zur Vertreibung 1944/45, Langen, 259.p. 60 The most important detention camps established for Germans in Slavonia were in Tenje, Valpovo, Velika Pisanica. See: Bohmann, A Menschen und Grenzen Bd.2. Bevölkerung und Nationalitäten in Südosteuropa, Verlag Wissenschaft und Politik, Köln, 274.p. 61 Of the deported civilian Germans on the present-day territory of Croatian Baranya 2,761 persons died, accounting for 19,4 % of their number according to the 1941 census (Gesamterhebung zur Klärung des Schicksals der deutschen Bevölkerung in der Vertreibungsgebieten, Bd.III. 1965, München, pp ). 62 Matuska M A megtorlás napjai (The days of vendetta), Magyar Szó - Fórum, Újvidék-Novi Sad, pp Maticka, M Agrarna reforma i kolonizacija u Baranji (Agrarian reform and colonization in Baranya) godine - in: "Tri stoljeća Belje", JAZU, Osijek 64 Vörösmart, Karancs, Baranyabán, Bellye, Pélmonostor, Kiskőszeg. 180
183 majority, 17 of them were predominantly Croatian and 9 were prevailingly Serbian. The village of Hercegszőlős, which had been Hungarian for the past millennium, suddenly achieved a relative German majority in 1948 due to the provisional detention of 1,500 Germans expelled from surrounding settlements. Due to the migrations mentioned above, Baranya, with a two thirds share of Hungarians and Germans in its population until 1944, now had 56.9 % Croats and Serbs. Hungarians numbered 31.4 %, and Germans 8.3 %. In Slavonia the Serb colonists (those chased away by the Croatian Ustashas in 1941) returned, while due to the land reform 20,000 Croats moved to Eszék, 5,000 of them to Vinkovci and 4,000 to Vukovár, occupying vacancies caused by the escape and expulsion of local Germans. Owing to massive colonization and severe German and Hungarian losses, of the 690,000 population who inhabited the territory of present-day East Croatia in 1948, the ratio of Croats grew to 70.3 % (1931=54.5 %), while that of the Germans fell to 1.1 % (1931=11 %), and the Hungarians to 5.3 % (1931= 7.1 %). The number of Hungarians in Croatia decreased by 26.4 % between 1931 and 1948 and dropped to 51,297 by the end of the period. After living in a diaspora under intense Serbo-Croat lingual and political pressure, the Hungarians in Slavonia had suffered an even higher demographic loss (-31 % in East Slavonia and -41,4 % in West Slavonia). For the past half century, in the period between the 1948 and 1991 censuses, the demographic and ethnic geographical pattern of Hungarians in Croatia has been determined by several external factors influenced by geographic features of their settlement area (e.g. natural change, migration) and internal factors (statistical methods of registration, national policy of the state, mixed marriages, changes in the identity of the population, and natural assimilation). In the course of Yugoslavian socialist urbanization predominantly young people released from agricultural work in economically retarded, unviable villages in Hungarian ethnic areas, headed in large numbers for new ethnic and lingual urban environments, seeking employment. At the same time there was a migration of Hungarians from the Slavonian diaspora not only to large industrial towns in Croatia but also abroad, causing serious losses to local Hungarian communities. With the opportunity for work beyond the borders and the emergence of an economic crisis within Yugoslavia the first wave of emigration, then seen as temporary, took place between 1965 and During the past decades, up till 1991, there has been an accelerating fall in the number of Hungarians in Croatia recorded by the censuses. A particularly important factor was played by subjective considerations, including ethnic identity. Disguised by the ideology of proletarian internationalism, but in fact dictated by a national policy to make the country "Yugoslavian-Serbian-Croatian", emphasis was placed on developing an inferiority complex among Hungarians stemming from their minority situation, emphasising their rootlessness, and lack of opportunity. There was also great emphasis put on the reorganisation of the remains of the Hungarian school system, its "internationalization". Factors promoting natural assimilation were a change of language, a loss of national identity and mixed marriages in ever increasing numbers, especially in the Slavonian diaspora of Hungarians. Assimilation was made easier by the internal migration of the rural population looking for job opportunities and going to towns with a Croatian ethnic majority (mainly to Zágráb, Eszék, Vukovár and Vinkovci). 181
184 As a result of successful state propaganda glorifying everything Yugoslavian, suppressing minority cultures and languages and supported by mixed marriages, the ratio of people with an uncertain ethnic identity increased, especially among the younger generation. At the time of the 1961 population census a mere 0.4 % of Croatia's population were not able or willing to declare their ethnic affiliation, this ratio had increased to 8.8 % by After 1971 there was an opportunity for those with an uncertain ethnic identity, maybe as a result of coming from an ethnically mixed family, to declare themselves "Yugoslav". In the atmosphere of the 1991 census heated by nationalistic emotions a mere 2.2 % of the population of Croatia declared themselves "Yugoslav" in contrast with 8.2 % in For the above reasons the ratio of an ageing population declaring themselves to be ethnically Hungarian decreased to 22,355 persons, i.e. by 56.4 % between 1948 and Naturally, this fall affected Hungarian communities in different geographical settings. The loss was minimal (-30.8 %) in towns which were getting a continuous supply of immigrants from the villages. At the same time the diaspora in West and East Slavonia suffered a greater loss (-77,1 % and -75,2 %, respectively). During this period the rate of decline was about half among the autochthonous Hungarians of Baranya and Slavonian Kórógy and its environs (-47,4 % and -52,8%). Of the villages in Baranya with a traditional Hungarian majority, Bellye and Hercegszőlős became a focus of Croatian and Serbian resettlement and, as a result of development programs and assimilation Bellye had a Croatian majority by 1961, Hercegszőlős a Serbian majority by 1981, and Karancs a Serbian majority by In Slavonia, Lacháza kept its Hungarian majority until 1971, while Grbavac and Budakóc became Croatian in A general remark is also valid for the processes of the 19 th century, that Croatization gained ground most rapidly among Roman Catholic Hungarians, while Calvinists were more resistant and the strongest adherents to their Hungarian identity both in Slavonia and Baranya 65. THE PRESENT TERRITORY OF HUNGARIAN SETTLEMENT IN CROATIA A presentation of the situation in the territory of Hungarian settlement in Croatia between 1991 and 1998, which is overwhelmingly under Serbian control and affected by the civil war, seems to be a futile attempt owing to the present chaotic circumstances. According to the population census of March 31, 1991, immediately before the outbreak of the Serbian-Croatian war, the ethnic geographical characteristics of the Hungarians in Croatia were the following: 22,355 people (0.47 %) declared themselves to be Hungarian and there were19,684 (0.4 %) native Hungarian speakers on the territory of the present-day Republic of Croatia. Of those of Hungarian ethnicity 40 % (8,956) live in Baranya, 6.5 % (1,445) were residents of the Slavonian autochthonous Hungarian "ethnic island" of Kórógy, Szentlászló, Haraszti, Lacháza, while10.3 % (2,298) of them of the Dráva river. 65 This statement is true also in the case of Lutheran Hungarians in Légrád on the right bank 182
185 were town dwellers of Eszék, Vukovár and Vinkovci, and 26.6 % (5,943) were found in the 183
186 184 Figure 47. Ethnic map of East Croatia (1991) Source: Census 1991
187 Slavonian diaspora. Only 10 villages in Baranya 66 and 5 villages in Slavonia 67 were able to keep their absolute or relative Hungarian ethnic majority (Fig. 47.). The demographic future and ethnic survival of Hungarians in Croatia was already in question in the decades before the war. Apart from their catastrophic ageing 68 a mere 22.6 % of them (5,058 persons) lived in settlements where they numbered more than 50 % of the local population. At the same time, 54.8 % of them were struggling to retain their ethnic identity (rather hopelessly), where they did not even number 10 %. As a result of the Croatization of the younger Hungarian generations who have moved from rural areas into the towns, only 35.8 % of those declaring themselves to be Hungarian live in urban settlements. The number of Roman Catholics, most liable to become Croats, reached 72.4 %, while the number of Calvinists who are considered the most ardent supporters of national identity was 24.9 %. Calvinists prevailed in the Hungarian villages of Kórógy, Kopács, Várdaróc, Laskó and Csúza. Apart from the village of Vörösmart these settlements also had the most populous communities ( persons) of Hungarians in Croatia. The above-outlined ethnic spatial structure was eradicated by the Serbian- Croatian war which broke out in the spring of Following the ominous events 69 during the summer of 1991, the Yugoslav National Army (JNA), the local Serbian armed forces and paramilitary troops from Serbia occupied Baranya, the Serb ethnic areas of East Slavonia, and the Hungarian village of Kórógy between July 3 and September 3, On November 17, after nearly six months siege Vukovár fell 70, becoming a symbol of Croatian national defence. On November 24 after five months siege, the second most important settlement of Slavonian Hungarians, Szentlászló, was also taken by the Serbs. Thus, on the territory of East Croatia an area of 2,500 square km which was home to 99 thousand Croats, 69 thousand Serbs and 14 thousand Hungarians (almost the whole Hungarian settlement territory in Croatia) fell under the occupation of Serbian-Yugoslavian military forces, which subsequently became a "demilitarized area". But part of the "Republic of Serbian Krayina" came under the control of UNPROFOR and, later, UNTAES between April 10, 1992 and January 15, Approximately 68 % of Croats (about 16,000 persons) and % of Hungarians (c. 2,000 to 5,000 persons) in Baranya, (together 66 Absolute Hungarian majority (1991): Vörösmart, Nagybodolya, Csúza, Sepse, Laskó, Várdaróc, Kopács, Újbezdán. Relative Hungarian majority (1991): Kiskőszeg, Kő. 67 Absolute Hungarian majority (1991): Kórógy, relative Hungarian majority (1991): Szentlászló, Haraszti, Csák, Krestelovác. 68 The ageing index (number of elderly per 100 children) within the Hungarian community of Croatia as a total: (!). Within the total population of the country: 90.1, in Hungary: 92.2 (1991). At that time 29.8 % of Hungarians in Croatia were older than 60, while the same figure was 17.4 % for the whole of Croatia. 69 Proclamation of an independent Serbian Krajina (February 28, 1991), a bloody Serbian- Croatian clash at Borovo Selo (May 2, 1991), a plebiscite on the independency of Croatia (May 19, 1991), proclamation of the independence of Croatia (June 26, 1991). 70 See Crkvenčić, I. - Klemenčić, M Aggression against Croatia, Central Bureau of Statistics, Zagreb, pp
188 with those declaring themselves Yugoslav in 1991) fled to Hungary or behind the Croatian front line from the atrocities and destruction caused by Serbian paramilitary troops until March 1992 (Fig. 48.). Uncertainties concerning the number of refugees from Baranya stem from the fact that at the 1991 Yugoslav population census only 8,956 people dared to admit their Hungarian ethnicity; according to our estimations their number might have been c. 12,000. Croats and Hungarians were driven away in the greatest numbers from settlements of key importance and from the places of fiercest fighting (e.g. Bellye, Dárda and Pélmonostor). Due to the peripheral location of Hungarian settlements near the Danube, their ethnic composition had not changed considerably up to March 1992, with a few exceptions (e.g. Bellye, Kiskőszeg), i.e. no sizeable Serb population had settled here. The peripheral position, considered unfavourable during peace times, in the normal functioning of the economy, had proven to be "favourable" in saving the ethnic character of the villages. Naturally, this was corroborated by the Serbs striving to liquidate Croats not Hungarians who otherwise took a neutral position in most cases. After the occupation of the Croatian Baranya by the Serbs, 5,737 Serbs 71 who had escaped from Slavonia which was under Croatian control stayed until March Novi Sad, 81.p. 71 Ćurčić, S. - Kicošev, S Development of the population of Baranya, Beli Manastir - Figure 48. Hungarians and the War of 1991 in East Croatia 186
189 1992 in houses vacated by the Croats who had fled, and had originally appeared there as colonists in and were considered the main enemies (Pélmonostor, Dárda, Bellye, Baranyabán, Keskend, Laskafalu etc.). The autochthonous Croatian-Shokats villages in a peripheral position (e.g. Izsép, Dályok, Hercegmárok, Darázs, Lőcs) were hardly affected by the Serb colonization of , and they managed to retain their Croatian ethnic majority. According to the Serb population census carried out between January 27 and March 5, 1992 the population of Baranya was 39,482, 59.4 % of them Serbs, 19.5 % Croats, 17.5 % Hungarians and 1.2 % "Yugoslavs". Owing to their massive emigration there was a considerable drop in the number of Hungarians, but because of an even greater exodus of Croats, Hungarians increased their proportion in Kopács, Várdaróc and Vörösmart. Compared with 1991, the number of villages with a Hungarian ethnic majority remained unchanged (10), that of the Serbs rose to 30, while that of the Croats dropped to 10. This situation remained more or less unchanged until May and August1995, when the Croatian Army took back the vicinity of the West Slavonian Okučani and the Knin Krajina (North Dalmatia, Lika, Kordun, Banija), from where more than 200,000 Serbs 72 fled towards Serbia and Bosnia. Some of them settled in Baranya, East Slavonia and in West Syrmia. 16,000 of these Serbs had returned to their original place of residence by the beginning of 1998, while of those who had taken provisional shelter in Yugoslavia 19,500 people went back to Krajina. Of the roughly 100,000 (mainly Croat) refugees (of 1991) from the territories of Baranya and Slavonia, which eventually reintegrated into Croatia on January 15, 1998, 15,000 have returned to their original place of residence since the summer of The return of Hungarians has been a very slow process due to the disastrous local economic situation (e.g. ruined and looted property, a lack of job opportunities and schools), also due to many cases where Serbs have moved into their houses or flats, and other bureaucratic problems which are difficult to understand. In the present situation there is only a slight hope that maximum efforts will be made (both by the Croatian authorities and the affected Hungarian population) to restore the Hungarian ethnic spatial pattern which existed before the war, and to regenerate the Hungarian communities which proved their loyalty to the independent Croatia even by fighting in the war. 72 According to the General Staff of the Army of Serbian Krayina the number of Serbs in North Dalmatia, Lika, Kordun, Baniya and in West Slavonia (only Okučani region) was 274,000 in June See Republika Srpska Krajina (specijalni prilog), Vojska (Beograd), Br.11. mart, Source of data concerning refugees: Displaced persons and refugees in Republic of Croatia, Report of the Office of Displaced Persons and Refugees, Government of the Republic of Croatia, Zagreb, 11 May
190 Chapter 7 THE HUNGARIANS OF THE TRANSMURA REGION The southwestern area of Hungarian minority settlement in the Carpathian Basin is the Transmura Region 1 of Slovenia. At the time of the last census in 1991, 7,637 people in this territory declared themselves to be ethnic Hungarians and 8,174 to be Hungarian native speakers. This Hungarian minority makes up 0.06 % of Hungarians living in the Carpathian Basin and 0.3 % of Hungarians living outside the borders of Hungary. THE NATURAL ENVIRONMENT For over eight centuries the native Hungarian population of the Transmura Region in Slovenia has occupied the Lendva Basin, at the southern foot of the Lendva Hills (334 m) with vineyards covering about 500 hectares and the hills along the Kerka and Kebele: Vasi-hegyhát - Goričko ( m) (Fig. 49.). The most important rivers of the narrow Hungarian-inhabited borderland are the Mura, the Lendva, the Kebele, the Kerka streams. ETHNIC PROCESSES DURING THE PAST FIVE HUNDRED YEARS The Transmura Region is one of the borderland areas in the Carpathian Basin where the ethnic situation can be considered stable during the past one thousand years. At the end of the 15 th century, when the Hungarian-Wend (Slovene) ethnic border was approaching to its present-day location, towns and market towns of the region either had a Hungarian ethnic majority (Alsólendva, Dobrónak), or had a sizeable Hungarian population (Muraszombat, Felsőlendva). Starting in the 13 th century, landowners of the region (e.g. the Hoholds, known later as the Bánffy family, encouraged the resettlement 1 Transmura Region (Hungarian: Muravidék, Murántúl, Vendvidék, Slovenian: Prekmurje). Northeast borderland of Slovenia north of the Mura river, between Austria, Hungary and Croatia. This region includes the present-day settlements of Muraszombat /Murska Sobota and Alsólendva /Lendava with an area of 947 square kilometres and 89,855 inhabitants (1991). Between the 10 th century and 1919, then 1941 and 1945 as a part of Hungary; in the period and a region of Yugoslavia. Since then it belongs to the Republic of Slovenia. 187
191 Figure 49. Important Hungarian geographical names in the Transmura Region of the Slovenian and Wend population 2 to the uninhabited, wooded borderland (Hung. "gyepű") situated in the neighbourhood of the Alsó-Őrség (Lower Border Guard District). Thus, the settlement area had stabilized by the end of the 15 th century. The Hungarian-Slovene ethnic boundary was not much modified either by the warfare of the 16 th and 17 th centuries, nor by the occasional Turkish devastation. This is corroborated by the analysis of the census carried out in 1720, following the failure of the War of Independence (1711) led by F. Rákóczi II. At that time in the present-day Transmura Region, with its scarce population owing to the military campaigns, most tax-paying Hungarian households were registered in Dobrónak (52), Alsólendva (44) and Muraszombat, the latter with 22 Wend, 19 Hungarian and 5 German taxpaying households 3. 2 See map of M. Kos 1970 Agrarna kolonozacija Slovenske zemlje (Agrarian colonization of the Slovenian Lands) -in: Zgodovina agrarnih panog, I. Agrarno gospdarstvo, Gospodarska in družbena zgodovina Slovencev, SAZU, Ljubljana 3 Acsády I ibid. pp ,
192 The Hungarian-Slovene ethnic border in the Land of the Wends 4 remained relatively stable during the 18 th and 19 th centuries. Of the 73,800 population recorded at the time of the 1880 census, in the Transmura Region (the present-day Alsólendva and Muraszombat communities), 76.9 % was Slovene, while 17.8 % (13,159 persons) declared themselves to be native Hungarian speakers (Tab. 33.). Of the 176 present-day settlements of the region 29 had a Hungarian majority. Most Hungarians lived on "ethnically mixed territory" (EMT, according to official Slovene categorization) adjoining the Hungarian state border, where their proportion reached 86.2 % in During the period between 1880 and 1910, the Hungarian language symbolised social selfassertion and personal economic success, therefore 23 % of the 90,132-strong population of the Transmura Region declared themselves to be Hungarian in This Magyarisation was especially striking in important settlements (e.g. Muraszombat 1880: 13,4 %, 1910: 46,9 %, Alsólendva 1880: 73 %, 1910: 87 %), and in villages with a Slovene population also speaking Hungarian (e.g. Kebeleszentmárton, Bántornya, Rátkalak). These villages, together with Kisfalu were becoming Hungarian, while Alsójánosfa, Mezővár and Szárazhegy were becoming Slovene. Thus, the number of villages with a Hungarian majority rose from 29 to 30 in this period (Fig. 50.). Following World War I and the withdrawal of the Hungarian Red Army on August 12, 1919, the Army of the Kingdom of Serbs-Croats-Slovenes (SHS) occupied the Transmura Region. This was then annexed by the Peace Treaty of Trianon (in spite of the protest of the local Wend-Slovene population 5 ) to the new SHS Kingdom. This change of power involved the dismissal and expulsion of Hungarian civil servants and officials in charge of keeping public order, and even prior to that, the withdrawal of Hungarian military personnel, and the registration of about 4,000 Wends (who declared themselves to be Hungarian at the turn of the century) as Slovenes. Accordingly, in the 1921 Yugoslav census, the number of Hungarians was 14,065 and their proportion had decreased by 15.2 %. Between the two world wars there was an effort to Slovenise the Wend population who had shown their sympathy towards the Hungarian State and Hungarians quite openly. Another trend was the break up (and eventual elimination) of the Hungarian ethnic character of the borderland. Demographic aims were to be achieved through the settlement of Slovene civil servants in this area, and by the Slovene agricultural colonisation who had escaped from areas occupied by the Italians (Isonzo-Soča valley, and the vicinities of Gorizia and Istria). At this time the following Slovene colonies were established (mainly on land confiscated from the Hungarian aristocrats /e.g. from the Eszterházys): Petesháza ( ), Benica (1922), Lendvahosszúfalu ( Land of the Wends (Hungarian: Vendvidék, historical "Tótság"). This is the historical name of the region SW of Vas and Zala counties of the Kingdom of Hungary, in the neighbourhood of Styria, between the Rába and Mura rivers. It nearly corresponds to the present name of "Transmura Region". It was named by the local Slovene population (the"wends") whose ethnic development under Hungarian supremacy differed from the Slovens living between the Adriatic and the Mura rivers which was under German-Austrian rule until the middle of the 20 th century. See Kossits J A Magyar országi Vendus Tótokról (About the Wend-Slavs of Hungary), Tudományos Gyűjtemény V.pp and Sever, B Das Pomurje von A bis Z, Pomurska založba, Murska Sobota, 164.p.). 5 Fall E Jugoszlávia összeomlása (The collapse of Yugoslavia), Budapest, pp
193 Table 33. Ethnic structure of the population on the present territory of Transmura Region ( ) Year Total population Slovenes Hungarians Croats Others number % Number % number % number % number % , , , , , , , , , , , , , , , ,6 2, , , , , , , , , , , , , , , , , , , , , , , , , , , , , , , , Sources: 1880, 1910, 1941: Hungarian census data, 1921, 1931, : Yugoslav census data. Remarks: Italic figures: mother / native tongue data. 1934), Pincemajor, Zalagyertyános, Lendvahídvég (1925), and Kámaháza (1931) 6. In the interwar period the population of the underdeveloped Transmura Region with its low-fertility land, was separated by a rigid state border from the (Hungarian) Transdanubian region where they had previously found work. An increasing number emigrated to Germany, France and overseas, looking for work 7. Many landless Hungarians in the surroundings of Alsólendva were excluded from the Yugoslav land reform and were indirectly forced to emigrate. During World War II, following the occupation of Yugoslavia by the Germans, and its subsequent disintegration, the Transmura Region returned to Hungary and between April 16, 1941 and April 3, 1945 again formed part of the Hungarian counties of Vas and Zala. The new change of regime involved migration in the opposite direction of Hungarian and Yugoslav (Slovene) civil servants and military personnel. Due both to this and to the "Hungarophil" behaviour of the local Slovenes-Wends at the 1941 census, of the 82,400 population of the Transmura Region 20.4 % (16,852 people) declared themselves to be Hungarian and 77.2 % Wend native-speakers. Owing to the presence of Slovene colonists of the Interwar period, the proportion of Hungarians (82 %) on ethnically mixed territory (EMT) did not reach the level of 1910 (90.4 %). In the two largest centres of the region (Muraszombat and Alsólendva) the proportion of Hungarian native speakers was 39.8 % and 93.8 %, respectively (Tab. 34.). A striking phenomenon of this census was that nearly three quarters of the Slovene-Wend population, 6 Krajevni leksikon Slovenije IV. knjiga, Podravje in Pomurje, Državna Založba Slovenije, Ljubljana, 1980, 94., 101., 109., 110., 111.p., Sever, B ibid. 71.p. 7 Nyigri I. (Ed.) 1941 A visszatért Délvidék nemzetiségi képe (Ethnic Patterns in the Returned Southern Region), Halász Irodalmi és Könyvkiadóvállalat, Budapest, 537p. 190
194 Figure 50. Ethnic map of the present-day Slovenian-Hungarian borderland (1910, 1991) in an expression of solidarity with the Hungarian state, declared themselves to be ethnic Hungarians. As a consequence, in 1941, 77.6 % of the total population of the Transmura Region declared themselves to be ethnic Hungarians and 21.2 % ethnic Wends (Slovene), despite the fact that only 43.8 % of the total population could speak Hungarian and 80.1 % Wend (Slovene). The 23.9 % of bi-lingual speakers within the Transmura Region (in this case Hungarian and Wend) sometimes caused considerable fluctuation in statistics. During the years of World War II, apart from the war losses, the number of Slovenes declined somewhat owing to the internment of 668 indigenous Slovene colonists in Sárvár in June Meanwhile, Hungarian native speakers decreased due to the deportation of Magyarized Jews from Muraszombat and Alsólendva (366 persons in 1941) 8. 8 Sever, B ibid.. 71.p. 191
195 Table 34. Ethnic structure of the population of Alsólendva - Lendava ( ) Year Total population Slovenes Hungarians Croats Others number % number % number % number % number % , , , , , , , , , , , , , , , , , , , , , , , Sources: 1880, 1910, 1941: Hungarian census data, 1921, 1931, : Yugoslav census data. Remarks: Including Lendvahegy and Hármasmalom between Italic figures: mother / native tongue data. The change of power in April 1945 led to the migration of various layers of public administration (military personnel, civil servants, etc.), this time in the opposite direction. The Slovenes who had been interned returned and were joined by newcomers. These changes together with the intimidation of Hungarians by deportation meant that at the 1948 Yugoslav census a mere 10.8 % (10,246 persons) of the region's population decided to declare themselves to be Hungarian. On the ethnically mixed territory of the borderland, owing to the massive settlement of Slovenes (1941: 2,338 persons, i.e %; 1948: 5,712, 34.9 %), the proportion of ethnic Hungarians decreased to 61.4 %. The ethnic structure of Alsólendva, a district seat and a centre of Slovenian oil mining changed profoundly: within its present administrative area the proportion of Hungarians fell to 37.3 % in 1948 (1941: 93.8 % Hung.). Owing to Kámaháza, Pártosfalu and Kisfalu becoming overwhelmingly Slovene, the number of villages with a Hungarian majority population dropped to 22. Socialist industrialisation, urbanisation and change in lifestyle accelerated the mobility of the population, although unlike other socialist countries, most agricultural land remained in private ownership. The Hungarian population of the Transmura Region suffered from a declining natural increase, and with a sense of identity shattered by Yugoslav propaganda, began to leave its ethnically mixed settlement areas in increasing numbers, and, looking for job opportunities, became dispersed over the Transmura Region with its Slovene majority, or migrated to more distant areas of Slovenia (Muraszombat, Maribor, Celje, Ljubljana, etc.). During the period between the number of ethnic Hungarians living in the Transmura Region outside ethnically mixed territories had risen from 333 to 1,066, while that of the scattered Hungarians living west of the Mura River, in the inner areas of Slovenia had grown from 195 to 971. During the 1960s, 1970s and 1980s, with the possibility to work in and emigrate to the countries of western Europe, the number of Hungarians fell further. Since the 1974 constitution the political situation of local Hungarians has improved significantly, 192
196 but due to a natural decrease, ageing, emigration, the ongoing process of assimilation and loss of linguistic and ethnic identity, the Hungarians of the Transmura Region lost a quarter of their population between 1948 and THE PRESENT TERRITORY OF HUNGARIAN SETTLEMENT IN THE TRANSMURA REGION According to the last Yugoslav census (1991) the number of ethnic Hungarians and Hungarian native speakers in Slovenia was 8,503 and 9,240, respectively. The corresponding figures for the Transmura Region were 7,637 and 8,174 (8.5 % and 9.1 %). The 23 villages with a Hungarian ethnic majority and 24 with a majority of native Hungarian speakers are to be found in the ethnically mixed territory of the Hungarian- Slovene borderland (EMT) between Őrihodos and Pince. Here, ethnic Hungarians make up 50.3 %, and Hungarian native speakers form 52.5 % of the total population, which is the lowest ever figure % of the Hungarians of Slovenia and 89.9 % of those of the Transmura Region live in this zone. Hungarians represent a highly rural segment of the population in the Transmura Region, similar to the population as a whole (78.1 % of Hungarians live in villages, while 79.5 % of the total population lived in villages in 1991). In 1991, 80.8 % of younger Hungarians with higher qualifications who settled west of the Mura River in past decades were urban dwellers (in Ljubljana, Maribor, Celje, etc.). Reflecting physical geographical features of their area of settlement, 49.5 % of Hungarians live in tiny villages with less than 500 inhabitants, while 24.1 % of them inhabit small villages with a population of between , offering the most unfavourable conditions as regards local infrastructure and non-agricultural job opportunities. At the same time, this settlement pattern, which is characterised by an outflow of population, is responsible for maintaining a predominance of villages with an absolute Hungarian majority: 71.9 % of Hungarians live in such settlements. Ethnic (and native tongue) data testify that the largest Hungarian communities in the Transmura Region are Alsólendva 1,062 (1,221), Dobrónak 774 (783), Csentevölgy 498 (530), Lendvahosszúfalu 454 (473) and Petesháza 404 (422). 193
197 Chapter 8 THE HUNGARIANS OF BURGENLAND (ŐRVIDÉK) The most popular Hungarian name for Burgenland, the easternmost and also the youngest province of Austria, which is used by the Hungarians of that region, is Őrvidék ( border-guard region ) not to be confused with the name of the region of Upper (Felső-) Őrség. At the end of the First World War, this West Hungarian Transdanubian territory was referred to as Vierburgenland (the region of four counties), including the German names of towns there: Pozsony, Moson, Sopron and Vas counties as Pressburg, Wieselburg, Ödenburg and Eisenburg. After the Czech troops occupied Pozsony City in January 1919, only the name of Dreiburgenland (the region of three counties) was used. In 1921 it finally became part of Austria under the name of Burgenland. The name is appropriate, for numerous places of the historical Hungarian borderfortress chain (Fraknó, Kabold, Lánzsér, Léka, Borostyánkő, Szalónak, Németújvár, etc.) can be found in the 166 kilometre-long territory, which narrows to a width of 5 kilometres near Sopron. The number of the Hungarian descendants of the medieval defenders of the former western Hungarian borderland, who mainly inhabit the Upper (Felső-) Őrség region and Felsőpulya, numbered 6,763 according to the 1991 Austrian Every-day language ("Umgangssprache") census data. THE NATURAL ENVIRONMENT The physical geography of the province is open towards the East (Hungary) and relatively closed towards the West (the inner part of Austria). The Hungarians of the Upper (Felső-) Őrség region inhabit an area next to the Pinka and Szék Streams which flow through the South Burgenland Hill and the Terrace Land while the inhabitants of Felsőpulya live in the Felsőpulya Basin surrounded by the Kőszeg, Lanzsér and Sopron Mountains (Fig. 51.). The remaining Hungarians live mostly in Kismarton with a population in 1991 of 10,349 this is the capital of Burgenland at the southern foot of the Lajta Mountains, and in the Fertőzug region, located between the Hungarian border and Lake Fertő (Neusiedler See). The important rivers of the region are the Lajta, Vulka, Csáva, Répce, Gyöngyös, Pinka, Strém, Lapincs and Rába. Its internationally renowned still waters include Lake Fertő, the third largest lake in Europe. The 35 kilometre-long lake gathers waters from Northern Burgenland. The pebble basin of Lake Fertő, a great tourist attraction and also referred to as the Lake of the Viennese, dates back to the Ice Age and is 194
198 covered by close to one-hundred small lakes most of them part of a nature conservation area. ETHNIC PROCESSES DURING THE PAST FIVE HUNDRED YEARS As a result of settlement policies initiated by landowners to replenish the population on the estates within this borderland region, and owing to losses during warfare between kings Friedrich IV of Austria and Matthias Corvinus of Hungary, the Hungarian population formed a minority in the present-day territory of Burgenland by the end of the 15 th century. Boundaries of a subsequent German ethnic area had already been formed by this time (Fig. 52.). Apart from the much depleted Hungarian ethnic area (Fertőzug, patches in the Kismarton and Felsőpulya basins, in the Pinka Valley and Figure 51. Important Hungarian geographical names in Burgenland 195
199 Németújvár), Burgenland was inhabited entirely by German speaking people. The biggest Hungarian ethnic pocket in the environs of Felsőőr was connected with the Hungarian ethnic block of West Pannonia through a corridor stretching along the Pinka Valley 1. During the 16 th and 17 th centuries, as a consequence both of the Turkish campaigns (1529, 1532, 1664, 1683) and internal warfare, the Hungarian population which inhabited areas along military roads, river valleys and basins disappeared almost completely from the territory of Burgenland, except for the surroundings of Felsőőr and Felsőpulya. The survival of the Hungarians within these two ethnic pockets was ensured by the collective rights of nobility, which prevented the moving of foreigners into villages possessing such privileges or removing their collective land or property. 2 A planned settlement of Croatian refugees into depopulated villages started in 1533, immediately after the siege of Kőszeg, and lasted for one and a half centuries, primarily targeting the following estates: Vörösvár, Szalónak, Rohonc, Kismarton. The Croatian newcomers naturally moved not only to abandoned villages but also created new settlements in unpopulated woodland areas, e.g. Újhegy, Őridobra, Pónic, Horváthásos, Lipóc, Borosd. 3 After the Turkish wars and the War of Independence led by F. Rákóczi II, a repopulation of the devastated areas (firstly in Moson County) took place almost exclusively by resettling German colonists in the first half of the 18 th century. In some places, Hungarians were settled on the initiative of landowners, too (e.g. Felsőpulya, 1747). In the 1773 census, the present-day area of Burgenland was a Germanised region with both large and small Croatian ethnic blocks, and only ten settlements had a Hungarianspeaking majority. In the second half of the 18 th century, due to the boom in cereal growing, its the geographical position (the proximity of the Danube as a means of transport), and the closeness to the market at Vienna, manors on the big estates of Moson County and primarily in the Fertőzug, were established in great numbers, specialising in cattle breeding, cereal and sugarbeet growing. The inhabitants of these manors were recruited from among the landless Hungarians living on the neighbouring Kapuvár estate and in the Csallóköz 4 region. The mushrooming of manors inhabited by Hungarians (they numbered 7 in 1784, 14 in 1869 and 38 in 1930) turned the formerly homogeneous German area between Lake Fertő and Moson-Danube into an ethnically varied one. At the same time, the abolition of the collective privileges of the nobility in 1848 created a grave ethnic situation for the descendants of the medieval border guards (Felső Őrség, Felsőpulya) who lived in the central and southern areas of Burgenland. The abolition of collective land property rights which had earlier strengthened the collective sense of identity and preserved the original Hungarian ethnic pattern, now allowed the 1 Kovács M A Felsőőri magyar népsziget (The Hungarian Ethnic Pocket of Oberwart), Település és Népiségtörténeti Értekezések 6., Budapest. 2 Kovács M ibidem 3 Breu, J Die Kroatensiedlung im südostdeutschen Grenzraum, Wien 4 Csallóköz (Slovak: Žitný ostrov). Island in present-day South Slovakia, between the Danube and the Little Danube. 196
200 Figure 52. Ethnic map of the present-day territory of Burgenland (late 15 th century, 1773, 1910, 1991) 197
201 resettlement of Germans in the Hungarian ethnic pockets. Germans came from surrounding villages to these areas which were centres of transport and markets (Felsőőr, Felsőpulya). In some villages of mixed population this accelerated Hungarian assimilation (whose proportion in Vasjobbágyi, for example, was 57 % in 1828, 16 % in 1880 and 8 % in 1920). During the period following the Austro-Hungarian Compromise (1867), an event which curbed the process of Germanization, the first population census which also inquired about people s native language took place in The census of a total population of 266 thousand was taken on the territory of Burgenland; 78.8 % of them were Germans, 4.2 % (11,162 persons) were Hungarians and 16.1 % were Croats (Tab. 35.). Due to the high esteem of the Hungarian statehood, there was a greater emigration of local Germans. There was also a natural assimilation of non-hungarians between 1880 and 1910, thus the proportion of Hungarians within the population increased from 4..2 % to 9 %, while that of the Germans dropped from 78.8 % to 74.4 %. The ethnic pattern of the rural areas, compared with the state one hundred years before, did not change significantly, apart from a slow Germanization of ethnic Croatian pockets in the surroundings of Németújvár, and the appearance of several manors in Moson County. The Hungarian-German ethnic border remained unchanged. Similar to the present-day situation, an overwhelming majority of Hungarians living on Austrian territory lived not in Burgenland but in areas beyond the Lajta River, predominantly in Vienna. The imperial capital attracted the Hungarian aristocrats and their servants (also Hungarian) and, owing to the market opportunities, thousands of Hungarian craftsmen too. The number of Hungarians living in Vienna was 15 thousand in the 1840s, 30 thousand in 1890 and 45 thousand in Hungarian citizens of various ethnicities living in Vienna and its vicinity numbered 232 thousand in Table 35. Ethnic structure of the population on the present territory of Burgenland ( ) Total population "Germans" Hungarians Croats Others Year number % number % number % number % number % , , , , , , , , , , , , , , , , , , , , , , , , , , , , , , , , , , , , , , , , , , , , , , , , Sources: 1880, 1910, 1920: Hungarian census data (mother/native tongue), 1923, 1934: Austrian census data (language affiliation), 1951, 1961, 1971, 1981, 1991: Austrian census data (every-day language / Umgangssprache ). Remark: "Germans": German (native) speakers. 198
202 Following World War I, lost by Austria and Hungary, the Peace Treaty of Saint-Germain-en-Laye (September 10, 1919) gave the western part of Hungary with its predominantly German-speaking population to Austria. As a result of vehement Hungarian protest however, 'only' present-day Burgenland was ceded to Austria, following the plebiscite in Sopron and Pinka Valley which achieved favourable results for Hungary. Owing to the change of power, the Hungarian population of the province which had lived in language pockets since the 16 th century, was forced into a political minority after having been a state forming nation. Although the new state boundary did not hinder the maintenance of former economic, social and cultural contacts, the social strata which had the closest ties with the Hungarian state and nation or were not indigenous (civil servants, military personnel, police, railwaymen, teachers, workers, etc.) moved to the actual territory of Hungary in large numbers. Owing to this large-scale resettlement the number of native Hungarian speakers decreased by more than 10 thousand, i.e. by 39 %. This especially affected ethnic Hungarians who were scattered, while the native population of villages in Őrség had only decreased by a few hundred. The number of workers and farm labourers, who formed the lowest social strata among Hungarians in Burgenland, dropped drastically owing to their repatriation. This process continued through the 1920s owing to the mechanisation of farming on the big estates and the attraction of well-paying industrial work, particularly in Vienna. Even so, this latter migration and Hungarian political emigration could not counterbalance the rapid decline in the number of Hungarians living in Austria and Vienna following the disintegration of the Monarchy, and as a consequence of massive repatriation and emigration (Vienna; 1910: 45 thousand; 1923: 10,922; 1934: 4,844 Hungarians). Emigration and statistical manipulation (e.g. the registration of 6,507, overwhelmingly Hungarian-speaking Gypsies into a separate language category independent of their own declaration) showed that the number of Hungarians in Burgenland had fallen to the level of half a century before, according to the 1934 population census. By that time their most important settlement, Felsőőr (which acquired the status of a town in 1938) had lost its earlier absolute Hungarian majority owing to the ever intensifying immigration of Catholic German-speaking people (predominantly civil servants, merchants and craftsmen) (Tab. 36.). Following the German occupation of Austria (March 12-13, 1938), the Hungarians of Burgenland found themselves in a very different situation. The German administration abolished Burgenland as a province and its territory was divided between Styria and the Lower Danube imperial provinces (Steiermark, Niederdonau Reichsgaus). Parallel to the closure of Hungarian church schools, the use of the Hungarian language was restricted to family life by Nazi propaganda and national policy. The previous selfesteem of Hungarians, including aristocrats with great economic power, vanished. They started to feel the disadvantages of their minority status. A significant transformation in their thinking occurred among the younger generation, who in an increasingly fascist 199
203 climate felt their Hungarian origins to be shameful, particularly at school and in the army. 5 After World War II, in spite of Burgenland being under Soviet occupation, the frontier was sealed and border crossing points eliminated during the Hungarian communist Rákosi regime. In this way the ethnic groups of West Transdanubia, among them the Hungarians of Burgenland, lost their natural and traditional economic, social and inter-ethnic contacts and became cut off from their traditional market centres (e.g. Sopron, Szombathely). Apart from the economic disaster an even greater psychological and ethnic trauma was caused by the fact that the "iron curtain" and the communist powers in Hungary made the maintenance of previous ties with a Hungarian language environment and institutes of education impossible. The change of power in Hungary put the Hungarians of Burgenland in an awkward situation since "Hungarian" and "communist" had become synonymous in Austrian public opinion. On the other hand, for the Hungarian minority their homeland, which was falling behind Austria in its economic development, was only a symbol of their cultural home and of communism. 6 Thus, it can be understood that the number of those in Burgenland in the 1951 population census declaring Hungarian to be their everyday language had halved (from 10,442 in 1934 to 5,251). A similar fall was recorded among the Hungarians in Vienna of Austrian citizenship, who disguised their Hungarian origins ((1934: 1,042; 1951: 384). During the economic boom and industrialisation which followed the political treaty creating present-day Austria, and the later withdrawal of Soviet troops from the country (1955), the social mobility of the population (including the Hungarians in Burgenland) increased. This social transformation rapidly disrupted traditional rural ethnic communities which had evolved over centuries. Hungarians who had given up farming or retained it as a part-time occupation moved from villages to industrial centres, where they found themselves in a German speaking environment and became daily or weekly commuters. The abandonment of their birthplace involved an increasing use of German, and in the case of young people, a steady exchange of language and culture. 7 A spectacular loss of the Hungarian language came as a result of a general aversion towards the Hungarian communist system, and an attempt by Hungarians to avoid possible discrimination. The Hungarian language had no economic use and was also lost in a bid to do well at school and in the workplace and, naturally because of mixed marriages. The number of marriages between ethnic Hungarians and Germans accelerated the natural assimilation already within the family framework. In Alsóőr, the most Hungarian village in Burgenland, mixed marriages were 19 % in the period between and increased to 60.6 % in The ratio of mixed marriages and factors influencing 5 Baumgartner, G "Idevalósi vagyok" - "Einer der hierher gehört". Zur Identität der ungaricshen Sprachgruppe des Burgenlandes in: Baumgartner, G. et al. (Hg.) Identität und Lebenswelt. Ethnische, religiöse und kulturelle Vielfalt im Burgenland, Prugg Verlag, Eisenstadt, pp Henke, R Leben lassen ist nicht genug. Minderheiten in Österreich, Kremayr- Scherian, Wien 7 Suppan, A ibid. 200
204 Table 36. Change in the ethnic structure of selected settlements of Burgenland ( ) Year Total population "Germans" Hungarians Others number % number % number % number % Felsőőr - Oberwart , , , , , , , , , , , , , , , , , , , , , , , , , , , Alsóőr - Unterwart , , , , , , , , , Őrisziget - Siget in der Wart Felsőpulya - Oberpullendorf , , , , , , , , , , , , , , , , , , , Sources: 1880, 1900, 1910, 1920: Hungarian census data (mother/native tongue), 1923, 1934: Austrian census data (language affiliation), : Austrian census data (every-day language / Umgangssprache ). Remark: Felsőpulya includes Középpulya.. 201
205 natural assimilation were influenced to a large extent by the rate of immigration due to advantageous economic factors, job opportunities, and the geographical position of minority settlements. Most German-speaking settlers had gone to district centres such as Felsőőr and Felsőpulya, which in the first third of the 20 th century still had a Hungarian ethnic majority. As a consequence, Hungarians living in these settlements in mixed families numbered %. 8 At the time of a survey conducted by L. Somogyi (1964) based on the analyses and evaluations of family names, place of residence, origin and religious affiliation, the number of Hungarians in Burgenland was estimated to be 7,600 (as compared with the 5,642 Hungarians recorded during the 1961 census). People who settled here during the exodus following the 1956 revolution formed only a small number of those leaving their homeland and did not significantly add to the statistical number of Hungarians. On the contrary, owing to accelerated lingual assimilation, unfavourable demographic processes (ageing, mortality) and increasing emigration, the number of people speaking Hungarian as their everyday language (Umgangssprache) decreased from 5,673 to 4,147 between the 1971 and 1981 censuses (a drop from 2.1 % to 1.5 %). Comparing the trends prevailing in Burgenland with the number of Hungarians with Austrian citizenship living in Vienna, with its permanent supply of immigrants, a more favourable change can be observed (1951: 384; 1971: 6,099; 1981: 5,683). During the period between 1981 and 1991, a positive effect of the changes in the political system in Hungary was the increased self-awareness of the Hungarians living in Austria, and the "usefulness" of the Hungarian language. Also, due to an increase in the number of Hungarians settling in Austria following the fall of the "iron curtain", the total number of Hungarians with Austrian citizenship grew by 63.1 % (to 19,638), and that of noncitizens increased by % (to 13,821). Non-citizen Vienna residents of Hungarian origin doubled, moreover, in the environs of the Austrian capital and in Lower Austria there was a 7.4-fold increase. The number of autochtonous Hungarians in Burgenland, mainly in Felsőőr and Őrisziget, increased by 23.5 %, while Hungarians with Austrian and other citizenship rose by 63.1 %. THE PRESENT TERRITORY OF HUNGARIAN SETTLEMENT IN BURGENLAND (ŐRVIDÉK) At the time of the last Austrian census (1991) the number of people declaring Hungarian to be their everyday language was 33,459 (58.7 of them Austrian citizens). A mere 20.2 % of Hungarians residing in Austria, (i.e. 6,763 persons) live in their indigenous settlement area, in Burgenland. The overwhelming majority of Hungarians can be found scattered not only over the Lajta River area but also in Burgenland. Only 36.7 % of the Hungarian population inhabit the three settlements of Felső Őrség region (Felsőőr, Alsóőr and Őrisziget), forming a small language pocket. 8 Somogyi L Die burgenländischen Magyaren in geographischer Sicht, Karl-Franzens Universität, Graz, 279p. 202
206 Due to a high number of Hungarians in Burgenland residing in district centres (Felsőőr, Felsőpulya, Kismarton) the ratio of urban dwellers (47.3 %) far exceeded that of the total population (18.2 %) in % of these lived in settlements with 2,000-4,999 inhabitants, while 28.7 % of them inhabited settlements with 5,000-10,000 inhabitants. These are predominantly settlements offering better living conditions, but are more liable to immigration which affects the earlier ethnic pattern. Since the Hungarian majority vanished in Felsőőr and Felsőpulya half a century ago, only 13.2 % of Hungarians in Burgenland are residents of villages (Alsóőr, Őrisziget), where they represent an absolute majority % of them experience considerable German language pressure, living in settlements where their ratio does not reach 25 %. The most populous Hungarian communities of Burgenland are: Felsőőr (1,592), Alsóőr (669), Felsőpulya (631), Kismarton (257), Őrisziget (223) and Boldogasszony (215) (Fig. 53.). Figure 53. Hungarian communities in Burgenland (1923, 1991) 203
207 GEOGRAPHICAL REGISTER Hungarian and present official (Slovakian, Ukrainain, Rumanian, Serbian, Croatian, Slovenian, German) names with some English remarks. English abbreviations: R = physical geographical region; PL = plain, lowland; M = mountain, mount; H = hills; B = basin; C = cave; P = plateau; V = valley; PS = pass; S = swamp, marsh, moor; L = lake SLOVAKIA Relief names: Hungarian Slovakian Bodrogköz Medzibodrožie R Csallóköz Žitný ostrov R Csilizköz Čilizská mokraď R Dunamenti-alföld Podunajská nižina PL Garammenti-dombság Hronská pahorkatina H Gömbaszögi-barlang Gombasecká jaskýňa C Gömör-Tornai (Szlovák-)-karszt Slovenský kras M Fábiánszög (633 m) Fabiánka M Ipoly-medence Ipel ská kotlina B Ipolymenti-dombság Ipel ská pahorkatina H Jávoros Javorie M Karancs-Medves-vidék Cerová vrchovina M Karancs (728 m), Ragács (536 m) Karanč, Roháč M Kassai-medence Košická kotlina B Kelet-Szlovákiai-Alföld Východoslovenská nižina PL Kis-Kárpátok Malé Karpaty M Korponai-fennsík Krupinská planina P Losonci-medence Lučenecká kotlina B Lőcsei-hegység Levočské vrchy M Rima-medence Rimavská kotlina B Rozsnyói-medence Rožňavská kotlina B Selmeci-hegység Štiavnické vrchy M Somoskő Šomoška M 205
208 Szádelői-völgy Zádielská dolina V Szalánci-(Tokaj-Eperjesi-) hegység Slánske vrchy M Szepesi Magura Spišská magura M Szilicei-fennsík Silická planina P Szlovák-(Gömör-Szepesi-) érchegység Slovenské rudohorie M Tribecs (Zobor 588 m) Tribeč (Zobor) M Vihorlát Vihorlat M Zempléni-hegység (Csókás 469 m) Zemplínske vrchy (Rozhl adňa) M Hydrographical names: Hungarian Balog Bodrog Bódva Csermoslya Dudvág Duna Dunajec Fekete-víz Garam Gortva Hernád Ida Ipoly Kétyi-víz Kis-Duna Korpona-patak Kürtös-patak Laborc Latorca Murány Nyitra Ondava Ósva Párizsi-csatorna Rima Ronyva Sajó Szikince Tarca Slovakian Blh Bodrog Bodva Čremošná Dudváh Dunaj Dunajec Čierna Voda Hron Gortva Hornád Ida Ipeľ Kvetnianka Malý Dunaj Krupinica Krtiš Laborec Latorica Muráň Nitra Ondava Olšava Párižský kanál Rimava Roňava Slaná Sikenica Torysa 206
209 Torna Turóc Ung Vág Zsitva Turna Turiec Uh Váh Žitava Names of historical regions: Hungarian Abaúj Árva Bars Gömör Hont Kis-Hont Komárom Liptó Nógrád Nyitra Pozsony Sáros Szepes, Szepesség Torna Trencsén Turóc Zemplén Zólyom Slovakian Abov Orava Tekov Gemer Hont Malohont Komárno Liptov Novohrad Nitra Bratislava, Prešpork Šariš Spiš Turna Trenčín Turiec Zemplín Zvolen Settlement names: Hungarian Abaszéplak Abaújnádasd Abaújszina Alsóbodok Alsócsitár Alsólehnic Alsósajó Alsószecse Slovakian Košice-Krásna nad Hornádom Trstené pri Hornáde Seňa Dolné Obdokovce Nitra-Štitáre Červený Kláštor Nižná Slaná Dolná Seč 207
210 Alsószeli Alsózellő Ajnácskő Appony Aranyosmarót Assakürt Bakabánya Bánkeszi Barsbese Barslédec, Ladice Bártfa Bát Bátorkeszi Battyán Bazin Béke Bélabánya Bély Béna Bény Besztercebánya Bodrogmező, Polyán Bodrogszerdahely Bős Bussó Buzita Cífer Csáb Csákányháza Csallóközaranyos Csallóközcsütörtök Csata Cseklész Cselfalva Csetnek Csilizradvány Csíz Csörgő Debrőd Deménd Deregnyő Dévényújfalu Diósförgepatony Diószeg Dolné Saliby Dolné Zlievce Hajnačka Oponice Zlaté Moravce Nové Sady Pukanec Bánov Beša Ladice Bardejov Bátovce Vojnice Boťany Pezinok Mierovo Banská Belá Biel Belina Bíňa Banská Bystrica Poľany Streda nad Bodrogom Gabčíkovo Bušince Buzica Cífer Čebovce Čakanovce Zlatná na Ostrove Štvrtok na Ostrove Čata Bernolákovo Čelovce Štítnik Čiližská Radvaň Číz Čerhov Debraď Demandice Drahňov Bratislava-Devínska Nová Ves Orehová Potôň Sládkovičovo 208
211 Divény Dobóca Dobsina Dunacsún Dunaszerdahely Ebeck Éberhard Egyházfa Ekecs Ekel Előpatony Eperjes Érsekújvár Eszkáros Farnad Fél Feled Felka Felsőfalu Felsőhosszúfalu Felsőszecse Felsőszeli Fülek Fülekkovácsi Fülekpilis Fülekpüspöki Galánta Galgóc Gálszécs Garamdamásd Garamszentkereszt Garany Gázlós Ghymes Girált Gömörhosszúszó Gömörnánás Gömörsid Gúta Gyetva Gyügy Hardicsa Hárskút Hernádcsány Divín Dubovec Dobšina Bratislava-Čuňovo Dunajská Streda Obeckov Malinovo Kostolná pri Dunaji Okoč Okoličná na Ostrove Lehnice-Masníkovo Prešov Nové Zámky Skároš Farná Tomášov Jesenské Poprad-Veľká Chvalová Dlhá Horná Seč Horné Saliby Fil akovo Fil akovské Kováče Pleš Fil akovo -Biskupice Galanta Hlohovec Sečovce Hronovce-Domaša Žiar nad Hronom Hraň Brodské Jelenec Giraltovce Dlhá Ves Gemerský Sad-Nováčany Šíd Kolárovo Detva Dudince Zemplínske Hradište Lipovnik Čaňa 209
212 Hernádtihany Hódi Holics Homonna Horvátgurab Horvátjárfalu Igló Illésháza Illava Ipolybalog Ipolyhídvég Ipolynyék Ipolyság Ipolyszakállas Ipolyvisk Jánok Jászó Jéne Jóka Jolsva Jolsvatapolca Kapi Kárpáthalas Kassa Kassaújfalu Kasza Kátó Kéménd Késmárk Királyhelmec Kisdobra Kisgéres Kisperlász Kisszalánc Kisszeben Kisvisnyó Kolon Komárom Komját Korompa Korpona Köbölkút Kőhegy Körmöcbánya Košice-Ťahanovce Galanta-Hody Holíč Humenné Chorvátský Grob Bratislava-Jarovce Spišská Nová Ves Nový Život-Eliášovce Ilava Balog nad Ipl om Ipel ské Predmostie Vinica Šahy Ipel ský Sokolec Vyškovce nad Ipl om Janík Jasov Janice Jelka Jelšava Gemerské Teplice Kapušany Vištuk Košice Košice-Košická Nová Ves Košeca Kátov Kamenín Kežmarok Král ovský Chlmec Dobrá Malý Horeš Prihradzany Slančík Sabinov Višňové Koliňany Komárno Komjatice Krompachy Krupina Gbelce Lukovištia Kremnica 210
213 Krasznahorkaváralja Kural Kürt Lamacs Lasztóc Lednic Leibic Lelesz Léva Lice Losonc Losoncapátfalva Lőcse Lukanénye Madar Malomszeg, Nyitramalomszeg Marcelháza Margonya Mászt Mecenzéf (Alsó- and Felsőmecenzéf) Megyercs Meleghegy Mikolcsány Mocsonok Modor Mohi Muzsla Nádszeg Nagyazar Nagybalog Nagycétény Nagyemőke Nagyfödémes Nagyida Nagykapos Nagykövesd Nagykürtös Nagylég Nagymagyar Nagymegyer Nagymihály Nagyölved Nagyrőce Nagysalló Krasnohorské Podhradie Kuraľany Strekov Bratislava-Lamač Lastovce Lednica Kežmarok-Ľubica Leles Levice Licince Lučenec Opatová Levoča Nenice Svodín Lipová-Mlynský Sek Marcelová Marhaň Stupava-Mást Medzev Čalovec Teplý Vrch Gemerský Sad-Mikolčany Močenok Modra Mochovce Mužla Trstice Veľké Ozorovce Vel ký Blh Vel ký Cetín Nitra-Veľké Janíkovce Vel ké Uľany Vel ká Ida Vel ké Kapušany Vel ký Kamenec Veľký Krtíš Lehnice Zlaté Klasy-Rastice Vel ký Meder Michalovce Vel ké Ludince Revúca Tekovské Lužany 211
214 Nagysáros Nagysenkőc Nagysúr Nagysurány Nagyszilva Nagyszombat Nagytapolcsány Nagytárkány Nagytoronya Nahács Naszvad Negyed Nemesócsa Németbél Németgurab, Magyargurab Németpróna Nyárasd Nyitra Nyitracsehi Nyitragerencsér Nyitranagykér Nyitraújlak Óbars Ógyalla Ómajor Oroszka Oroszvár Osgyán Ószombat Ótura Örsújfalu Özdöge Palást Pálóc Pány Panyidaróc Párkány Pécsújfalu Pelsőc Pelsőcardó Perbenyik Perbete Perse Pográny Veľký Šariš Šenkvice Šúrovce Šurany Veľký Slivnik Trnava Topoľčany Vel ké Trakany Veľká Trňa Naháč Nasvady Neded Zemianska Olča Veľký Biel-Malý Biel Veľký Grob Nitrianske Pravno Topol níky Nitra Nitrany-Čechynce Nitra-Hrnčiarovce Veľký Kýr Veľké Zalužie Starý Tekov Hurbánovo Majere Pohronský Ruskov Bratislava-Rusovce Ožďany Sobotište Stará Tura Komárno-Nová Stráž Mojzesovo Plášťovce Pavlovce nad Uhom Paňovce Panické Drávce Štúrovo Pečovská Nová Ves Plešivec Ardovo Pribeník Pribetá Prša Pohranice 212
215 Poprád Pozsony Pozsonyhidegkút Pozsonyivánka Pozsonyligetfalu Pozsonypüspöki Pólyi Privigye Pusztafödémes Radács Ragyolc Rimaszécs Rimaszombat Rozsnyó Sajógömör Sajószentkirály Sáró Sasvár Selmecbánya Selpőc Sempte Somorja Somos Sőreg Strázsa Süvete Szádalmás Szádudvarnok Szakolca Szaláncújváros Szántó Százd Szenc Szentgyörgy Szentistvánfalva Szepesbéla Szepesszombat Szepesváralja Szepsi Szered Szilice Szilvásújfalu Szimő Szomotor Poprad Bratislava Bratislava-Dúbravka Ivanka pri Dunaji Bratislava-Petržalka Bratislava-Podunajské Biskupice Poľov Prievidza Pusté Uľany Radatice Radzovce Rimavska Seč Rimavska Sobota Rožňava Gemer Král Šarovce Šaštín Banská Štiavnica Šelpice Šintava Šamorín Drienov Šurice Poprad-Stráže pod Tatrami Šivetice Jablonov nad Turnou Zádielské Dvorniky Skalica Slanské Nové Mesto Santovka Sazdice Senec Svätý Jur Popudiny Spišská Belá Poprad-Spišská Sobota Spišské Podhradie Moldava nad Bodvou Sered Silica Slivník Zemné Somotor 213
216 Szőgyén, Magyar- and Németszőgyén Sztropkó Taksonyfalva Tany Tardoskedd Tasolya Tiszacsernyő Tonkháza Torna Tornalja Tornaújfalu Tornóc Tótmegyer Tőketerebes Trencsén Udvard Ugróc, Zayugróc Újbánya Újgyalla Újlót Ungpinkóc Uzapanyit Ürmény Vágfarkasd Vágmagyarád Vágpatta Vágsellye Vaján Vajka Vámosbalog, Alsó- and Felsőbalog Vámosladány Varannó Várad Várgede Várhosszúrét Várkony Vásárút Verebély Vilke Vízkelet Zemplén Zohor Zólyom Zselíz Svodín Stropkov Matúškovo Tôň Tvrdošovce Tašuľa Čierná nad Tisou Nový Život-Tonkovce Turnianské Podhradie Tornal a Nova Bodva-Turnianska Nova Ves Trnovec nad Váhom Palárikovo Trebišov Trenčín Dvory nad Žitavou Uhrovec Nová Baňa Dulovce Veľké Lovce Pinkovce Uzovská Panica Mojmírovce Vlčany Trnava-Modranka Pata Šal á Vojany Vojka nad Dunajom Veľký Blh Mýtne Ludany Vranov nad Topľou Tekovský Hrádok Hodejov Krásnohorská Dlhá Luka Vrakúň Trhové Mýto Vráble Vel ká nad Ipl om Čierný Brod Zemplín Zohor Zvolen Želiezovce 214
217 Zsemlér Zsére Zsitvabesenyő Zsitvafödémes Zsolna Zsolnalitva Žemliare Žirany Bešenov Úľany nad Žitavou Žilina Lietava TRANSCARPATHIA (UKRAINE) Relief names: Hungarian Ukrainian Alföld (Kárpátontúli-alföld) Zakarpatska nizovina PL Avas Avaš M Borló-Gyil Veliki Dil M Máramarosi-havasok Horhany, Krasna, Svidovec, Čornohora M Nagyszőlősi-hegység Sevljušska Hora M Pojána-Szinyák Makovicja M Tatár-hágó Jablunickij perevil PS Tiszahát R Vereckei-hágó Vereckij perevil PS Hydrographical names: Hungarian Borzsa Latorca Nagyág Szernye Talabor Tarac Tisza (Fehér-, Fekete-) Ung Ukrainian Boržava Latorica Rika Sirne Terebja Teresva Tisa (Bila-, Čorna) Už 215
218 Names of certain historical regions: Hungarian Bereg Máramaros Ugocsa Ung Ukrainian Bereh Marmaroš Uhoča Už Settlement names: Hungarian Akli Aknaszlatina Baranya Barkaszó Batár Bátyú Beregdéda Beregrákos Beregsom Beregszász Beregszentmiklós Beregújfalu Bótrágy Bustyaháza Csap Csepe Csikósgorond Csomafalva Csongor Csonkapapi Dercen Eszeny Fancsika Feketeardó Felsőschönborn, Felsőkerepec Fornos Gát Gyertyánliget Huszt Ukrainian Solotvina Baranincy Barkasove Bratove Vuzlove, Bateve Didove Rakošin Derenkovec Berehove Činadieve Nove Selo Batraď Buština Čop Čepa Čikoš-Horonda Zatisivka Čomanin Popovo Drisina Eseň Fančikove Čornotisiv Verchnij Koropec Liskove Hat Kobilecka Poljana Hust 216
219 Ilosva Izsnyéte Karácsfalva Kerekhegy Kétgút Királyháza Királymező Kisbakos Kisbégány Kisdobrony Korláthelmec Kovászó Kőrösmező Leányfalva, Beregleányfalva Makkossjánosi Mátyfalva Mezőkaszony Munkács Munkácsújfalu, Alsóschönborn Nagybakos Nagybégány Nagybereg Nagyberezna Nagybocskó Nagydobrony Nagymuzsaly Nagypalád Nagyszőlős Németkucsova Németmokra Nevetlenfalu Nyárasgorond Perecsény Pósaháza Rafajnaújfalu Rahó Rát Salánk Szerednye Szernye Szolyva Szőlősvégardó Szürte Taracköz Iršava Žňatine Karačin Okruhla Harazdivka Koroleve Ust Čorna Bakoš Mala Bihaň Mala Dobroň Holmec Kvasove Jasiňa Lalove Ivanivka Matieve Kosini Mukačeve Nove Selo Svoboda Velika Bihaň Berehi Velikij Bereznij Velikij Bičkiv Velika Dobroň Mužievo Velika Palad Vinohradiv Kučava Komsomolsk Ďakove Ňaroš Horonda Perečin Pavsin Rafajlovo Rahiv Rativci Šalanki Seredne Rivne Svaljava Pidvinohradiv Strumkivka Teresva 217
220 Técső Tekeháza Tiszabogdány Tiszacsoma Tiszapéterfalva Tiszasalamon Tiszaszászfalu Tiszaújlak Ungvár Vári Visk Zápszony Ťačiv Tekove Bohdan Čoma Petrove Solomonove Sasove Vilok Užhorod Vary Viškove Zapsoň TRANSYLVANIA (RUMANIA) Relief names: Hungarian Rumanian Alföld (Nyugati-alföld) Câmpia Vest PL Almás-hegység Munţii Almăjului M Aradi-síkság Câmpia Aradului PL Avas Munţii Oaşului M Barcasági-medence Depresiunea Bârsei B Baróti-hegység (Görgő 1017 m) Munţii Baraolt (Gurgău) M Belényesi-medence Depresiunea Beiuşului B Béli-hegység Munţii Codru-Moma M Bihar-hegység (Bihar 1849 m) Munţii Bihorului M Bodoki-hegység (Kömöge 1241 m) Munţii Bodoc (Cărpiniş) M Borgói-havasok Munţii Bârgăului M Brassói havasok Munţii Bârsei+Munţii Ciucaş M Csukás 1954 m Ciucaş Nagykőhavas 1843 m Piatra Mare Bucsecs Munţii Bucegi M Bükk Culmea Codrului M Cibles Munţii Ţibleşului M Csíki-havasok Munţii Ciucului+Munţii Tarcăului M Tarhavas 1664 m Grinduşu Sajhavasa 1553 m Gura Muntelului 218
221 Csíki-medence Depresiunea Ciucului B Erdélyi-érchegység Munţii Metaliferici M Érmellék Câmpia Ierului PL Fogarasi-havasok Munţii Făgăraşului M Godján Munţii Godeanu M Görgényi-havasok Munţii Gurghiului M Fancsaltető 1684 m Fâncelul Mezőhavas 1776 m Saca Gutin Munţii Gutâului M Gyalui-havasok Munţii Gilău+Muntele Mare M Gyergyói-havasok Munţii Giurgeului M Siposkő 1567 m Arbore Gyergyói-medence Depresiunea Giurgeului B Hargita Munţii Harghita M Madarasi-Hargita 1800 m Harghita-Mădăraş Kakukkhegy 1558 m M. Cucului Nagycsomád 1301 m Ciomatul Mare Háromszéki-havasok Munţii Vrancei+Munţii Buzăului M Lakóca 1777 m Lăcăuţi Háromszéki-medence Depresiunea Târgu Secuiesc B Kászoni-medence Depresiunea Plaeşi B Kelemeni-havasok Munţii Călimani M Király-erdő Munţii Pădurea Craiului M Királyhágó Pasul Ciucea PS Királykő Munţii Piatra Craiului M Kőhát (Rozsály 1307m) Munţii Ignuşului (Igniş) M Kőrösmenti-síkság Câmpia Crişurilor PL Krassó-Szörényi-érchegység Munţii Semenicului+ Munţii Aninei+M. Dognecei M Szemenik Semenic Kudzsiri-havasok Munţii Şureanu M Küküllők-menti-dombság Podişul Târnavelor H Lápos-hegység Munţii Lăpuşului M Lippai-dombság Podişul Lipovei H Lokva-hegység Munţii Locvei M Máramarosi-havasok Munţii Maramureşului M Máramarosi-medence Depresiunea Maramureşului B Meszes-hegység Munţii Meseş M Mezőség Câmpia Transilvaniei PL Nagy-Hagymás-hegység Munţii Hăşmaşu Mare (Curmături) M Nagy-Hagymás 1792 m Hăşmaşul Mare Egyeskő 1608 m Piatra Singuratică Öcsémtető 1707 m Hăşmaşul Mic Nagy-Cohárd 1506 m Suhard 219
222 Nemere-hegység Munţii Nemirei M Nemere 1649 m Nemira Nagy-Sándor 1640 m Şandorul Mare Páreng-hegység Munţii Parângului M Persányi-hegység (Várhegy 1104 m) Munţii Perşani (Vf. Cetăţii) M Petrozsényi-medence Depresiunea Petroşani B Pojána-Ruszka Munţii Poiana Ruscăi M Radnai-havasok (Ünőkő 2279 m) Munţii Rodnei (Ineu) M Retyezát-hegység Munţii Retezatului M Rétyi-nyír Mestecănişul de la Reci R Réz-hegység Munţii Plopişului (Şeş) M Szár-kő Munţii Tarcului M Szatmári-síkság Câmpia Someşului PL Szebeni-havasok Munţii Cindrelului M Temesi-síkság Câmpia Timişului PL Tordai-hasadék Cheile Turzii PS Torjai-büdösbarlang Peştera de sulf Turia C Torockói-hegység (Székelykő 1128m) Munţii Trascăului (Piatra Secuiului)M Vlegyásza Munţii Vlădeasa M Vulkáni-hegység Munţii Vâlcanului M Zarándi-hegység Munţii Zărandului M Hegyes 798 m Highiş Drócsa 836 m Drocea Hydrographical names: Hungarian Almás Aranka Aranyos Béga Békás Berettyó Berzava Bodza Borsa Cserna Ér Fehér-Kőrös Fekete-Kőrös Feketeügy Rumanian Almaş Aranca Arieş Bega Bicaz Barcău Birzava Buzău Borşa Cerna Ier Crişul Alb Crişul Negru Râul Negru 220
223 Füzes Fizeş Gyilkos-tó Lacu Roşu L Hortobágy Hârtibaciu Iza Iza Kapus-patak (Kalotaszegen) Căpuş Kapus-patak (Mezőségen) Lechinţa Kászon Caşin Kis-Küküllő Târnava Mica Kis-Szamos (Hideg-, Meleg-Szamos) Someşul Mic (Someşul Rece,Cald) Kölesér Culişer Kraszna Crasna Lápos Lăpuş Ludas Luduş Maros Mureş Medve-tó (Szováta) Lacu Ursu L Mohos-láp Mlastina Mohoş S Nádas Nadăş Nagy-Homoród Homorodul Mare Nagy-Küküllő Târnava Mare Nagy-Szamos Someşul Mare Néra Nera Nyárád Niraj Olt Olt Ompoly Ampoi Pogányos Pogăniş Sajó Şieu Sebes-Kőrös Crişul Repede Szamos Someş Székás Secaş Szent Anna-tó Lacul Sfânta Ana L Sztrigy Strei Tatros Trotuş Temes Timiş Tisza Tisa Tömös Timiş Túr Tur Vargyas Vârghiş Visó Vişeu Zsil Jiu 221
224 Names of historical regions: Hungarian Alsó-Fehér Arad Aranyosszék Bánát Beszterce-Naszód Bihar Csík Doboka Felső-Fehér Gyergyó Háromszék Hunyad Kalotaszeg Kászon Kolozs Közép-Szolnok Kővárvidék Krassó-Szörény Kraszna Küküllő Máramaros Maros Szatmár Szeben Szilágy, Szilágyság Szolnok-Doboka Szörény Torda Zaránd Rumanian Alba de Jos Arad Scaune de Arieş Banat Bistriţa-Nasăud Bihor Ciuc Dăbâca Alba de Sus Giurgeu Trei Scăune Hunedoara Călata Caşinu Cluj Solnocul de Mijloc Chioar Caraş-Severin Crasna Târnava Maramureş Mureş Satu Mare Sibiu Sălaj Solnoc- Dăbâca Severin Turda Zarand Settlement names: Hungarian Abrudbánya Ádámos Ágya Aknasugatag Rumanian Abrud Adamuş Adea Ocna Şugatag 222
225 Ákos Algyógy Alsóbölkény Alsórákos Alvinc Anina Apáca Apahida Arad Aranyosbánya Aranyosegerbegy Aranyosgyéres Árapatak Árpád Árpástó Avasújváros Bácsi Bácsfalu Bágyon Balánbánya Balavásár Balázsfalva Bálványosváralja Bályok Bánffyhunyad Barót Bátos Batiz Belényes Belényessonkolyos Belényesújlak Bélfenyér Béltek Bereck Berény Beresztelke Berettyószéplak Beszterce Bethlen Bethlenszentmiklós Bihar Bihardiószeg Bodola Bogártelke Acăţari Geoagiu Beica se Jos Racoş Vânţul de Jos Anina Apaţa Apahida Arad Baia de Arieş Viişoara Câmpia Turzii Vâlcele Arpăşel Braniştea Oraşu Nou Băcia Săcele-Baciu Bădeni Bălan Bălăuşeri Blaj Unguraş Balc Huedin Baraolt Batoş Botiz Beiuş Şuncuiş Uileacu de Beiuş Belfir Beltiug Breţcu Beriu Breaza Suplacu de Barcău Bistriţa Beclean Sânmiclăuş Biharia Diosig Budila Băgara 223
226 224 Bogdánd Bogdand Boksánbánya Bocşa Bonchida Bonţida Bonyha Bahnea Borosjenő Ineu Borossebes Sebiş Borsa Borşa Borszék Borsec Bós, Kolozsbós Boju Bölön Belin Börvely Berveni Brassó Braşov Buziásfürdő Buziaş Bürkös Bârchiş Cegőtelke Ţigău Csanálos Urziceni Csák Ciacova Csávás Ceuaş Csernakeresztúr Cristur Csernátfalu Săcele-Cernatu Csernáton Cernat Csíkszentdomokos Sândominic Csíkszentkirály Sâncraieni Csíkszentmárton Sânmartin Csíkszenttamás Tomeşti Csíkszépvíz Frumoasa Csíkszereda Miercurea Ciuc Dés Dej Désakna Ocna Dejului Detta Deta Déva Deva Dezmér Dezmir Dézsánfalva Dejan Dicsőszentmárton Târnaveni Ditró Ditrău Doboka Dăbâca Dognácska Dognecea Dombos Văleni Domokos Dămăcuşeni Egeres Aghireşu Élesd Aleşd Erdőd Ardud Erdőfelek Feleacu Erdőgyarak Ghiorac
227 Erdőszáda Erdőszentgyörgy Érmihályfalva Érmindszent Erzsébetbánya Erzsébetváros Etéd Facsád Fakert Farkaslaka Felőr Felsőbánya Felsővisó Felvinc Fogaras Fugyivásárhely Galócás Gátalja Gelence Gernyeszeg Gödemesterháza Görgényszentimre Görgényüvegcsűr Gyalár Gyalu Gyanta Gyergyóholló Gyergyóremete Gergyószentmiklós Gyergyótölgyes Gyimesbükk Gyimesfelsőlok Györgyfalva Győröd Gyulafehérvár Gyulakuta Hadad Hadrév Hágótőalja Halmágy Halmi Haró Hátszeg Héjjasfalva Ardusat Sângeorgiu de Pădure Valea lui Mihai Ady Endre Băiuţi Dumbrăveni Atid Făget Livada Lupeni Uriu Baia Sprie Vişeu de Sus Unirea Făgăraş Oşorhei Gălăuţaş Gătaia Ghelinţa Gorneşti Stânceni Gurghiu Glăjărie Ghelari Gilău Ginta Corbu Remetea Gheorgheni Tulgheş Ghimeş-Făget Lunca de Sus Gheorghieni Ghiroda Alba Iulia Fântinele Hodod Hădăreni Hagota Halmeag Halmeu Hărău Haţeg Vânători 225
228 Holtmaros Homoródjánosfalva Homoródszentmárton Hosdát Hosszúfalu Hosszúmező Igazfalva Istvánháza Jákótelke Józsefszállás Kalán Kalotaszentkirály Kályán, Magyarkályán Kaplony Kapnikbánya Kara, Kolozskara Karánsebes Kászonaltíz Katalin Kékes Kémer Kendilóna Kercsed Kérő Kézdimartonos Kézdivásárhely Kisiratos Kisjenő Kiskapus Kisnyégerfalva Kispereg Kisszécsény Kistécső Kisvarjas Kóbor Kolozs Kolozsvár Koltó Kommandó Korond Kovászna Kőhalom Kökényesd Kökös Lunca Mureşului Ioneşti Mărtiniş Hăşdat Săcele-Satu Lung Câmpulung la Tisa Dumbrava Iştihaza Horlacea Iosif Călan Sâncraiu Căianu Căpleni Cavnic Cara Caransebeş Plăeşii de Jos Cătălina Chiochiş Camăr Luna de jos Stejeriş Băiţa Mărtănuş Târgu Seciuesc Iratoşu Mic Chişineu Criş Copşa Mică Grădinari Peregu Mic Săceni Teceu Mic Variaşu Mic Cobor Cojocna Cluj-Napoca Coltău Comandău Corund Covasna Rupea Porumbeşti Chichiş 226
229 Körösbánya Körösfő Kőrösjánosfalva Köröstárkány Kövend Kraszna Küküllővár Kürtös Lázári Lippa Lozsád Lövéte Lugos Lukafalva Lupény Mádéfalva Magyarbece Magyarberkesz Magyardécse Magyarfenes Magyarkecel Magyarlapád Magyarlápos Magyarléta Magyarmedves Magyarnemegye Magyaró Magyarózd Magyarpécska Magyarpéterlaka Magyarremete Magyarszentmárton Magyarszovát Magyarvalkó Magyarvista Majláthfalva Makfalva Málnás Máramarossziget Margitta Marosfelfalu Marosfő Maroshévíz Maroskeresztúr Baia de Criş Izvoru Crişului Ioaniş Tărcaia Plăieşti Crasna Cetatea de Baltă Curtici Lazuri Lipova Jeledinţi Lueta Lugoj Gheorghe Doja Lupeni Siculeni Beţa Berchez Cireşoaia Vlaha Meseşeni de Jos Lopadea Nouă Târgu Lăpuş Liteni Urseni Nimigea Aluniş Ozd Pecica-Rovine Petrilaca de Mureş Remetea Sânmartinu Maghiar Suatu Văleni Viştea Mailat Ghindari Mălnaş Sighetu Marmaţiei Marghita Suseni Izvoru Mureşului Topliţa Cristeşti 227
230 Marosludas Marosszentanna Marosugra Marosújvár Marosvásárhely Marosvécs Medgyes Méhes, Mezőméhes Méra Mezőbaj Mezőbánd Mezőbodon Mezőcsávás Mezőfény Mezőkeszü Mezőpetri Mezőtelegd Mezőtelki Mezőterem Mezőzáh Micske Monó Nagyajta Nagybacon Nagybánya Nagybodófalva Nagyborosnyó Nagycsűr Nagyenyed Nagygalambfalva Nagyiratos Nagykapus Nagykároly Nagylak Nagymajtény Nagymedvés Nagymoha Nagyrápolt Nagysármás Nagysomkút Nagyszalonta Nagyszeben Nagyszentmiklós Nagyvárad Luduş Sântana de Mureş Ogra Ocna Mureş Târgu Mureş Brâncoveneşti Mediaş Miheşu de Câmpie Mera Boiu Band Papiu Ilarian Ceuaşu de Câmpie Foieni Chesău Petreşti Tileagd Telechiu Tiream Zău de Câmpie Mişca Mânău Aita Mare Băţanii Mari Baia Mare Bodo Boroşneu Mare Şura Mare Aiud Porumbenii Mari Iratoşu Căpuşu Mare Carei Nădlac Moftinu Mare Medveş Grânari Rapoltu Mare Sărmaşu Şomcuta Mare Salonta Sibiu Sânnicolau Mare Oradea 228
231 Nagyzerénd Naszód Nőricse Nyárádremete Nyárádszereda Olthévíz Omor Ópécska Oravicabánya Ördöngősfüzes Örményes, Mezőörményes Örvénd Ötvösd Palatka, Magyarpalatka Palotailva Páncélcseh Pankota Parajd Pata, Kolozspata Pécska Petrilla Petrozsény Piski Porgány Pósalaka Priszlop Pusztakeresztúr Pusztaújlak Radnót Rákosd Resicabánya Resinár Retteg Réty Rév Rónaszék Rőd Salamás Sárköz Sarmaság Sáromberke Sárpatak Sárvásár Segesvár Zerind Năsăud Nevrincea Eremitu Miercurea Nirajului Hoghiz Roviniţa Mare Pecica Oraviţa Fizeşu Gherlii Urmeniş Urvind Otveşti Pălatca Lunca Bradului Panticeu Pâncota Praid Pata Pecica Petrila Petroşani Simeria Pordeanu Poşoloaca Prislop Cherestur Uileacu de Criş Iernut Răcăsţia Reşiţa Răşinari Petru Rareş (Reteag) Reci Vadu Crişului Coştiui Rediu Şărmaş Livada Şărmăşag Dumbravioara Şapartoc Şaula Sighişoara 229
232 Sepsibükszád Sepsiszentgyörgy Simonyifalva Szabéd Szalárd Szamosardó Szamosújvár Szaniszló Szapáryfalva Szászkabánya Szászlóna Szászrégen Szászsebes Szászváros Szatmárhegy Szatmárnémeti Szatmárudvari Szecseleváros Szék Székelyderzs Székelyhíd Székelykeresztúr Székelykocsárd Székelyudvarhely Szentágota Szentegyházas Szentjobb Szentleányfalva Szentmáté Szentmihály Szépkenyerűszentmárton Szerdahely Szilágycseh Szilágynagyfalu Szilágyperecsen Szilágysomlyó Szilágyzovány Szinérváralja Szováta Sződemeter Sztrigyszentgyörgy Talmács, Nagytalmács Tasnád Teke Bixad Sfântu Gheorghe Satu Nou /Arad county/ Săbed Sălard Arduzel Gherla Sanislău Ţipari Sasca Montană Luna de Sus Reghin Sebeş Orăştie Viile Satu Mare Satu Mare Odoreu Săcele Sic Dârjiu Săcueni Cristuru Secuiesc Lunca Mureşului Odorheiu Secuiesc Agnita Vlăhiţa Sâniob Sânleani Matei Mihai Viteazu Sânmartin Miercurea Sibiului Cehu Silvaniei Nuşfalău Pericei Şimleu Silvaniei Zăuan Seini Sovata Săuca Streisângeorgiu Tălmaciu Tăşnad Teaca 230
233 231 Temesrékas Recaş Temesvár Timişoara Tenke Tinca Torda Turda Tordaszentlászló Săvădisla Tordos Turdaş Torja Turia Torockó Rimetea Torockószentgyörgy Colţeşti Torontálkeresztes Cruceni Törcsvár Bran Tövis Teiuş Túrterebes Turulung Tusnádfürdő Băile Tuşnad Türkös Săcele-Turcheş Újegyház Nocrich Újmosnica Moşniţa Nouă Újszékely Secuieni Újszentes Dumbrăviţa Uzon Ozun Vajdahunyad Hunedoara Vajdakamarás Vaida-Cămăraş Vajdaszentivány Voivodeni Válaszút Răscruci Valkó, Valkóváralja Sub Cetate Várasfenes Finiş Vargyas Vârghiş Várkudu Coldău Vásáros Târgovişte Vasláb Voşlăbeni Végvár Tormac Verespatak Roşia Montană Vice Viţa Világos Şiria Vinga Vinga Visa Vişea Vízakna Ocna Sibiului Vulkán Vulcan Zabola Zăbala Zágon Zagon Zalatna Zlatna Zilah Zalău Zimándújfalu Zimandu Nou Zselyk Jeica
234 Zsibó Zsombolya Jibou Jimbolia VOJVODINA (YUGOSLAVIA SERBIA) Relief names: Hungarian Serbian Alföld (Nagyalföld) Panonska nizija PL Bácskai-(Telecskai) löszhát Telečka R Delibláti-homokpuszta Deliblatska peščara R Fruska Gora (Péterváradi-hegység) Fruška Gora M Titeli-fennsík Titelski breg P Verseci-hegység Vršačke planine M Hydrographical names: Hungarian Serbian Aranka Zlatica Béga Begej Csík-ér Čik Duna Dunav Duna-Tisza-Duna-csatorna Kanal Dunav-Tisa-Dunav Fehér-tó (in Bánát) Belo jezero L Kígyós Plazović Körös-ér Kereš Krassó Karaš Krivaja Krivaja Ludasi-tó Ludaško jezero L Mosztonga Mostonga Palicsi-tó Palićko jezero L Száva Sava Temes Tamiš Tisza Tisa 232
235 Names of historical regions: Hungarian Bácska (Bácsvidék) Bánát (Bánság) Szerémség Serbian,-Croatian,-Slovenian Bačka Banat Srem Settlement names: Hungarian Ada Alsóittebe Apatin Aracs Bács Bácsfeketehegy,Feketics Bácsföldvár Bácskertes Bácskossuthfalva, Ómoravica Bácspalánka Bácstopolya, Topolya Bajmok Bajsa Bánmonostor Basahida Bezdán Csantavér Csóka Csurog Dobrodolpuszta Doroszló Egyházaskér Fehértemplom Fejértelep Futak Gombos Herkóca Hertelendyfalva Hódegyháza Horgos Serbian Ada Novi Itebej Apatin Novi Bečej-Vranjevo Bač Feketić Bačko Gradište Kupusina Stara Moravica Bačka Palanka Bačka Topola Bajmok Bajša Banoštor Bašaid Bezdan Čantavír Čoka Čurug Dobrodol Doroslovo Vrbica Bela Crkva Šušara Futog Bogojevo Hrtkovci Pančevo-Vojlovica Jazovo Horgoš 233
236 India Káptalanfalva Karlóca Kevevára Kisbelgrád Kisbosznia Kishegyes Kishomok Kula Magyarcsernye Magyarkanizsa Magyarmajdány Magyarszentmihály Maradék Martonos Mitrovica Mohol Monostorszeg Mozsor Nagybecskerek Nagyfény Nagykikinda Nemesmilitics Nyékica Óbecse Orom Oroszlámos Pacsér Palánka Palics Pancsova Péterréve Pétervárad Piros Rábé Ruma Sándoregyháza Satrinca Szabadka Szaján Székelykeve Szenttamás Szilágyi Tamásfalva, Hetény Inđija Busenje Sremski Karlovci Kovin Mali Beograd Mala Bosna Mali Idjoš Mali Pesak Kula Nova Crnja Kanjiža Majdan Mihajlovo Maradik Martonoš Sremska Mitrovica Mol Bački Monoštor Mošorin Zrenjanin Žednik (Stari-, Novi-) Kikinda Svetozar Miletić Nikinci Bečej Orom Banatsko Aranđelovo Pačir Banatska Palanka Palić Pančevo Bačko Petrovo Selo Petrovaradin Rumenka Rabe Ruma Ivanovo Šatrinci Subotica Sajan Skorenovac Srbobran Svilojevo Hetin 234
237 Tavankút Temerin Tiszakálmánfalva Titel Torontáltorda Torontálvásárhely Törökbecse Törökkanizsa Törzsudvarnok Újvidék Ürményháza Verbász Versec Zenta Zentagunaras Zombor Zsablya Tavankut Temerin Budisava Titel Torda Debeljača Novi Bečej Novi Kneževac Banatski Dvor Novi Sad Jermenovci Vrbas Vršac Senta Novo Orahovo Sombor Žabalj CROATIA Relief names: Hungarian Croatian Báni-hegység, Baranyahát Bansko brdo M Bilo-hegység Bilogora M Drávamenti-síkság Podravina PL Monoszló Moslavačka Gora Pozsega-medence Požeška kotlina Szávamenti-síkság Posavina Hydrographical names: Hungarian Csázma Dráva Duna Croatian Česma Drava Dunav 235
238 Karasica Karašica Kopácsi-rét Kopački rít S Mura Mura Száva Sava Vuka, Valkó Vuka Names of historical regions: Hungarian Baranya (Drávaszög) Muraköz Szerémség Szlavónia Croatian Baranja Međimurje Srijem Slavonija Settlement names: Hungarian Albertfalu Almás, Hagymás Alsómiholjác Antunovác Apáti Berzétemonostor Baranyabán Baranyaszentistván Baranyavár Benge Bellye Belovár Bolmány Boró Bród Budakóc Csák Csáktornya Csúza Dálya Dályhegy Dályok Croatian Grabovac Aljmaš Donji Miholjac Antunovac Tenjski Opatovac Nuštar Popovac Petlovac Branjin Vrh Šumarina Bilje Bjelovar Bolman Borovo Slavonski Brod Stari Budakovac Čakovci Čakovec Suza Dalja Dalja-Daljska Planina Duboševica 236
239 Darázs Dárda Daruvár Diakóvár Erdőd Eszék Főherceglak Grubisnopolje Haraszti Hercegmárok Hercegszőlős Izsép Kácsfalu Kaporna Kapronca Karancs Keskend Kiskőszeg Kopács Kórógy Kő Kőrös Lacháza Laskafalu Laskó Légrád Lőcs Nagybodolya Nagypisznice Novszka Ójankovác Pakrác Pélmonostor Perlak Petárda Pozsega Sepse Szata Szentlászló Sziszek Szlatina Tárnok Torjánc Újbezdán Draž Darda Daruvar Đakovo Erdut Osijek Kneževo Grubišno Polje Hrastin Gajić Kneževi Vinogradi Topolje Jagodnjak Koprivna Koprivnica Karanac Kozarac Batina Kopačevo Korog Kamenac Križevci Vladislavci Čeminac Lug Legrad Luč Podolje Velika Pisenica Novska Stari Jankovci Pakrac Beli Manastir Prelog Baranjsko Petrovo Selo Požega Kotlina Sotin Laslovo Sisak Podravska Slatina Tovarnik Torjanci Novi Bezdan 237
240 Újlak Valpó Varasd Várdaróc Verbász Verőce Villyó Vörösmart Zágráb Zsgyála Ilok Valpovo Varaždin Vardarac Vrbas Virovitica Viljevo Zmajevac Zagreb Žďala TRANSMURA REGION (SLOVENIA) Relief names: Hungarian Slovenian Lendvai-hegy Lendavske gorice M Lendvai-medence Dolinsko B Vasi-hegyhát Goričko H Hydrographical names: Hungarian Kebele-patak Kerka (Kis-, Nagy-) Lendva Mura Slovenian Kobilje Krka (Mala-, Velika-) Lendava Mura Names of historical region: Hungarian Muravidék (Murántúl) Slovenian Pomurje (Prekmurje) 238
241 Settlement names: Hungarian Alsójánosfa Alsólendva Bántornya Csente Dobrónak, Lendvavásárhely Felsőlendva Göntérháza Kámaháza Kebeleszentmárton Kisfalu Lendvahídvég Lendvahosszúfalu Mezővár Muraszombat Őrihodos Pártosfalva Petesháza Pince Pincemajor Radamos Rátkalak Szárazhegy Zalagyertyános Slovenian Ivanjševci Lendava Turnišče Čentiba Dobrovnik Grad Genterovci Kamovci Kobilje Pordašinci Mostje Dolga Vas Tešanovci Murska Sobota Hodoš Prosenjakovci Petišovci Pince Pince Marof Radmožanci Ratkovci Suhi Vrh Gaberje BURGENLAND (AUSTRIA) Relief names: Hungarian German Fertőzug Seewinkel R Hanság Waasen S Kőszegi-hegység Günser Gebirge M Lajta-hegység Leitha Gebirge M Lánzséri-hegység Landseer Gebirge M 239
242 Mosoni-síkság PL Pándorfalvi-fennsík (Fenyér) Parndorfer Plateau (Heide) P Rozália-hegység Rosaliengebirge M Soproni-hegység Ödenburger Gebirge M Hydrographical names: Hungarian German Csáva-patak Stoober Bach Fertő-tó Neusiedler See L Gyöngyös Güns Lajta Leitha Lapincs Lafnitz Pinka Pinka Rába Raab Répce Rabnitz Strém Strem Szék-patak Zickenbach Vulka Wulka Name of historical region: Hungarian Őrség (Felső-Őrség) German Wart Settlement names: Hungarian Alsóőr Barátudvar Boldogasszony Borostyánkő Csajta Csáva Darázsfalu Darufalva German Unterwart Mönchhof Frauenkirchen Bernstein Schachendorf Stoob Trausdorf an der Wulka Drassburg 240
243 Doborján Felsőőr Felsőpulya Féltorony Fertőmeggyes Fraknó Gyanafalva Gyepűfüzes Kabold Királyhida Kismarton Köpcsény Lánzsér Léka Locsmánd Miklóshalma Monyorókerék Mosonbánfalva Mosontarcsa Mosontétény Nagyfalva Nagymarton Nagysároslak Nagyszentmihály Németújvár Nezsider Őrisziget Pátfalu Pinkafő Pomogy Rábakeresztúr Rohonc Ruszt Sopronkeresztúr Szentelek Szikra Tarcsafürdő Városszalónak Vasvörösvár Raiding Oberwart Oberpullendorf Halbturm Mörbisch am See Frochtenstein Jennersdorf Kohfidisch Kobersdorf Bruckneudorf Eisenstadt Kittsee Landsee Lockenhaus Lutzmannsburg Nickelsdorf Eberau Apetlon Andau Tadten Mogersdorf Mattersburg Moschendorf Grosspetersdorf Güssing Neusiedl am See Siget in der Wart Podersdorf Pinkafeld Pamhagen Heiligenkreuz im Lafnitztal Rechnitz Rust Deutschkreutz Stegersbach Sieggraben Bad Tatzmannsdorf Stadt-Schlaining Rotenturm an der Pinka 241
244 LIST OF FIGURES Figure 1. Ethnic map of Hungary (late 15th century) Figure 2. Ethnic map of Hungary (1773) Figure 3. Ethnic map of Hungary (1910) and the Trianon border (1920) Source: Dami, A La Hongrie de Demain, Paris Figure 4. Change in the number of ethnic Hungarians in Transylvania, Slovakia, Vojvodina and Transcarpathia according to the census data ( ) Figure 5. Percentage of the Hungarian minorities in the Carpathian Basin (around 1990) Figure 6. The largest Hungarian communities beyond the borders of Hungary (around 1990) Figure 7. Important Hungarian geographical names in South Slovakia Figure 8. Ethnic map of the present-day territory of Slovakia (late 15 th century) Main sources: Bakács I Hont vármegye Mohács előtt, Akadémiai Kiadó, Budapest, Fekete Nagy A A Szepesség területi és társadalmi kialakulása, Budapest, Fügedi E Nyitra megye betelepülése, Budapest, Ila B. 1976, 1944, 1946, 1968 Gömör megye I-IV., MTA, Budapest, Kniezsa I Adalékok a magyar-szlovák nyelvhatár történetéhez, Athenaeum, Budapest, Marsina, R. - Kušík, M Urbáre feudálnych panstiev na Slovensku I., Vydavateľstvo SAV, Bratislava, Varsik, B. 1964, 1973, 1977 Osídlenie Košickej kotliny I-III., SAV, Bratislava, Varsik, B Nemecká kolonizácia na území bratislavskej stolice v storočí in: Varsik, B Z osídlenia západného Slovenska v stredoveku, Veda, Bratislava, Vlastivedný slovník obcí na Slovensku I-III. Veda, Bratislava, Figure 9. Ethnic map of the present-day territory of Slovakia (late 18 th century) Sources: Korabinszky, J. M Atlas Regni Hungariae portatilis, Wien, 60p., Lexicon locorum Regni Hungariae populosorum anno 1773 officiose confectum, Magyar Békeküldöttség, Budapest, 1920, Vályi A Magyar országnak leírása I - III., Buda Figure 10. Change in the population number of the main ethnic groups on the present-day territory of Slovakia ( ) Figure 11. Ethnic map of present-day territory of Slovakia (1910) Source: Census 1910 Figure 12. Change in the ethnic structure of population in selected cities and towns of present-day Slovakia ( ) Figure 13. Bilingual (Hungarian Slovak) population in present-day South Slovakia (1941) Figure 14. Hungarian communities in present-day South Slovakia (1941, 1961 and 1991) Figure 15. Ethnic map of Slovakia (1991) Source: Census 1991 Figure 16. Important Hungarian geographical names in Transcarpathia Figure 17. Ethnic map of the present-day territory of Transcarpathia (late 15 th century) Source: Bélay V Máramaros megye társadalma és nemzetiségei, Budapest, Csánki D Magyarország történelmi földrajza a Hunyadiak korában, Budapest, Szabó I Ugocsa megye, Budapest Figure 18. Ethnic map of the present-day territory of Transcarpathia (late 18 th century) Sources: Korabinszky, J. M Atlas Regni Hungariae portatilis, Wien, 60p., Lexicon locorum Regni Hungariae populosorum anno 1773 officiose confectum, Magyar Békeküldöttség, Budapest, 1920, Vályi A Magyar országnak leírása I - III., Buda Figure 19. Ethnic map of the present-day territory of Transcarpathia (1910) Source: Census 1910 Figure 20. Ethnic map of Transcarpathia (1989) Source: Census 1989 Figure 21. Hungarian communities in Transcarpathia (1989) Source: Census 1989, Botlik, J. Dupka, Gy. (1993), estimation of Kocsis K. Figure 22. Important Hungarian geographical names in Transylvania Figure 23. Ethnic map of the present-day territory of Transylvania (late 15 th century)
245 Source: Csánki D Magyarország történelmi földrajza a Hunyadiak korában I - III., V., Budapest, Makkai L Erdély népei a középkorban Deér J. - Gáldi L. (szerk.) 1943 Magyarok és románok I., Budapest, pp , Makkai L Histoire de Transylvanie, Les Presses Universitaires de France, Paris, 382p., Pâclişanu, Z Un registru al quinquagesimei din in: Albumul dedicat Fraţilor Alexandru şi Ion I. Lăpedatu, Bucureşti, pp , Pascu, Ş. 1971, 1979 Voievodatul Transilvaniei I-II, Editura Dacia, Cluj-Napoca, Prodan, D Iobăgia în Transilvania în secolul al XVI-lea, I-III., Bucureşti, Suciu, C Dicţionar istoric al localităţilor din Transilvania, I - II., Editura Academiei R.S. România, Bucureşti, Wagner, E Historisch-statistisches Ortsnamenbuch für Siebenbürgen, Böhlau Verlag, Köln - Wien, 526p. Ugocsa-Ugocea: Szabó I Ugocsa megye, Budapest, Szatmár-Satu Mare: Maksai F A középkori Szatmár megye, Budapest, 240p., Máramaros-Maramureş: Bélay V Máramaros megye társadalma és nemzetiségei. A megye betelepülésétől a VIII. század elejéig, Budapest, 224p., Bihar- Bihor: Jakó Zs Bihar megye a török pusztítás előtt, Budapest, Győrffy I. 1915: Dél-Bihar népesedési és nemzetiségi viszonyai negyedfélszáz év óta Földrajzi Közlemények pp , Arad-Zaránd: Márki S Aradvármegye és Arad szabad királyi város története, Arad, 564p., Prodan, D Domeniul catăţii Şiria la 1525 Anuarul Institului de Istorie din Cluj III., pp , Csanád-Cenad: Borovszky S Csanád megye története 1715-ig I-II. MTA, Budapest, Hunyad-Hunedoara: Pataki, I Domeniul Hunedoara la începutul secolului al XVI-lea, Studiu şi documente 114., Editura Academiei R.S. Române, Bucureşti, 351p., Popa, R Siedlungsverhältnisse und Ethnodemographie des Hatzeger Landes im Jahrhundert in: Forschungen zur Volks- und Landeskunde (Verlag der Akademie der Sozialistischen Republik Rumänien, Bukarest) Bd.31. Nr.2. pp , Szászföld-Districtele şi scaunele săseşti: Binder P Közös múltunk. Románok, magyarok, németek és délszlávok feudalizmus kori falusi és városi együttéléséről., Bukarest, Binder, P Ethnische Verschiebungen im mittelalterlichen Siebenbürgen Zeitschrift für Siebenbürgische Landeskunde (Arbeitskreis für Siebenbürgische Landeskunde) Jg.18., H.2., pp , Graf, B Die Kulturlandschaft des Burzenlandes. Ein geographischer Beitrag zur auslandsdeutschen Volks- und Kulturbodenforschung, Verlag für Hochschulkunde, München, 136p., Müller, G Die ursprüngliche Rechtslage der Rumänen in siebenbürger Sachsenlande Archiv des Vereins für Siebenbürgische Landeskunde 38. pp , Fehér-Alba: Iczkovits E Az erdélyi Fehér megye a középkorban, Budapest, 88p., Kolozs-Torda-Doboka-Közép-és Belső-Szolnok- Kraszna / Cluj-Turda-Dobâca-Solnocul de mijloc şi din lăuntru-crasna: Jakó Zs A gyalui vártartomány urbáriumai, Erdélyi Tudományos Intézet CIII., 482p., Makkai L Északerdély nemzetiségi viszonyainak kialakulása, Kolozsvár, 20p., Makkai L Szolnok-Doboka megye magyarságának pusztulása a XVII. század elején, Kolozsvár, Makkai L Társadalom és nemzetiség a középkori Kolozsváron, Kolozsvár, Petri M Szilágy vármegye monographiája I - VI., Budapest, Wagner, E Register des Zehnten und des Schaffünfzigsten als Hilfsquellen zur historischen Demographie Siebenbürgens in: Benda Kálmán et al. (Hrsg.) 1987 Forschungen über Siebenbürgen und seine Nachbarn I. Festschrift für Attila T. Szabó und Zsigmond Jakó, Dr. Rudolf Trofenik, München, pp , Figure 24. Change in the number of Hungarians, Rumanians and Germans on the historical territory of Transylvania ( ) Figure 25. Change in the ethnic structure of population on the historical territory of Transylvania (16 th 20 th century) Figure 26. Change in the population number of ethnic Hungarians in major areas of Transylvania ( ) Figure 27. Change in the population number of the main ethnic groups on the present-day territory of Transylvania ( ) Figure 28. Ethnic map of the present-day territory of Transylvania (1910) Source: Census 1910 Figure 29. Change in the ethnic structure of population in selected municipalities of Transylvania ( ) Figure 30. Ethnic map of Transylvania (1992) Source: Census 1992
246 Figure 31. Percentage of ethnic Hungarians in the municipalities, towns and communes of Transylvania (1992) Source: Census 1992 Figure 32. Hungarian communities in Transylvania (1992) Figure Source: Census 1992 Figure 33. Important Hungarian geographical names in Vojvodina Figure 34. Change in the ethnic territory of Hungarians on the present-day territory of Vojvodina (11 th 20 th century) Figure 35. Ethnic map of the present-day territory of Vojvodina (1910) Source: Census 1910 Figure 36. Serbian (Yugoslav) colonization in Vojvodina ( ) Figure 37. Change in the ethnic structure of population in selected cities and towns of the present-day Vojvodina ( ) Figure 38. Hungarian colonization in Bácska ( ) Figure 39. Serbian and Hungarian losses in Bácska ( ) Figure 40. Ethnic map of Vojvodina (1991) Figure 41. Hungarian communities in Vojvodina (1991) Source: Census 1991 Figure 42. Serbian refugees in Vojvodina (1996) Source: Census of Refugees and other War-affected Persons in the Federal Republic of Yugoslavia UNHCR - UN High Commissioner for Refugees - Commissioner for Refugees of the Republic of Serbia, Belgrade, 1996 Figure 43. Important Hungarian geographical names in Croatia Figure 44. Change in the number of Hungarians in different parts of Croatia ( ) Figure 45. Ethnic map of the present-day territory of East Croatia (1910) Source: Census 1910 Figure 46. Change in the ethnic structure of the Croatian Baranya ( ) Figure 47. Ethnic map of East Croatia (1991) Source: Census 1991 Figure 48. Hungarians and the War of 1991 in East Croatia Figure 49. Important Hungarian geographical names in the Transmura Region Figure 50. Ethnic map of the present-day Slovenian-Hungarian borderland (1910, 1991) Figure 51. Important Hungarian geographical names in Burgenland Figure 52. Ethnic map of the present-day territory of Burgenland (late 15 th century, 1773, 1910, 1991) Figure 53. Hungarian communities in Burgenland (1923, 1991) LIST OF TABLES 1. Hungarians in different regions of the World (around 1990) 2. National minorities of Europe by population size (around 1990) 3. Percentage of Europe's national minorities compared to the total population of their ethnic groups 4. Change in the number and percentage of the Hungarian minorities in different regions of the Carpathian Basin ( ) 5. Ethnic reciprocity in the countries of the Carpathian Basin (around 1990) 6. The largest Hungarian communities beyond the borders of Hungary in the Carpathian Basin, according to census data (around 1980 and 1990) 7. Ethnic structure of the population of Upper Hungary ( ) 8. Ethnic structure of the population on the present-day territory of Slovakia ( ) 9. Change in the ethnic structure of selected cities and towns of present-day-day Slovakia ( ) 10. The changing ethnic majority of selected settlements in present-day-day South Slovakia ( ) 11. The new regions (kraj) of Slovakia and the Hungarian minority
247 12. Selected new districts (okres) of Slovakia and the Hungarian minority 13. The largest Hungarian communities in Slovakia (1991) 14. Towns in Slovakia with an absolute Hungarian majority (1991) 15. Ethnic structure of the population of historical Northeast Hungary ( ) 16. Ethnic structure of the population on the present-day territory of Transcarpathia ( ) 17. Change in the ethnic structure of selected settlements of present-day-day Transcarpathia ( ) 18. The largest Hungarian communities in Transcarpathia (1989) 19. Change in the ethnic structure of the population on the historical territory of Transylvania ( ) 20. Ethnic structure of the population on the present-day territory of Transylvania ( ) 21. Change in the number of ethnic Hungarians in major areas of Transylvania ( ) 22. Change in the ethnic structure of selected cities and towns of Transylvania ( ) 23. Change in the ethnic structure of the population of selected counties of Transylvania ( ) 24. Towns in Transylvania with an absolute Hungarian majority (1992) 25. The largest Hungarian communities in Transylvania (1956, 1986 and 1992) 26. Ethnic structure of the population of the present-day territory of Vojvodina ( ) 27. Change in the ethnic structure of selected cities and towns of Vojvodina ( ) 28. The largest Hungarian communities in Vojvodina (1991) 29. Towns in Vojvodina with an absolute Hungarian majority (1991) 30. Ethnic structure of the population of Croatian Baranya ( ) 31. Ethnic structure of the population on the present-day territory of Croatia ( ) 32. Change in the number of Hungarians in different parts of Croatia ( ) 33. Ethnic structure of the population on the present-day territory of Transmura Region ( ) 34. Ethnic structure of the population of Alsólendva - Lendava ( ) 35. Ethnic structure of the population on the present-day territory of Burgenland ( ) 36. Change in the ethnic structure of selected settlements of Burgenland ( )
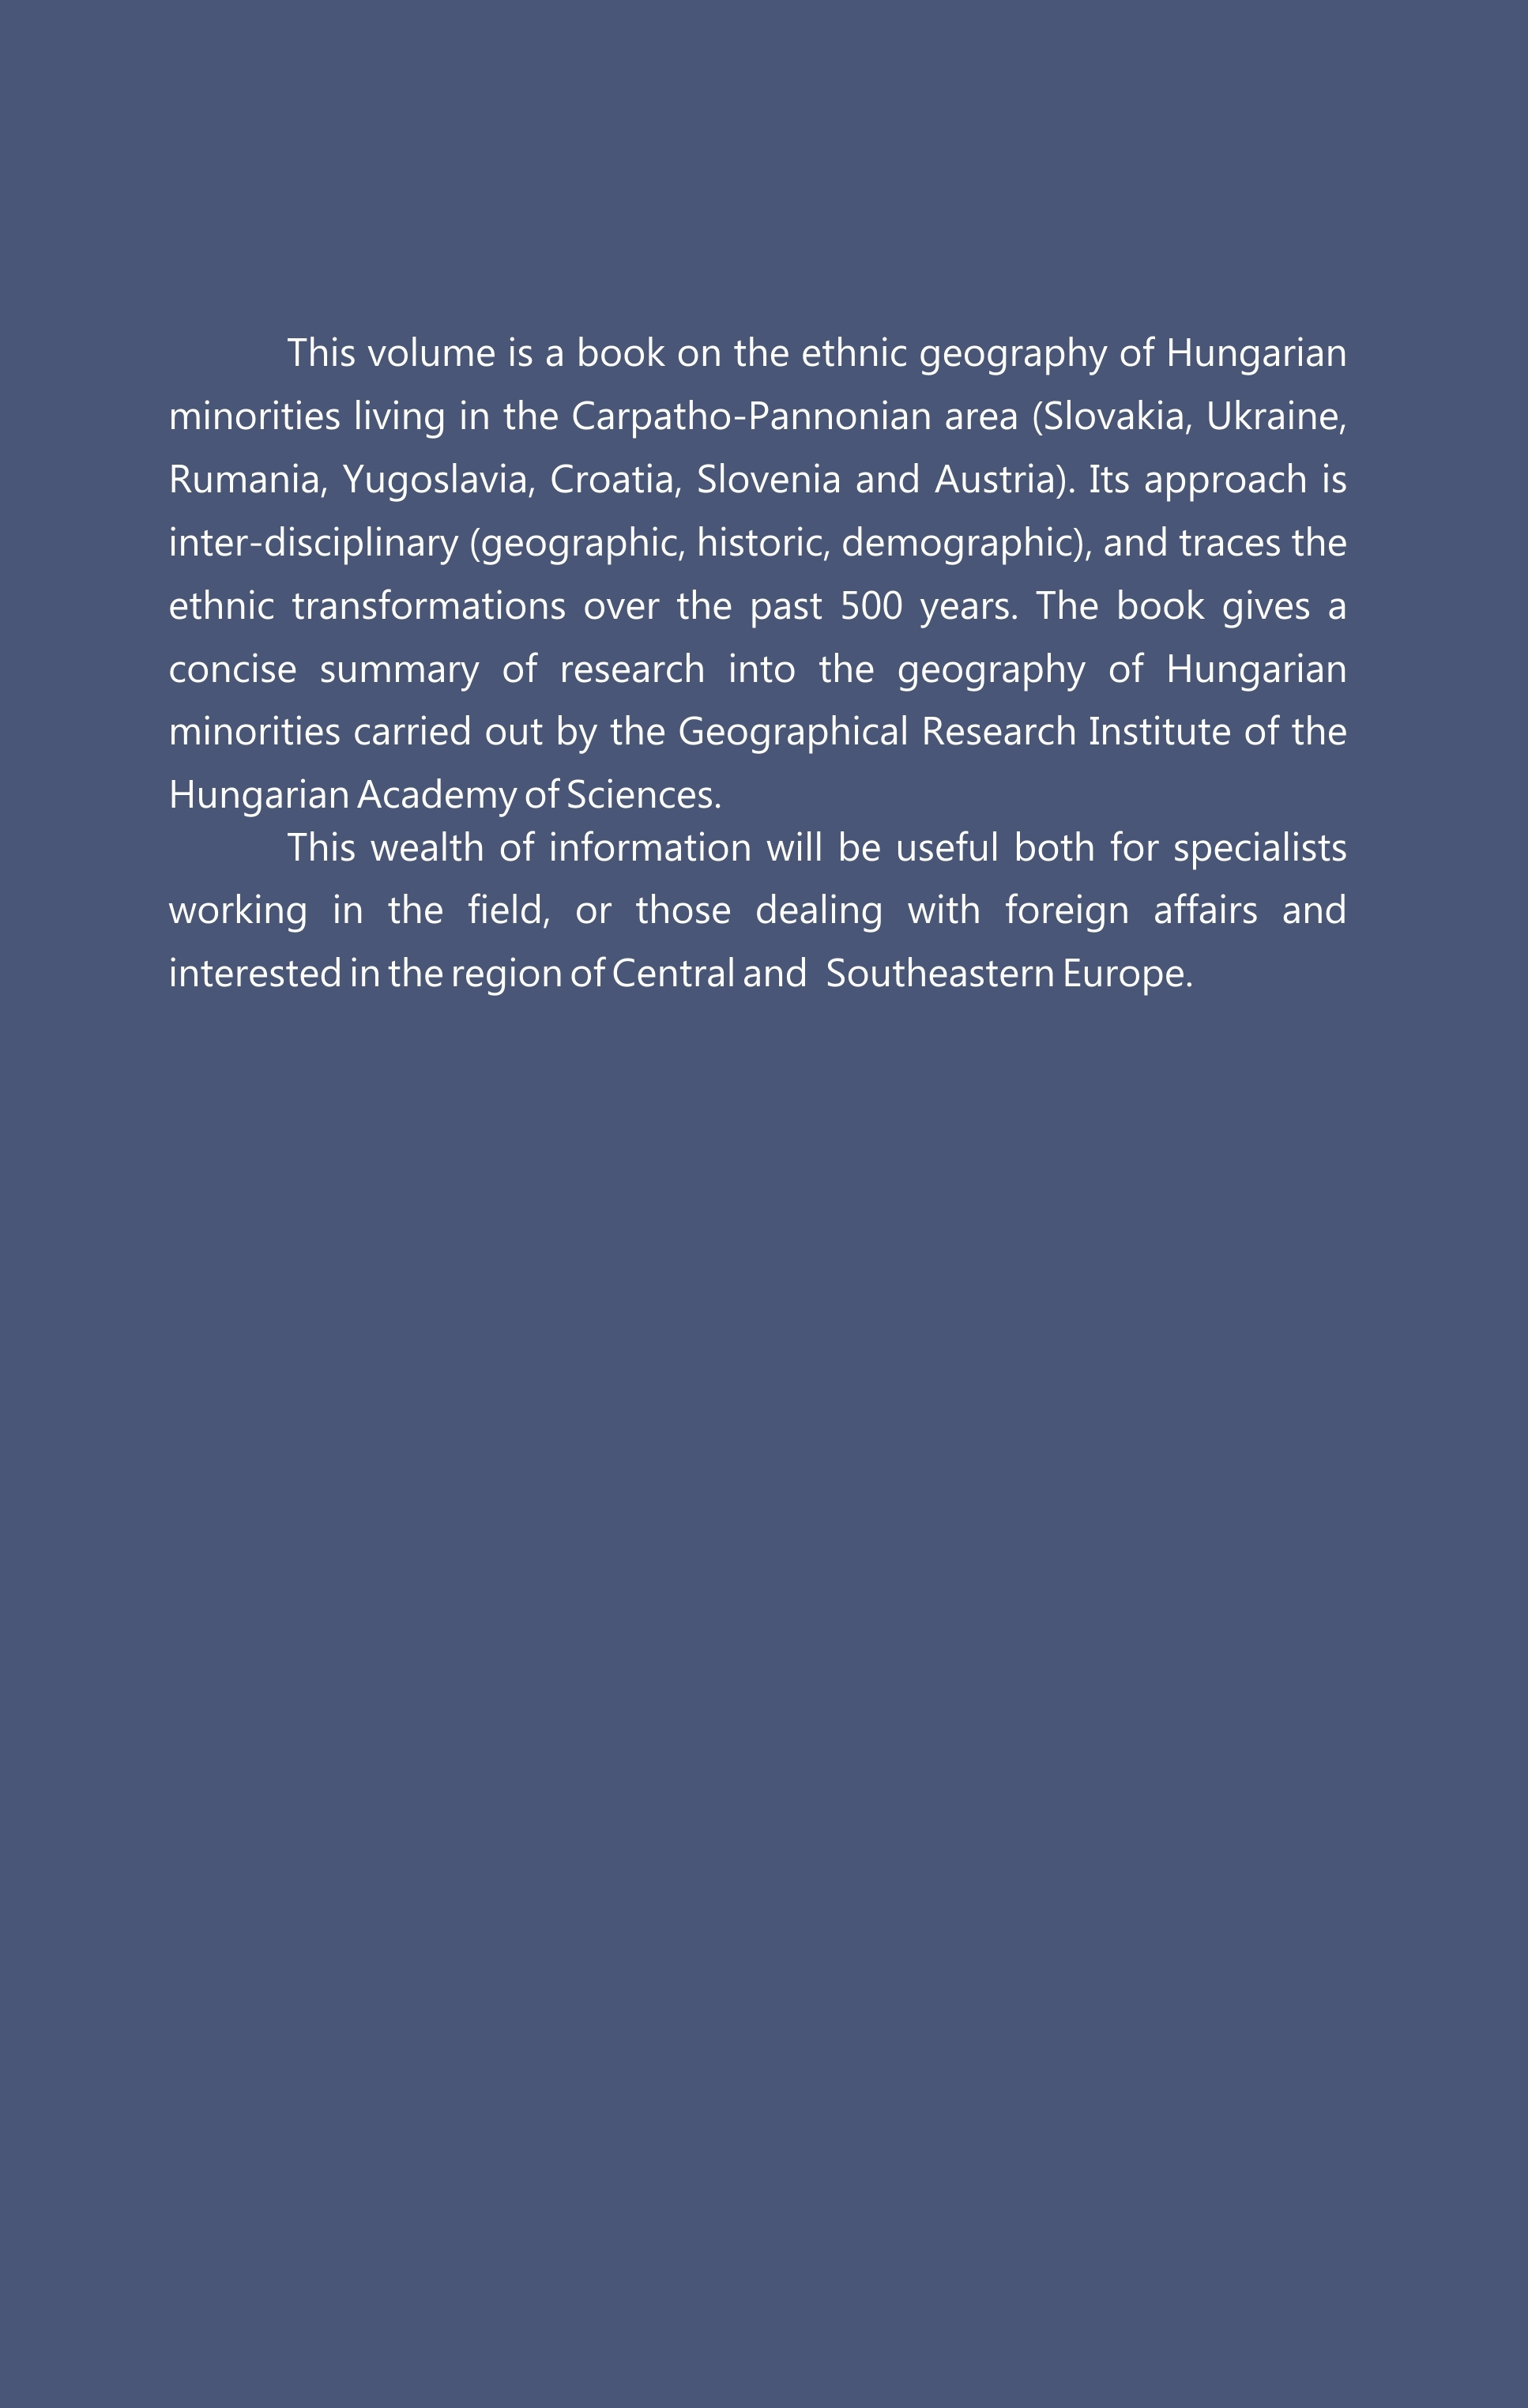
248
FAMILY STRUCTURES THROUGH THE LIFE CYCLE
 FAMILY STRUCTURES THROUGH THE LIFE CYCLE István Harcsa Judit Monostori A magyar társadalom 2012-ben: trendek és perspektívák EU összehasonlításban Budapest, 2012 november 22-23 Introduction Factors which
FÖLDRAJZ ANGOL NYELVEN GEOGRAPHY
 Földrajz angol nyelven középszint 0612 É RETTSÉGI VIZSGA 2006. október 25. FÖLDRAJZ ANGOL NYELVEN GEOGRAPHY KÖZÉPSZINTŰ ÍRÁSBELI ÉRETTSÉGI VIZSGA INTERMEDIATE LEVEL WRITTEN EXAM JAVÍTÁSI-ÉRTÉKELÉSI ÚTMUTATÓ
 ó Ú ő ó ó ó ö ó ó ő ö ó ö ö ő ö ó ö ö ö ö ó ó ó ó ó ö ó ó ó ó Ú ö ö ó ó Ú ú ó ó ö ó Ű ő ó ó ó ő ó ó ó ó ö ó ó ó ö ő ö ó ó ó Ú ó ó ö ó ö ó ö ő ó ó ó ó Ú ö ö ő ő ó ó ö ö ó ö ó ó ó ö ö ő ö Ú ó ó ó ü ú ú ű
A rosszindulatú daganatos halálozás változása 1975 és 2001 között Magyarországon
 A rosszindulatú daganatos halálozás változása és között Eredeti közlemény Gaudi István 1,2, Kásler Miklós 2 1 MTA Számítástechnikai és Automatizálási Kutató Intézete, Budapest 2 Országos Onkológiai Intézet,
STUDENT LOGBOOK. 1 week general practice course for the 6 th year medical students SEMMELWEIS EGYETEM. Name of the student:
 STUDENT LOGBOOK 1 week general practice course for the 6 th year medical students Name of the student: Dates of the practice course: Name of the tutor: Address of the family practice: Tel: Please read
Áprilisban 14%-kal nőtt a szálláshelyek vendégforgalma Kereskedelmi szálláshelyek forgalma, 2014. április
 Közzététel: 2014. június 10. Következik: 2014. június 11. Fogyasztói árak, 2014. május Sorszám: 77. Áprilisban 14%-kal nőtt a szálláshelyek vendégforgalma Kereskedelmi szálláshelyek forgalma, 2014. április
N É H Á N Y A D A T A BUDAPESTI ÜGYVÉDEKRŐ L
 K Ö Z L E M É N Y E K N É H Á N Y A D A T A BUDAPESTI ÜGYVÉDEKRŐ L DR. HEINZ ERVIN A népesedésstatisztika igen fontos mutatószámai a népesség kormegoszlására és annak változására vonatkozó adatok. Ezért
Correlation & Linear Regression in SPSS
 Petra Petrovics Correlation & Linear Regression in SPSS 4 th seminar Types of dependence association between two nominal data mixed between a nominal and a ratio data correlation among ratio data Correlation
EGÉSZSÉGTUDOMÁNY, LVII. ÉVFOLYAM, 2013. 4. SZÁM 2013/4
 Part II: Seasonal variations in human infections with Puumula hantavirus in Styria II. rész: Évszakos változások a Puumula hantavirus okozta humán fertőzésekben Stájerországban PROF. SIXL WOLF DIETER,
MOLNÁR JUDIT Miskolci Egyetem, Társadalomföldrajz Tanszék
 EGY RURALIS TERSEG ELNÉPTELENEDÉSÉNEK TÖRTENETE A SAJÓ ÉS A HERNÁD ÁLTAL KÖZREZÁRT HATÁRVIDÉK MAGYARORSZÁGI OLDALÁN (NÉPESSÉGFÖLDRAJZI VÁLTOZÁSOK A XX. SZ. SORÁN) MOLNÁR JUDIT Miskolci Egyetem, Társadalomföldrajz
SAJTÓKÖZLEMÉNY Budapest 2011. július 13.
 SAJTÓKÖZLEMÉNY Budapest 2011. július 13. A MinDig TV a legdinamikusabban bıvülı televíziós szolgáltatás Magyarországon 2011 elsı öt hónapjában - A MinDig TV Extra a vezeték nélküli digitális televíziós
A világ néhány jelentős migrációs útvonala napjainkban Bevezetés a migrációs politikába
 A világ néhány jelentős migrációs útvonala napjainkban Bevezetés a migrációs politikába 2015. szeptember 15. Dr. Tarrósy István Alapkérdések Mit takar a fogalom? Milyen egyéb fogalmakkal tudjuk összekötni?
2. Local communities involved in landscape architecture in Óbuda
 Év Tájépítésze pályázat - Wallner Krisztina 2. Közösségi tervezés Óbudán Óbuda jelmondata: Közösséget építünk, ennek megfelelően a formálódó helyi közösségeket bevonva fejlesztik a közterületeket. Békásmegyer-Ófaluban
A JUHTARTÁS HELYE ÉS SZEREPE A KÖRNYEZETBARÁT ÁLLATTARTÁSBAN ÉSZAK-MAGYARORSZÁGON
 Bevezetés A JUHTARTÁS HELYE ÉS SZEREPE A KÖRNYEZETBARÁT ÁLLATTARTÁSBAN ÉSZAK-MAGYARORSZÁGON Abayné Hamar Enikő Marselek Sándor GATE Mezőgazdasági Főiskolai Kar, Gyöngyös A Magyarországon zajló társadalmi-gazdasági
36% more maize was produced (Preliminary production data of main crops, 2014)
") Release date: 22 January 2015 Next release: 26 January 2015. Vital events, January November 2014 Number 13 36% more maize was produced (Preliminary data of main crops, 2014) In 2014 the of all major crops
Release date: 22 January 2015 Next release: 26 January 2015. Vital events, January November 2014 Number 13 36% more maize was produced (Preliminary data of main crops, 2014) In 2014 the of all major crops
Sebastián Sáez Senior Trade Economist INTERNATIONAL TRADE DEPARTMENT WORLD BANK
 Sebastián Sáez Senior Trade Economist INTERNATIONAL TRADE DEPARTMENT WORLD BANK Despite enormous challenges many developing countries are service exporters Besides traditional activities such as tourism;
Correlation & Linear Regression in SPSS
 Correlation & Linear Regression in SPSS Types of dependence association between two nominal data mixed between a nominal and a ratio data correlation among ratio data Exercise 1 - Correlation File / Open
Expansion of Red Deer and afforestation in Hungary
 Expansion of Red Deer and afforestation in Hungary László Szemethy, Róbert Lehoczki, Krisztián Katona, Norbert Bleier, Sándor Csányi www.vmi.szie.hu Background and importance large herbivores are overpopulated
UNIVERSITY OF PUBLIC SERVICE Doctoral School of Military Sciences. AUTHOR S SUMMARY (Thesis) Balázs Laufer
 Balázs Laufer") DOI azonosító: 10.17625/NKE.2013.021 UNIVERSITY OF PUBLIC SERVICE Doctoral School of Military Sciences AUTHOR S SUMMARY (Thesis) Balázs Laufer LAW ENFORCEMENT AND NATIONAL SECURITY CHALLENGES POSED BY
DOI azonosító: 10.17625/NKE.2013.021 UNIVERSITY OF PUBLIC SERVICE Doctoral School of Military Sciences AUTHOR S SUMMARY (Thesis) Balázs Laufer LAW ENFORCEMENT AND NATIONAL SECURITY CHALLENGES POSED BY
ANGOL NYELV KÖZÉPSZINT SZÓBELI VIZSGA I. VIZSGÁZTATÓI PÉLDÁNY
 ANGOL NYELV KÖZÉPSZINT SZÓBELI VIZSGA I. VIZSGÁZTATÓI PÉLDÁNY A feladatsor három részből áll 1. A vizsgáztató társalgást kezdeményez a vizsgázóval. 2. A vizsgázó egy szituációs feladatban vesz részt a
Miskolci Egyetem Gazdaságtudományi Kar Üzleti Információgazdálkodási és Módszertani Intézet. Correlation & Linear. Petra Petrovics.
 Correlation & Linear Regression in SPSS Petra Petrovics PhD Student Types of dependence association between two nominal data mixed between a nominal and a ratio data correlation among ratio data Exercise
Construction of a cube given with its centre and a sideline
 Transformation of a plane of projection Construction of a cube given with its centre and a sideline Exercise. Given the center O and a sideline e of a cube, where e is a vertical line. Construct the projections
TRIANON HATÁSA A JUGOSZLÁVIAI MAGYAR KISEBBSÉG DEMOGRÁFIAI ALAKULÁSÁRA
 TRIANON HATÁSA A JUGOSZLÁVIAI MAGYAR KISEBBSÉG DEMOGRÁFIAI ALAKULÁSÁRA SEBŐK LÁSZLÓ Az 1920. június 4-i trianoni békeszerződés következtében öt magyarországi területrész a Bánság nyugati része, a Bácska
Miskolci Egyetem Gazdaságtudományi Kar Üzleti Információgazdálkodási és Módszertani Intézet Factor Analysis
 Factor Analysis Factor analysis is a multiple statistical method, which analyzes the correlation relation between data, and it is for data reduction, dimension reduction and to explore the structure. Aim
Cashback 2015 Deposit Promotion teljes szabályzat
 Cashback 2015 Deposit Promotion teljes szabályzat 1. Definitions 1. Definíciók: a) Account Client s trading account or any other accounts and/or registers maintained for Számla Az ügyfél kereskedési számlája
A jövedelem alakulásának vizsgálata az észak-alföldi régióban az 1997-99. évi adatok alapján
 A jövedelem alakulásának vizsgálata az észak-alföldi régióban az 1997-99. évi adatok alapján Rózsa Attila Debreceni Egyetem Agrártudományi Centrum, Agrárgazdasági és Vidékfejlesztési Intézet, Számviteli
Angol Középfokú Nyelvvizsgázók Bibliája: Nyelvtani összefoglalás, 30 kidolgozott szóbeli tétel, esszé és minta levelek + rendhagyó igék jelentéssel
 Angol Középfokú Nyelvvizsgázók Bibliája: Nyelvtani összefoglalás, 30 kidolgozott szóbeli tétel, esszé és minta levelek + rendhagyó igék jelentéssel Timea Farkas Click here if your download doesn"t start
Emelt szint SZÓBELI VIZSGA VIZSGÁZTATÓI PÉLDÁNY VIZSGÁZTATÓI. (A részfeladat tanulmányozására a vizsgázónak fél perc áll a rendelkezésére.
 Emelt szint SZÓBELI VIZSGA VIZSGÁZTATÓI PÉLDÁNY VIZSGÁZTATÓI PÉLDÁNY A feladatsor három részből áll 1. A vizsgáztató társalgást kezdeményez a vizsgázóval. 2. A vizsgázó egy vita feladatban vesz részt a
EN United in diversity EN A8-0206/419. Amendment
 22.3.2019 A8-0206/419 419 Article 2 paragraph 4 point a point i (i) the identity of the road transport operator; (i) the identity of the road transport operator by means of its intra-community tax identification
FORGÁCS ANNA 1 LISÁNYI ENDRÉNÉ BEKE JUDIT 2
 FORGÁCS ANNA 1 LISÁNYI ENDRÉNÉ BEKE JUDIT 2 Hátrányos-e az új tagállamok számára a KAP támogatások disztribúciója? Can the CAP fund distribution system be considered unfair to the new Member States? A
ENROLLMENT FORM / BEIRATKOZÁSI ADATLAP
 ENROLLMENT FORM / BEIRATKOZÁSI ADATLAP CHILD S DATA / GYERMEK ADATAI PLEASE FILL IN THIS INFORMATION WITH DATA BASED ON OFFICIAL DOCUMENTS / KÉRJÜK, TÖLTSE KI A HIVATALOS DOKUMENTUMOKBAN SZEREPLŐ ADATOK
A KÁRPÁT-MEDENCE FÖLDRAJZA
 Bulla Béla - Mendöl Tibor A KÁRPÁT-MEDENCE FÖLDRAJZA KOCSIS KAROLY TÁRSADALOM ÉS GAZDASÁG NAPJAINKBAN A KÁRPÁT-MEDENCÉBEN C. TANULMÁNYÁVAL AZ ORSZÁGOS KOZNEVELESI TANACS 1947. EVI KIADÁSA ALAPJÁN KÖZREADJA
Miskolci Egyetem Gazdaságtudományi Kar Üzleti Információgazdálkodási és Módszertani Intézet. Hypothesis Testing. Petra Petrovics.
 Hypothesis Testing Petra Petrovics PhD Student Inference from the Sample to the Population Estimation Hypothesis Testing Estimation: how can we determine the value of an unknown parameter of a population
FÖLDRAJZ ANGOL NYELVEN GEOGRAPHY
 Földrajz angol nyelven középszint 0513 ÉRETTSÉGI VIZSGA 2005. május 18. FÖLDRAJZ ANGOL NYELVEN GEOGRAPHY KÖZÉPSZINTŰ ÍRÁSBELI VIZSGA STANDARD LEVEL WRITTEN EXAMINATION Duration of written examination:
FÖLDRAJZ ANGOL NYELVEN
 Földrajz angol nyelven középszint 0821 ÉRETTSÉGI VIZSGA 2009. május 14. FÖLDRAJZ ANGOL NYELVEN KÖZÉPSZINTŰ ÍRÁSBELI ÉRETTSÉGI VIZSGA JAVÍTÁSI-ÉRTÉKELÉSI ÚTMUTATÓ OKTATÁSI ÉS KULTURÁLIS MINISZTÉRIUM Paper
FÖLDRAJZ ANGOL NYELVEN
 Földrajz angol nyelven középszint 1411 ÉRETTSÉGI VIZSGA 2015. május 14. FÖLDRAJZ ANGOL NYELVEN KÖZÉPSZINTŰ ÍRÁSBELI ÉRETTSÉGI VIZSGA JAVÍTÁSI-ÉRTÉKELÉSI ÚTMUTATÓ EMBERI ERŐFORRÁSOK MINISZTÉRIUMA Paper
Smaller Pleasures. Apróbb örömök. Keleti lakk tárgyak Répás János Sándor mûhelyébõl Lacquerware from the workshop of Répás János Sándor
 Smaller Pleasures Apróbb örömök Keleti lakk tárgyak Répás János Sándor mûhelyébõl Lacquerware from the workshop of Répás János Sándor Smaller Pleasures Oriental lacquer, or urushi by its frequently used
Harvested production of cereals increases about one third in 2013 (Preliminary production data of main crops, 2013)
") Release date: 22 January 2014 Next release: 24 January 2014. Vital events, January November 2013 Number 13 Harvested of cereals increases about one third in 2013 (Preliminary data of main crops, 2013)
Release date: 22 January 2014 Next release: 24 January 2014. Vital events, January November 2013 Number 13 Harvested of cereals increases about one third in 2013 (Preliminary data of main crops, 2013)
AZ NFSZ ADATAINAK ÖSSZEFOGLALÓ TÁBLÁZATA SUMMARY REPORT OF THE NATIONAL EMPLOYMENT SERVICE november/ November 2017
 AZ NFSZ ADATAINAK ÖSSZEFOGLALÓ TÁBLÁZATA SUMMARY REPORT OF THE NATIONAL EMPLOYMENT SERVICE Nyilvántartott álláskeresők összesen Registered jobseekers total Ebből / From this Kategóriák / Categories álláskeresési
AZ NFSZ ADATAINAK ÖSSZEFOGLALÓ TÁBLÁZATA SUMMARY REPORT OF THE NATIONAL EMPLOYMENT SERVICE január/ January 2017
 AZ NFSZ ADATAINAK ÖSSZEFOGLALÓ TÁBLÁZATA SUMMARY REPORT OF THE NATIONAL EMPLOYMENT SERVICE Nyilvántartott álláskeresők összesen Registered jobseekers total Ebből / From this Kategóriák / Categories álláskeresési
DF HELYETTESÍTŐ NYELVVIZSGA 1. (Angol nyelv) 2014. február 21. Név:. Neptunkód: 1. feladat 1... 2... 3... 4... 5... 6... 7... 8... 9... 10...
 2014. február 21. Név:. Neptunkód: 1. feladat 1... 2... 3... 4... 5... 6... 7... 8... 9... 10...") Név:. Neptunkód: MEGOLDÓLAP 1. feladat 1.... 2.... 3.... 4.... 5.... 6.... 7.... 8.... 9.... 10.... Elért pontszám:. 2. feladat 1. 6. 11. 2. 7. 12. 3. 8. 13. 4. 9. 14. 5. 10. 15. Elért pontszám:. 3. feladat
Név:. Neptunkód: MEGOLDÓLAP 1. feladat 1.... 2.... 3.... 4.... 5.... 6.... 7.... 8.... 9.... 10.... Elért pontszám:. 2. feladat 1. 6. 11. 2. 7. 12. 3. 8. 13. 4. 9. 14. 5. 10. 15. Elért pontszám:. 3. feladat
Gottsegen National Institute of Cardiology. Prof. A. JÁNOSI
 Myocardial Infarction Registry Pilot Study Hungarian Myocardial Infarction Register Gottsegen National Institute of Cardiology Prof. A. JÁNOSI A https://ir.kardio.hu A Web based study with quality assurance
AZ ÁFSZ ADATAINAK ÖSSZEFOGLALÓ TÁBLÁZATA SUMMARY REPORT OF THE HUNGARIAN PUBLIC EMPLOYMENT SERVICE október / October 2008
 AZ ÁFSZ ADATAINAK ÖSSZEFOGLALÓ TÁBLÁZATA SUMMARY REPORT OF THE HUNGARIAN PUBLIC EMPLOYMENT SERVICE Kategóriák / Categories Létszám, fő Number of képest / Changes compared to previous Változás az előző
A CSECSEMŐHALANDÓSÁG ÉS AZ ANYAI HALÁLOZÁSOK ALAKULÁSA SZÁZADUNKBAN *
 A CSECSEMŐHALANDÓSÁG ÉS AZ ANYAI HALÁLOZÁSOK ALAKULÁSA SZÁZADUNKBAN * GÁRDOS ÉVA JOUBERT KÁLMÁN Összefoglalás A csecsemőhalandóság szintje egy adott ország gazdasági, szociális, kulturális viszonyait tükrözi.
AZ NFSZ ADATAINAK ÖSSZEFOGLALÓ TÁBLÁZATA SUMMARY REPORT OF THE NATIONAL EMPLOYMENT SERVICE január/ January 2019
 AZ NFSZ ADATAINAK ÖSSZEFOGLALÓ TÁBLÁZATA SUMMARY REPORT OF THE NATIONAL EMPLOYMENT SERVICE Nyilvántartott álláskeresők összesen Registered jobseekers total Ebből / From this Kategóriák / Categories álláskeresési
THE RELATIONSHIP BETWEEN THE STATE OF EDUCATION AND THE LABOUR MARKET IN HUNGARY CSEHNÉ PAPP, IMOLA
 THE RELATIONSHIP BETWEEN THE STATE OF EDUCATION AND THE LABOUR MARKET IN HUNGARY CSEHNÉ PAPP, IMOLA Keywords: unemployment, employment policy, education system. The most dramatic socio-economic change
AZ NFSZ ADATAINAK ÖSSZEFOGLALÓ TÁBLÁZATA SUMMARY REPORT OF THE NATIONAL EMPLOYMENT SERVICE december / December 2015
 AZ NFSZ ADATAINAK ÖSSZEFOGLALÓ TÁBLÁZATA SUMMARY REPORT OF THE NATIONAL EMPLOYMENT SERVICE Nyilvántartott álláskeresők összesen Registered jobseekers total Ebből / From this Kategóriák / Categories álláskeresési
Az aridifikáció fogalmának értelmezése
 Földrajzi Értesítő XLV. évf. 1996.1-2. füzei, pp. 5-9. Az aridifikáció fogalmának értelmezése KERTÉSZ ÁDÁM Bevezetés A globális változások (global changc) kutatása az utóbbi évtized egyik legfontosabb
A TÓGAZDASÁGI HALTERMELÉS SZERKEZETÉNEK ELEMZÉSE. SZATHMÁRI LÁSZLÓ d r.- TENK ANTAL dr. ÖSSZEFOGLALÁS
 A TÓGAZDASÁGI HALTERMELÉS SZERKEZETÉNEK ELEMZÉSE SZATHMÁRI LÁSZLÓ d r.- TENK ANTAL dr. ÖSSZEFOGLALÁS A hazai tógazdasági haltermelés a 90-es évek közepén tapasztalt mélypontról elmozdult és az utóbbi három
AZ NFSZ ADATAINAK ÖSSZEFOGLALÓ TÁBLÁZATA SUMMARY REPORT OF THE NATIONAL EMPLOYMENT SERVICE február/ February 2019
 AZ NFSZ ADATAINAK ÖSSZEFOGLALÓ TÁBLÁZATA SUMMARY REPORT OF THE NATIONAL EMPLOYMENT SERVICE Nyilvántartott álláskeresők összesen Registered jobseekers total Ebből / From this Kategóriák / Categories álláskeresési
AZ NFSZ ADATAINAK ÖSSZEFOGLALÓ TÁBLÁZATA SUMMARY REPORT OF THE NATIONAL EMPLOYMENT SERVICE június/ June 2018
 AZ NFSZ ADATAINAK ÖSSZEFOGLALÓ TÁBLÁZATA SUMMARY REPORT OF THE NATIONAL EMPLOYMENT SERVICE Nyilvántartott álláskeresők összesen Registered jobseekers total Ebből / From this Kategóriák / Categories álláskeresési
AZ NFSZ ADATAINAK ÖSSZEFOGLALÓ TÁBLÁZATA SUMMARY REPORT OF THE NATIONAL EMPLOYMENT SERVICE augusztus/ August 2018
 AZ NFSZ ADATAINAK ÖSSZEFOGLALÓ TÁBLÁZATA SUMMARY REPORT OF THE NATIONAL EMPLOYMENT SERVICE Nyilvántartott álláskeresők összesen Registered jobseekers total Ebből / From this Kategóriák / Categories álláskeresési
AZ NFSZ ADATAINAK ÖSSZEFOGLALÓ TÁBLÁZATA SUMMARY REPORT OF THE NATIONAL EMPLOYMENT SERVICE július/ July 2018
 AZ NFSZ ADATAINAK ÖSSZEFOGLALÓ TÁBLÁZATA SUMMARY REPORT OF THE NATIONAL EMPLOYMENT SERVICE Nyilvántartott álláskeresők összesen Registered jobseekers total Ebből / From this Kategóriák / Categories álláskeresési
AZ NFSZ ADATAINAK ÖSSZEFOGLALÓ TÁBLÁZATA SUMMARY REPORT OF THE NATIONAL EMPLOYMENT SERVICE október/ October 2018
 AZ NFSZ ADATAINAK ÖSSZEFOGLALÓ TÁBLÁZATA SUMMARY REPORT OF THE NATIONAL EMPLOYMENT SERVICE Nyilvántartott álláskeresők összesen Registered jobseekers total Ebből / From this Kategóriák / Categories álláskeresési
AZ NFSZ ADATAINAK ÖSSZEFOGLALÓ TÁBLÁZATA SUMMARY REPORT OF THE NATIONAL EMPLOYMENT SERVICE március/ March 2018
 AZ NFSZ ADATAINAK ÖSSZEFOGLALÓ TÁBLÁZATA SUMMARY REPORT OF THE NATIONAL EMPLOYMENT SERVICE Nyilvántartott álláskeresők összesen Registered jobseekers total Ebből / From this Kategóriák / Categories álláskeresési
AZ NFSZ ADATAINAK ÖSSZEFOGLALÓ TÁBLÁZATA SUMMARY REPORT OF THE NATIONAL EMPLOYMENT SERVICE szeptember/ September 2018
 AZ NFSZ ADATAINAK ÖSSZEFOGLALÓ TÁBLÁZATA SUMMARY REPORT OF THE NATIONAL EMPLOYMENT SERVICE Nyilvántartott álláskeresők összesen Registered jobseekers total Ebből / From this Kategóriák / Categories álláskeresési
AZ NFSZ ADATAINAK ÖSSZEFOGLALÓ TÁBLÁZATA SUMMARY REPORT OF THE NATIONAL EMPLOYMENT SERVICE december/ December 2018
 AZ NFSZ ADATAINAK ÖSSZEFOGLALÓ TÁBLÁZATA SUMMARY REPORT OF THE NATIONAL EMPLOYMENT SERVICE Nyilvántartott álláskeresők összesen Registered jobseekers total Ebből / From this Kategóriák / Categories álláskeresési
AZ NFSZ ADATAINAK ÖSSZEFOGLALÓ TÁBLÁZATA SUMMARY REPORT OF THE NATIONAL EMPLOYMENT SERVICE november/ November 2018
 AZ NFSZ ADATAINAK ÖSSZEFOGLALÓ TÁBLÁZATA SUMMARY REPORT OF THE NATIONAL EMPLOYMENT SERVICE Nyilvántartott álláskeresők összesen Registered jobseekers total Ebből / From this Kategóriák / Categories álláskeresési
EN United in diversity EN A8-0206/482. Amendment
 21.3.2019 A8-0206/482 482 Recital 13 g (new) (13g) In recognition of the need for specific treatment for the transport sector, in which movement is the very essence of the work undertaken by drivers, the
RÉZKULTÚRA BUDAPESTEN
 RÉZKULTÚRA BUDAPESTEN A rezet megmunkálhatósága és idôtállósága miatt évszázadok óta használjuk. Alkalmazása egyértelmûen megbízható és gazdaságos. Színe, diszkrét fénye, a belôle készült tárgyak eleganciája
A riport fordulónapja / Date of report december 31. / 31 December, 2017
 CRR Art. 129 Report Kibocsátó / Issuer Erste Jelzálogbank Zrt. A riport fordulónapja / Date of report 2017. december 31. / 31 December, 2017 1. A fedezetek és a forgalomban lévő fedezett kötvényállomány
- Bevándoroltak részére kiadott személyazonosító igazolvány
 HUNGARY - Bevándoroltak részére kiadott személyazonosító igazolvány (Blue booklet form or card format issued for permanent residents - from 1 January 2000 a new card format has been introduced and issued)
Utolsó frissítés / Last update: február Szerkesztő / Editor: Csatlós Árpádné
 Utolsó frissítés / Last update: 2016. február Szerkesztő / Editor: Csatlós Árpádné TARTALOM / Contents BEVEZETŐ / Introduction... 2 FELNŐTT TAGBÉLYEGEK / Adult membership stamps... 3 IFJÚSÁGI TAGBÉLYEGEK
Minta ANGOL NYELV KÖZÉPSZINT SZÓBELI VIZSGA II. Minta VIZSGÁZTATÓI PÉLDÁNY
 ANGOL NYELV KÖZÉPSZINT SZÓBELI VIZSGA II. A feladatsor három részből áll VIZSGÁZTATÓI PÉLDÁNY 1. A vizsgáztató társalgást kezdeményez a vizsgázóval. 2. A vizsgázó egy szituációs feladatban vesz részt a
Dr. Sasvári Péter Egyetemi docens
 A KKV-k Informatikai Infrastruktúrájának vizsgálata a Visegrádi országokban The Analysis Of The IT Infrastructure Among SMEs In The Visegrád Group Of Countries Dr. Sasvári Péter Egyetemi docens MultiScience
A munkaerı-piaci helyzet alakulása a Nemzeti Foglalkoztatási Szolgálat legfrissebb adatai alapján 2012. július
 A munkaerı-piaci helyzet alakulása a Nemzeti Foglalkoztatási Szolgálat legfrissebb adatai alapján 2012. július A foglalkoztatók az illetékes kirendeltségeken 2012. július hónap folyamán összesen 37,9 ezer
Seven Verses. from the Bhagavad Gita. by Swami Shyam. in Hungarian. magyarul
 Seven Verses from the Bhagavad Gita by Swami Shyam Swami Shyam has translated the Bhagavad Gita from the original Sanskrit into English and Hindi. He selected these seven essential verses to be sung and
Can/be able to. Using Can in Present, Past, and Future. A Can jelen, múlt és jövő idejű használata
 Can/ Can is one of the most commonly used modal verbs in English. It be used to express ability or opportunity, to request or offer permission, and to show possibility or impossibility. A az egyik leggyakrabban
FÖLDRAJZ ANGOL NYELVEN
 Földrajz angol nyelven középszint 1112 ÉRETTSÉGI VIZSGA 2014. május 15. FÖLDRAJZ ANGOL NYELVEN KÖZÉPSZINTŰ ÍRÁSBELI ÉRETTSÉGI VIZSGA JAVÍTÁSI-ÉRTÉKELÉSI ÚTMUTATÓ EMBERI ERŐFORRÁSOK MINISZTÉRIUMA Paper
Statistical Dependence
 Statistical Dependence Petra Petrovics Statistical Dependence Deinition: Statistical dependence exists when the value o some variable is dependent upon or aected by the value o some other variable. Independent
Jobbik extended its influence in the municipalities
 Jobbik extended its influence in the municipalities At the municipal, Jobbik managed to hold on to the majority of its mayoral seats; except in one county, it is the second largest party in county general
9. Táppénz Sick-pay TÁPPÉNZ SICK-PAY 153
 9. Táppénz Sick-pay 9.1. Kifizetőhelyi betegszabadsági adatok... 154 Sick-leave data on payment offices 9.2. Összefoglaló táppénzes adatok... 154 Aggregate sick-pay data 9.3. Táppénzes adatok a foglalkoztatás
Balogh András publikációs listája
 Balogh András publikációs listája BALOGH A. 2001. Gazdaságfejlesztési elképzelések a Dél-alföldi Régióban. I. Magyar Földrajzi Konferencia, Szeged (CD-ROM kiadvány). BAJMÓCY P.- BALOGH A. 2002. Az aprófalvak
3. MINTAFELADATSOR KÖZÉPSZINT. Az írásbeli vizsga időtartama: 30 perc. III. Hallott szöveg értése
 Oktatáskutató és Fejlesztő Intézet TÁMOP-3.1.1-11/1-2012-0001 XXI. századi közoktatás (fejlesztés, koordináció) II. szakasz ANGOL NYELV 3. MINTAFELADATSOR KÖZÉPSZINT Az írásbeli vizsga időtartama: 30 perc
A KOZMOPOLITA EURÓPA ÉS A GLOBALIZÁCIÓ PÁLYÁI. Tamás Pál MTA Szociológiai Intézet, Budapest
 A KOZMOPOLITA EURÓPA ÉS A GLOBALIZÁCIÓ PÁLYÁI Tamás Pál MTA Szociológiai Intézet, Budapest Diagrammatic representation of the conceptual framework of vulnerability, coping range and adaptive capacity SOCIALLY
Statistical Inference
 Petra Petrovics Statistical Inference 1 st lecture Descriptive Statistics Inferential - it is concerned only with collecting and describing data Population - it is used when tentative conclusions about
REGIONAL COMPARISON OF FARMS ON THE BASIS OF THE FADN DATABASE. PESTI, CSABA - KESZTHELYI, KRISZTIÁN - Dr. TÓTH, TAMÁS SUMMARY
 REGIONAL COMPARISON OF FARMS ON THE BASIS OF THE FADN DATABASE PESTI, CSABA - KESZTHELYI, KRISZTIÁN - Dr. TÓTH, TAMÁS SUMMARY The territorial structure of Hungarian farms was investigated. The results
Using the CW-Net in a user defined IP network
 Using the CW-Net in a user defined IP network Data transmission and device control through IP platform CW-Net Basically, CableWorld's CW-Net operates in the 10.123.13.xxx IP address range. User Defined
ANGOL NYELV KÖZÉPSZINT SZÓBELI VIZSGA I. VIZSGÁZTATÓI PÉLDÁNY
 ANGOL NYELV KÖZÉPSZINT SZÓBELI VIZSGA I. VIZSGÁZTATÓI PÉLDÁNY A feladatsor három részbol áll 1. A vizsgáztató társalgást kezdeményez a vizsgázóval. 2. A vizsgázó egy szituációs feladatban vesz részt a
FÖLDRAJZ ANGOL NYELVEN
 Földrajz angol nyelven középszint 1012 ÉRETTSÉGI VIZSGA 2012. május 16. FÖLDRAJZ ANGOL NYELVEN KÖZÉPSZINTŰ ÍRÁSBELI ÉRETTSÉGI VIZSGA JAVÍTÁSI-ÉRTÉKELÉSI ÚTMUTATÓ NEMZETI ERŐFORRÁS MINISZTÉRIUM Paper 1
AZ ÁFSZ ADATAINAK ÖSSZEFOGLALÓ TÁBLÁZATA SUMMARY REPORT OF THE HUNGARIAN PUBLIC EMPLOYMENT SERVICE november / November 2007
 AZ ÁFSZ ADATAINAK ÖSSZEFOGLALÓ TÁBLÁZATA SUMMARY REPORT OF THE HUNGARIAN PUBLIC EMPLOYMENT SERVICE Kategóriák / Categories Létszám, fő Number of képest / Changes compared to previous Változás az előző
LUCRĂRI ŞTIINŢIFICE, SERIA I, VOL. XI (1) CHANGES IN COMMERCIAL ACTIVITIES IN MEZŐHEGYES (1989-2006)
 CHANGES IN COMMERCIAL ACTIVITIES IN MEZŐHEGYES (1989-2006)") LUCRĂRI ŞTIINŢIFICE, SERIA I, VOL. XI (1) CHANGES IN COMMERCIAL ACTIVITIES IN MEZŐHEGYES (1989-2006) SCHIMBĂRI ALE ACTIVITĂŢII COMERCIALE ÎN MEZŐHEGYES (1989-2006) BRIGITTA ZSÓTÉR * In Mezőhegyes there
LUCRĂRI ŞTIINŢIFICE, SERIA I, VOL. XI (1) CHANGES IN COMMERCIAL ACTIVITIES IN MEZŐHEGYES (1989-2006) SCHIMBĂRI ALE ACTIVITĂŢII COMERCIALE ÎN MEZŐHEGYES (1989-2006) BRIGITTA ZSÓTÉR * In Mezőhegyes there
AZ ÁFSZ ADATAINAK ÖSSZEFOGLALÓ TÁBLÁZATA SUMMARY REPORT OF THE HUNGARIAN PUBLIC EMPLOYMENT SERVICE december / December 2007
 AZ ÁFSZ ADATAINAK ÖSSZEFOGLALÓ TÁBLÁZATA SUMMARY REPORT OF THE HUNGARIAN PUBLIC EMPLOYMENT SERVICE Kategóriák / Categories Létszám, fő Number of képest / Changes compared to previous Változás az előző
Központi Statisztikai Hivatal Hungarian Central Statistical Office
 Központi Statisztikai Hivatal Hungarian Central Statistical Office MUNKAERŐ-PIACI HELYZETKÉP 2005 LABOUR FORCE SURVEY 2005 Budapest, 2006 Készült a Központi Statisztikai Hivatal Életszínvonal- és Emberierőforrás-statisztikai
AZ ÁFSZ ADATAINAK ÖSSZEFOGLALÓ TÁBLÁZATA SUMMARY REPORT OF THE HUNGARIAN PUBLIC EMPLOYMENT SERVICE január / January 2008
 AZ ÁFSZ ADATAINAK ÖSSZEFOGLALÓ TÁBLÁZATA SUMMARY REPORT OF THE HUNGARIAN PUBLIC EMPLOYMENT SERVICE Kategóriák / Categories Létszám, fő Number of képest / Changes compared to previous Változás az előző
24th October, 2005 Budapest, Hungary. With Equal Opportunities on the Labour Market
 24th October, 2005 Budapest, Hungary Nemzeti és Etnikai Kisebbségi Jogok With Equal Opportunities on the Labour Market Equal Opportunities for the Roma Nemzeti és Etnikai Kisebbségi Jogok The government
On The Number Of Slim Semimodular Lattices
 On The Number Of Slim Semimodular Lattices Gábor Czédli, Tamás Dékány, László Ozsvárt, Nóra Szakács, Balázs Udvari Bolyai Institute, University of Szeged Conference on Universal Algebra and Lattice Theory
USER MANUAL Guest user
 USER MANUAL Guest user 1 Welcome in Kutatótér (Researchroom) Top menu 1. Click on it and the left side menu will pop up 2. With the slider you can make left side menu visible 3. Font side: enlarging font
A munkaerı-piaci helyzet alakulása a Nemzeti Foglalkoztatási Szolgálat legfrissebb adatai alapján 2013. január
 A munkaerı-piaci helyzet alakulása a Nemzeti Foglalkoztatási Szolgálat legfrissebb adatai alapján 2013. január A támogatott munkaerıigények domináltak januárban Az év elsı hónapjában több mint három ezer
EEA, Eionet and Country visits. Bernt Röndell - SES
 EEA, Eionet and Country visits Bernt Röndell - SES Európai Környezetvédelmi Ügynökség Küldetésünk Annak elősegítése, hogy az EU és a tagállamok a szükséges információk alapján hozhassák meg a környezet
The Crisis Year in Seklerland: 1949
 The Crisis Year in Seklerland: 1949 In Romania, the political turning point was 1948, but on the local level the political, economic and social changes could be felt only by 1949. Going through the events
MAGYARORSZAG TORTENETI STATISZTIKAI HELYSEGNEVTARA
 KOZPONTI STATISZTIKAI HIVATAL NEPSZAMLALASI FOOSZTALY SUB Gottingen 7 214 265 51X MAGYARORSZAG TORTENETI STATISZTIKAI HELYSEGNEVTARA 16. Szabolcs-Szatmar-Bereg megye Budapest, 2000 TARTALOMJEGYZEK I/a
Supporting Information
 Supporting Information Cell-free GFP simulations Cell-free simulations of degfp production were consistent with experimental measurements (Fig. S1). Dual emmission GFP was produced under a P70a promoter
SEGÍTSÉG A GAZDÁLKODÓ KÉTNYELVŰ KÖZÉPFOKÚ SZÓBELI NYELVVIZSGÁHOZ - ÜZLETI MODUL
 A gazdálkodó középfokú kétnyelvű üzleti nyelvvizsga szóbeli része három feladatból áll. Az első, körülbelül 5 perces rész a szakmai interjú. Ebben a részben a vizsgáztató 2-3 szakmai témában tesz fel kérdéseket
ANGOL NYELVI SZINTFELMÉRŐ 2013 A CSOPORT. on of for from in by with up to at
 ANGOL NYELVI SZINTFELMÉRŐ 2013 A CSOPORT A feladatok megoldására 45 perc áll rendelkezésedre, melyből körülbelül 10-15 percet érdemes a levélírási feladatra szánnod. Sok sikert! 1. Válaszd ki a helyes
9. Táppénz Sick-pay TÁPPÉNZ SICK-PAY 159
 9. Táppénz Sick-pay 9.1. Kifizetőhelyi betegszabadsági adatok... 160 Sick-leave data on payment offices 9.2. Összefoglaló táppénzes adatok... 160 Aggregate sick-pay data 9.3. Táppénzes adatok a foglalkoztatás
1. Főbb demográfiai és gazdasági aktivitási adatok Main data on population and economic activity
 1. Főbb demográfiai és gazdasági aktivitási adatok Main data on population and economic activity 1.1. A települések száma és népessége (január 1.)... 2 Number of settlements and population (1 January)
EN United in diversity EN A8-0206/473. Amendment
 21.3.2019 A8-0206/473 473 Recital 12 d (new) (12d) Since there is no sufficient link of a driver with a territory of a Member State of transit, transit operations should not be considered as posting situations.
Musical Map of Hungary. Music Collections and Memorial Museums
 Musical Map of Hungary Music Collections and Memorial Museums MEMBERS OF THE CLASS OF COMPOSITION GRADUATED FROMTHE ACADEMY OF MUSIC IN 1906 SITTING FROM LEFT: VICTOR JAKOBY, RÓBERT MESZLÉNYI, SÁNDOR KOVÁCS
Paediatrics: introduction. Historical data.
 Paediatrics: introduction. Historical data. Dr. György Fekete Aim of the present lecture To demonstrate: - the wonderful nature of this discipline - the differences as compared to other medical activities,